

Abstract
Bacteria, as well as the plastid organelles of algae and higher plants, utilize proteins of the suf operon. These are involved in Fe-S cluster assembly, particularly under conditions of iron limitation or oxidative stress. Genetic experiments in some organisms found that the ATPase SufC is essential, though its role in Fe-S biogenesis remains unclear. To ascertain how interactions with other individual Suf proteins affect the activity of SufC we coexpressed it with either SufB or SufD from Thermotoga maritima and purified the resulting SufBC and SufCD complexes. Analytical ultracentrifuge and multiangle light-scattering measurements showed that the SufBC complex exists in solution as the tetrameric SufB2C2 species, whereas SufCD exists as an equilibrium mixture of SufCD and SufC2D2. Transient kinetic studies of the complexes were made using fluorescent 2′(3′)-O-(N-methylanthraniloyl-(mant) analogues of ATP and ADP. Both SufBC and SufCD bound mantATP and mantADP much more tightly than does SufC alone. Compared to the cleavage step of the mantATPase of SufC alone, that of SufBC was accelerated 180-fold and that of SufCD only fivefold. Given that SufB and SufD have 20% sequence identity and similar predicted secondary structures, the different hydrodynamic properties and kinetic mechanisms of the two complexes are discussed.
Keywords: Suf proteins, ATPase, hydrodynamics, kinetic mechanism
The Suf system first described in eubacteria is one of four pathways for assembly of Fe-S clusters, the others being Isc, Nif, and Csd (Takahashi and Tokumoto 2002; Loiseau et al. 2005). The Suf proteins comprise SufR, A, B, C, D, E, U, and S (Johnson et al. 2005). The key enzyme appears to be the desulfurase SufS, an ortholog of NifS and IscS that releases sulfur from cysteine in the form of a transient persulfate (Zheng et al. 1993, 1994). Besides biosynthesis of Fe-S clusters, this desulfurase activity has been linked to the formation of thiamine, biotin, lipoic acid, molybdopterin, selenoproteins, NAD, and thionucleosides in tRNAs (Mihara and Esaki 2002). Usually involvement of the Suf system in Fe-S assembly is secondary to Isc, being significant only under conditions of iron limitation or oxidative stress (Outten et al. 2004). However, Suf is essential in various organisms, including cyanobacteria and Mycobacterium tuberculosis, where it is the only system available for Fe-S cluster assembly (Huet et al. 2005). Also, intracellular organelles of higher plants show a dichotomy between Isc and Suf. Knockouts of suf genes in Arabidopsis thaliana result in embryonic death (Xu and Moller 2004).
Our understanding of how individual Suf proteins interact, and what their primary roles are, lags behind that of the Nif and Isc systems. Here we have examined heterologously expressed Suf proteins from the thermophilic bacterium Thermotoga maritima so as to address an issue of central interest, namely how SufB, -C, and -D interact to form an active complex. The structures of SufC (Watanabe et al. 2005; Kitaoka et al. 2006) and SufD (Badger et al. 2005) have been solved. SufC is similar to the nucleotide-binding domain of ABC transporters, although there is no evidence that it functions as one. It has a unique Q-loop structure on the surface that has been postulated to be the binding site of SufD and/or SufB (Wilson et al. 2003; Watanabe et al. 2005; Kitaoka et al. 2006). SufD is a novel structure and forms a crystallographic dimer. Though the structure of SufB has yet to be solved and it has little sequence identity (∼20%) with SufD, secondary structure predictions suggest it shares a similar fold.
Earlier observations showed that the desulfurase activity of the catalytic complex SufS/E in Escherichia coli is enhanced fourfold by interaction with the SufBCD complex (Outten et al. 2003). We and others have shown that SufC is an ATPase and that it interacts catalytically with SufB (Rangachari et al. 2002; Nachin et al. 2003, Eccleston et al. 2006). Our studies of the ATPase mechanism using 2′(3′)-O-(N-methylanthraniloyl)- (mant) analogue nucleotides and transient kinetic techniques indicate that SufC initially binds ATP very weakly, followed by a conformational change of the SufC.ATP complex and then a slow hydrolysis step. ADP was bound to SufC more tightly than ATP and under our conditions remained bound (Eccleston et al. 2006). We expressed SufB, but it existed as a complex mixture of oligomers. This precluded quantitative kinetic studies of its effect on the SufC ATPase, though we were able to show that SufB accelerates the cleavage step of the hydrolysis reaction and reduces the dissociation rate constant of mantADP from SufC.
Here we have coexpressed SufB and -C, as well as SufC and -D, and purified the SufBC and SufCD complexes. We characterize them hydrodynamically and compare their interaction with fluorescent mant adenosine nucleotides with that of SufC alone.
Results
Characterization of the oligomeric state of the SufBC and SufCD complexes
Soluble complexes of SufBC and SufCD of T. maritima were overexpressed in E. coli (Fig. 1). In order to measure the stoichiometry of the proteins in each complex, six rounds of Edman degradation were made. The results shown in Table 1 are consistent with both complexes comprising equimolar amounts of SufC and -B or -D.
Figure 1.
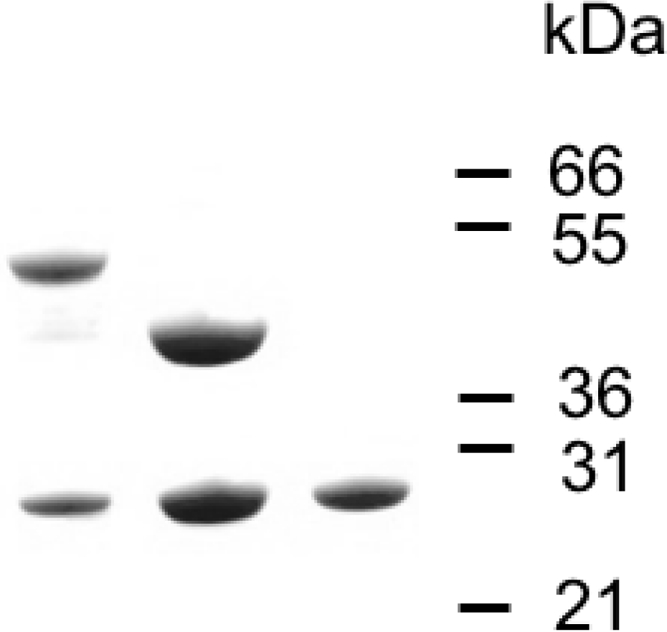
SDS acrylamide gel of (left to right) SufBC, SufCD, and SufC. The numbers are protein standards in kilodaltons.
Table 1.
Six rounds of the Edman degradation analysis of the SufBC and SufCD complexes

The stoichiometry also was determined using quantitative SDS electrophoresis (Noble et al. 2004). From the absorbance of the complexes at 280 nm, the concentration of SufC in both complexes was calculated based on the theoretical extinction coefficients of putative 2:1, 1:1, and 1:2 contributions of SufC and SufB or SufD to the complexes. Aliquots of 1.0 and 2.0 μg of SufC were loaded onto a gel as standards, together with aliquots of the complexes containing the same amounts of SufC based on the above calculations. After electrophoresis, gels were stained with Coomassie Blue, and the integrated intensity of each peak was determined. With both SufBC and SufCD complexes, the samples loaded, assuming a 1:1 ratio, gave the closest values to the SufC standards (Table 2).
Table 2.
Quantitative SDS gel analysis of the SufBC and SufCD complexes

Although the above results show that the complexes exist with equimolar amounts of their components, they do not inform about the oligomeric state. For this, hydrodynamic measurements were required. Data from a sedimentation velocity experiment on the SufBC complex were fitted to a distribution of sedimentation coefficients (Fig. 2A). A good fit was obtained showing a major species with a sedimentation coefficient of 6.75 s. Using the average frictional coefficient obtained from the fit (1.35), the calculated molecular weight was 149 kDa. However, both faster and slower sedimenting species were also present. Size exclusion chromatography monitored by multiangle light-scattering measurements also showed the presence of some heterogeneity of SufBC with respect to its oligomeric state (Fig. 3A). The molecular weight of the major component was calculated at 170 kDa, but some faster eluting (larger) material showed a distribution of molecular weights, and there was a small amount of slower eluting material. Sedimentation equilibrium measurements were also made, but given the presence of some higher oligomeric material, it was difficult to analyze the results. The calculated molecular weights for the putative SufBC, SufB2C2, SufBC2, and SufB2C complexes are 81, 161, 109, and 132 kDa, respectively. We therefore interpret our hydrodynamic data as showing that the complex exists as SufB2C2.
Figure 2.

Sedimentation velocity of SufBC and SufCD. Analytical ultracentrifuge velocity measurements of (A) SufBC and (B) SufCD were analyzed as distributions of sedimentation coefficients.
Figure 3.

Multiangle light-scattering measurements of SufBC and SufCD. Solution molecular weight of the SufBC and SufCD complexes determined using SEC-MALS. The elution profiles produced by application of 300 μg of SufBC and 300 μg of SufCD to a Superdex 200 10/300 GL column are shown in panels A and B, respectively. The dashed lines are the chromatograms recorded by the differential refractometer, and the filled lines are the chromatograms recorded from the intensity of scattered light at 90°. The overlaid points (appearing as thick lines) are individual measurements of the weight-averaged molecular weight determined at 1-s intervals throughout the elution of chromatographic peaks using ASTRA software.
The same measurements were made on SufCD. The data showed a much better oligomeric homogeneity than SufBC. Equilibrium velocity analysis showed a major peak with a sedimentation coefficient of 6.18 s and only a small amount of a species with a sedimentation coefficient of 4.28 s (Fig. 2B). Using the average frictional coefficient of 1.32, the major species had a calculated molecular weight of 122 kDa. Multiangle light scattering showed an almost clean peak with a molecular weight of 117 kDa (Fig. 3B). Sedimentation equilibrium data fitted well when nine data sets were globally fitted to a single species model (data not shown). Using the calculated partial specific volume of the complex of 0.7432 cm3 g−1 and solvent density of 1.00742 g mL−1, a molecular weight of 121 kDa was obtained. The calculated molecular weights for the putative SufCD, SufC2D2, SufCD2, and SufC2D complexes are 71, 142, 113, and 100 kDa, respectively. Although all three different types of hydrodynamic data showed good agreement with a molecular weight of ∼120 kDa, they did not fit well into any of these models. Since the Edman degradation and quantitative SDS gel electrophoresis results showed that the complex contains equimolar amounts of SufC and SufD, we conclude that the complex exists in equilibrium between SufCD and SufC2D2. The decreasing apparent molecular weight on the trailing edge of the main peak of the light-scattering experiment is consistent with this interpretation (Fig. 3B). To investigate further, a solution of 140 μM SufCD was loaded onto an analytical gel filtration column and the elution profile monitored at 280 nm. Then successive fivefold dilutions were made of the SufCD, and gel filtration was repeated, the eluant being monitored at 230 nm at the lower concentrations to maintain a good signal to noise ratio. The complex eluted at increasing retention times with decreasing concentration, consistent with the equilibrium model. This equilibrium must be rapid on the timescale of our experiments.
Interaction of SufBC and SufCD with mant-nucleotides
The interaction of SufBC and SufCD with mant-nucleotides was investigated by kinetic methods. Although the hydrodynamic measurements described above showed that the complexes exist in solution as tetrameric species, for simplicity, the concentrations given are those calculated as if they were heterodimeric species. This is not important because in the single turnover experiments the concentration of the complexes is in excess of mantATP and so is saturating. The binding experiments were carried out with excess nucleotide under pseudo-first-order conditions, and so the rate constants are only dependent on nucleotide concentration.
Single turnover experiments of SufBC and SufCD with mantATP
Single turnover experiments were made in which 1 μM mantATP was mixed with 10 μM SufBC or SufCD in a stopped-flow instrument with excitation at 366 nm (Fig. 4). Data were collected in the “T” format and converted into total intensity and anisotropy. With SufBC, there was an increase in intensity of ∼80% over 2 s, which was accompanied by an increase in anisotropy from 0.06 to 0.23. This was followed by a decrease in intensity to ∼60% of the initial value and a decrease in anisotropy to 0.22 over the next 30 s. With SufCD, there was an initial increase in intensity, but only of ∼30%, and this was also accompanied by an increase in anisotropy from 0.06 to 0.20. Both intensity and anisotropy remained approximately constant over the next 100 s although there was possibly a very small exponential increase in intensity.
Figure 4.

Single turnover of mantATP by SufBC and SufCD. Stopped-flow fluorescence records from mixing 10 μM SufBC or SufCD with 1 μM mantATP. Excitation was at 366 nm. (A,B) Intensity data over two different timescales. (C,D) Anisotropy data.
The same reaction was then performed in a steady state fluorimeter and followed for 2 h (data not shown). Adding SufBC to mantATP resulted in an immediate increase in anisotropy to 0.24, corresponding to the processes seen in the stopped-flow experiment. The anisotropy then remained constant. The same occurred with SufCD except the increase in anisotropy was to 0.21. These results are in contrast with a similar experiment with SufC alone when, following the rapid increase in anisotropy, there is a slow increase in anisotropy corresponding to the cleavage of mantATP (Eccleston et al. 2006).
The same reactions were repeated, and timed samples were quenched with acid, neutralized, and analyzed for the relative amounts of mantATP and mantADP (Fig. 5). With SufCD, there was an exponential decrease in the percentage of mantATP that could be fitted with a rate constant of 2.2 × 10⁻³ s−1. With SufBC, all of the mantATP had been hydrolyzed to mantADP by the time of the first time point (30 s). The reaction was therefore carried out in a quenched-flow instrument operated in the pulsed mode (Fig. 5B). It can be seen that there is an exponential loss of mantATP that could be fitted to a rate constant of 0.088 s−1. This corresponds to the slow decrease in intensity and anisotropy seen in the fluorescence data (Fig. 4). Since the rate constant of this process for SufC alone is 4.8 × 10⁻⁴ s−1, complex formation has accelerated this rate constant by 180- and fivefold for SufBC and SufCD, respectively.
Figure 5.

Cleavage of mantATP by SufC, SufBC, and SufCD. Concentrations are the same as in Figure 4. (A) SufC alone (open circles) and SufCD (filled circles) with data obtained by manual quenching. (B) SufBC with data obtained using a quenched-flow instrument. The percentage of mantATP remaining is plotted against time.
Interaction of SufBC and SufCD with excess mantATP
Previously, we studied the kinetics of mantATP binding to SufC alone under pseudo-first-order conditions with excess SufC over mantATP and excited the mant-fluorophore directly. If we had used excess mantATP, we would not have been able to cover a sufficiently large concentration range. However, the presence of tryptophan residues in both SufB and SufD (unlike in SufC) allows measurements to be made by exciting the mant-fluorophore via resonance energy transfer by exciting at 280 nm and using excess mantATP over the SufBC or SufCD complexes.
When 1 μM SufBC or SufCD was mixed with 10–50 μM mantATP, an apparently exponential increase in fluorescence intensity occurred (Fig. 6). However, the data showed some deviation from a single exponential fit. In the case of SufBC, the data were fitted to a single exponential plus a positive slope to take into account a small slow process following the initial process (see below). In the case of SufCD, the 10-μM and 20-μM data were fitted to a double exponential but the 30–50-μM data were well fitted to a single exponential. Observed rate constants obtained in this way were plotted against mantATP concentration. With both complexes, there was a linear relationship between k obs and mantATP concentration. This is consistent with this process being a second-order binding process. Under the pseudo-first-order conditions used here, the observed rate constant is given by
Figure 6.

Interaction of excess mantATP with SufBC. Stopped-flow fluorescence record when 1 μM SufBC or SufCD was mixed with 10 μM mantATP.
where k 1 is the association rate constant and k −1 is the dissociation rate constant. Therefore, a plot of k obs against mantATP concentration has a slope giving the association rate constant and an intercept giving the dissociation rate constant. The second-order binding rate constants for SufBC and SufCD were 5.5 × 10⁵ M−1 s−1 and 4.6 × 10⁵ M−1 s−1, respectively. These are an order of magnitude faster than the rate constant for mantATP binding to SufC alone. Also, the intercepts were indistinguishable from zero, so a measurement of the dissociation rate constant could not be determined, unlike with SufC alone, with a dissociation rate constant of 3.8 s−1. However, the dissociation rate constants for the complexes are slower than this. Both the increased association rate constants and slower dissociation rate constants of the complexes result in the much tighter binding to them of mantATP than to SufC alone.
As mentioned above, following the second-order process, a smaller increase in intensity occurred that was difficult to determine on the timescale of these experiments. Because of their small amplitudes, it was difficult to determine the absolute values and whether or not they are dependent on concentration. The second step is ascribed to a conformational change of the SufBC.mantATP complex analogous to the one seen with SufC alone, which was accompanied by a larger signal and more easily defined. With SufCD, a small increase in intensity also occurred that was difficult to define in terms of amplitude and rate constant.
Interaction of SufBC and SufCD with mantADP
The kinetics of SufBC and SufCD binding to excess mantADP were studied under the same conditions as described above with mantATP. Again a rapid exponential increase in intensity occurred (Fig. 7A). This was followed by a second exponential process, but unlike with mantATP, it was well resolved from the first process both in rate constant and also in amplitude. Plotting k obs of the fast phase gave a linear relationship with the slope giving second-order rate constants for SufBC and SufCD of 9.1 × 10⁵ M−1 s−1 and 6.9 × 10⁵ M−1 s−1, respectively. Again the intercept was indistinguishable from zero. The rate constants of the second phase were ∼0.25 s−1 for both complexes and were independent of mantADP concentration over the range 10–50 μM.
Figure 7.

ADP with interaction of mantSufBC and SufCD. (A) Stopped-flow fluorescence records on mixing solutions of 1 μM SufBC or SufCD with 10 μM mantADP. (B) Stopped-flow fluorescence records of mixing 5 μM SufBC or SufCD and 2.5 μM mantADP with a solution of 1 mM ADP.
The dissociation rate constant of mantADP from SufBC and SufCD could be obtained in principle from the intercept of the second-order plot, but this was too close to zero to be meaningful. Therefore, the dissociation rate constant was measured by mixing a solution of 5 μM SufBC or SufCD and 2.5 μM mantADP with a solution of 1 mM ADP (Fig. 7B). With both complexes, a decrease in fluorescence intensity occurred that was well fitted by a single exponential giving a rate constant of 0.038 s−1 for SufBC and 0.045 s−1 for SufCD. The fluorescence anisotropy at the end of the reaction showed that all of the mantADP had been displaced.
From the association and dissociation rate constants, a value for the equilibrium dissociation constants was calculated from the relationship Kd = k off/k on. For SufBC, this was 50 nM, and for SufCD it was 58 nM. This compares with a Kd of SufC alone of 2 μM. As with mantATP, mantADP binds much tighter to the complexes than to SufC alone.
Intrinsic fluorescence changes of SufBC and SufCD on interaction with ATP and ADP
SufC contains no tryptophan residues, but SufB and SufD contain seven and five tryptophan residues, respectively. This opened the possibility of using tryptophan fluorescence to explore the binding of ATP and ADP to the complexes without resorting to the use of fluorescent nucleotide analogs by exciting the tryptophan fluorescence at 280 nm and observing emission through a 320 nm cutoff filter.
Solutions of 1 μM SufBC were mixed with 10 μM to 1 mM ATP. A very small exponential decrease in fluorescence occurred (Fig. 8A). Over the range of 10–40 μM ATP, the rate constant of this process was linearly dependent on ATP concentration, with an association rate constant of 1.3 × 10⁵ M−1 s−1 and an intercept indistinguishable from zero. When these experiments were repeated with ADP, there was again a small exponential decrease in fluorescence, and the second-order plot gave an association rate constant of 2.7 × 10⁵ M−1 s−1. These data show that the signal arises from the binding of ATP and ADP to SufBC, and the association rate constants are comparable to those obtained with the mant-nucleotides.
Figure 8.

Intrinsic protein fluorescence on ATP binding to SufBC or SufCD. Stopped-flow fluorescence records of mixing 1 μM (A) SufBC and (B) SufCD with 10 μM ATP. Excitation was at 280 nm and emitted light was viewed through a WG 320 cutoff filter.
Identical measurements were made with SufCD, but completely different results were obtained (Fig. 8B). With both ATP and ADP, there was an exponential increase in fluorescence with an amplitude of 8% and a rate constant of 0.2 s−1. The amplitude and rate constant were identical for ATP and ADP and independent of concentration of nucleotide from 10 μM to 1 mM.
Discussion
Evidence that SufC occurs naturally in a complex of SufBCD was found after overexpression of the entire operon in E. coli (Outten et al. 2003). We have compared the hydrodynamic and kinetic properties of SufBC and SufCD complexes with those of SufC alone and hence how SufB or SufD contribute individually to activation of SufC. Previously (Eccleston et al. 2006), we showed that SufC is a monomeric species in solution. The principle feature of its ATPase mechanism (using mantATP) is that following a very weak second-order binding of ATP, a conformational change occurs, followed by cleavage of the bound ATP to ADP and Pi, the latter being released. Under our conditions, the ADP remained bound to the SufC. We now show that formation of SufBC and SufCD affects these properties with significant differences.
Hydrodynamic assessment of our complexes showed that SufBC exists in solution as a tetrameric species comprising two molecules of SufB and two molecules of SufC, i.e., SufB2C2, whereas with SufCD, the situation is more complex. We interpret our data to indicate a mixture in equilibrium between SufCD and SufC2D2, a conclusion supported by the decreasing molecular weight on the trailing edge of the multiangle light-scattering experiment where some SufCD would exist (Fig. 3B). This contrasts with the results of the same experiment with SufBC where the molecular weight remains constant across the peak (Fig. 3A). The increasing retention times on analytical gel filtration of serial dilutions also supports a tetramer–dimer model. The recently solved structure shows that SufCD is a crystallographic tetramer comprising two molecules each of SufC and SufD (K. Fukuyama, pers. comm.). Outten et al. (2003) isolated a complex of SufBCD from E. coli but did not determine its stoichiometry. We speculate that our engineered complexes, SufB2C2 and SufC2D2, are likely counterparts of the natural complex SufBC2D. The suggestion by Badger et al. (2005) that SufB and SufD might form a heterodimer based on their dimeric structure for SufD fits with this proposal.
A major finding of our kinetic experiments with SufBC and SufCD is that the initial binding of mantATP was much tighter to both complexes than to SufC alone. This resulted from a faster association rate constant and slower dissociation constant. The association rate constants for both complexes were identical within experimental error. With both complexes, following this binding step, a further small increase of fluorescence occurred that was difficult to quantify but that we ascribe to a conformational change that was more clearly defined with SufC alone. This was followed by the cleavage step—the rate constant was 180-fold faster for SufBC but only fivefold faster for SufCD, compared to SufC alone.
Binding of mantADP to both complexes again resulted in almost identical association rate constants, faster than with SufC alone. The binding step was followed by a well-defined further increase in fluorescence, with a rate constant independent of ADP concentration and that again we ascribe to a conformational change.
The results of the experiments with ATP and ADP and monitoring intrinsic tryptophan fluorescence were surprising since they obviously report on different steps of the ATPase mechanism with SufBC and SufCD. With SufBC, the rate constants are concentration dependent with both ATP and ADP and so report the binding step. The association rate constants are similar to those with mantATP and mantADP, showing that the presence of the mant group has not perturbed this process. With SufCD, the rate constant is independent of ATP or ADP concentration and so describes a first order step that we ascribe to a conformational change following the binding step, which is spectroscopically silent. This is consistent with the results with mantATP and mantADP, although with mantATP this process was ill defined.
In summary, the kinetic results show that for both complexes the binding of mantATP and mantADP is a second-order process, with similar association rate constants, and this is followed by a conformational change. The major difference between the complexes is that the subsequent cleavage step is accelerated much more in SufBC than SufCD compared to SufC alone. Possible reasons for this are described below.
The role of the ATPase of the Suf system remains unclear despite genetic studies showing that SufC can be essential (Nachin et al. 2003; Xu and Moller 2004). Outten et al. (2003) showed that AMPPNP had no effect on the activation SufES, but we have previously shown that mantAMPPNP binds to SufC very weakly (Eccleston et al. 2006). The effect of ATP on the Suf system in E. coli was not studied by Outten et al. (2003). Also, in work describing formation of [Fe-S] clusters on SufB, the effect of ATP on the process was not investigated (Layer et al. 2007).
The only available structure of a SufC.ADP complex showed that the glutamate residue of the Walker B motif is flipped away from the nucleotide-binding site (Watanabe et al. 2005), and so results in the low rate of the cleavage step unlike many nucleotide-bound structures, in some of which this glutamate residue interacts with a putative catalytic water molecule. In the recently solved structure of the SufCD complex, this glutamate points toward the ATP binding site (K. Fukuyama, pers. comm.). It could be that this movement is a part of the conformational change for which we have provided kinetic evidence, although why the acceleration of the cleavage step is much greater in SufBC compared to SufCD remains unknown in the absence of a SufBC structure.
Phylogenetic analysis of approximately 100 primary sequences of SufB and SufD (S. Sato, pers. comm.) showed that SufB is highly conserved (in two closely evolved forms), whereas SufD is not well conserved, though its secondary structure is likely to be. Conservation of the primary sequence of SufB suggests its molecular interactions have more rigorous requirements than SufD. Moreover, in E. coli only SufB carries a Fe-S cluster and only the SufBC complex interacts with SufE. However, the proposal (Layer et al. 2007) that the role of SufE in E. coli is to link SufS with SufBC cannot apply to T. maritima, where SufE is absent, unless SufU is its functional homolog. Indeed analysis of bacterial genomes suggests that subsets of the most complete suf operons are common. Speciation may have tailored the multifunctions of Suf proteins into discrete systems whose individual modus operandi will have to rely on individual investigations.
We have been interested to explain the continued presence of the Suf system in eukaryotic apicomplexan pathogens like Plasmodium, Toxoplasma, and Theileria. These parasites carry a relict non-photosynthetic plastid whose function is not fully understood, though biosynthetic pathways for fatty acid (FAS II), isoprenoid (DOXP), haem, tRNAs, and protein synthesis have been identified (Wilson et al. 1996; Waller et al. 1998; Jomaa et al. 1999; Sato and Wilson 2002). Some of the parasite plastid genomes encode SufB (Ycf24) (Ellis et al. 2001) as well as the other suf genes that persist as nuclear copies whose products are imported into the organelle (B. Clough, K.E.S. Ellis, K. Rangachari, S. Thakrar, S. Sato, and R.J.M. Wilson, in prep.). By contrast, the Suf pathway of Th. parva comprises only SufS and a putative SufE-fusion protein (Gardner 2005). In this case the Suf proteins might be dedicated to the formation of thio-tRNAs; indeed, it has been proposed that the raison d'etre for maintenance of relict plastids in non-photosynthetic plants and algae in general is for the generation of organellar tRNAs (Barbrook et al. 2006). By contrast, for parasites such as Plasmodium and Toxoplasma that carry the entire Suf system, we proposed (Wilson et al. 2003) that Suf functions in the plastid to assemble Fe-S clusters for imported apoproteins such as ferredoxin, lipoate synthase, and the isoprenoid biosynthesis enzymes LytB and GcpE. Recently, it was found that isoprenoids generated in the plastid are modified for the production of abscisic acid, an important signaling molecule implicated in the invasive life style of Toxoplasma (Nagamune et al. 2008). At present it is difficult to confirm directly any of these functions of Suf in apicomplexan plastids, as they have not been separated from mitochondria in subcellular fractions. Nevertheless, the absence of Suf proteins from humans and the ability of inhibitors of plastid housekeeping functions, e.g., doxycycline (Dahl et al. 2006), to kill these parasites suggests that the Suf system may provide a target for inhibitors in some major pathogens. To this end we are expressing the Suf proteins of M. tuberculosis for detailed examination and screening purposes.
Materials and Methods
Cloning, expression, and purification of Suf BCD complex constructs
All constructs for SufC, SufB, and SufD proteins of T. maritima were generated by PCR (introducing NdeI and BamHI sites at the 5′ and 3′ ends, respectively) using T. maritima genomic DNA (ATCC 435890) as the template. Full-length SufC polypeptide was C-terminally tagged with poly-histidine while full-length SufB and SufD proteins were not tagged.
The PCR products were ligated into the pCR-Blunt cloning vector (Invitrogen). Silent mutations were then introduced using the QuikChange Site-Directed Mutagenesis Kit (Stratagene) to remove internal restriction sites within the sufB, -C, and -D sequences (see Supplemental material). All constructs were verified by DNA sequencing (Lark Technologies). Subsequently, sufB, -C, and -D genes were excised from the pCR-Blunt cloning vector and ligated into pET3aTr (Tan et al. 2005). The genes were then subcloned into the pST39 polycistronic expression vector (Tan et al. 2005). Several combinations of vectors were generated, including pST39-sufC-sufD and pST39-sufC-sufB (see Supplemental material). Other combinations were shown to be unsuccessful.
The recombinant plasmids were transformed into E. coli strain BL21(DE3)pLysS (Invitrogen). Bacterial colonies were grown in Luria-Bertani broth with ampicillin and chloramphenicol to maintain the pST39 and pLysS plasmids, respectively. SufC and SufD coexpression were induced with 1 mM IPTG at 37°C and an OD600nm between 0.5 and 0.7. Expression was continued for 3 h at the same temperature. SufC and SufB coexpression were induced with 0.2 mM IPTG at 18°C and an OD600nm between 0.5 and 0.7. Expression was continued for ∼12–18 h at the same temperature.
Protein purification
Similar purification strategies were applied to the different combinations of the SufC, -B, and -D polypeptides utilizing the poly-histidine tag on SufC.
Bacteria were harvested from 4-L cultures by centrifugation at 3300g and the cell pellets resuspended in 50 mL buffer A (20 mM Tris-HCl, pH 8.0, 300 mM NaCl, 10 mM imidazole, 1 mM dithiothreitol, 5% [v/v] glycerol with two tablets of protease inhibitor cocktail—Complete, EDTA free [Roche]). After sonication and ultracentrifugation at 3000g for 30 min at 4°C, the cleared 50-mL bacterial lysate was loaded onto a 12-mL Ni-NTA Superflow column (Qiagen) equilibrated in buffer A, at a rate of 1 mL min−1. The column was washed with buffer A until the absorption at 280 nm reached baseline. Bound proteins were then eluted stepwise with 25 mM, 125 mM, and 500 mM imidazole in buffer A and the protein peaks collected. The eluted complexes were resolved by NuPAGE 12% Bis-Tris SDS-PAGE.
When SufC and SufD were coexpressed, both fractions eluting at 125 mM (the major peak) and 500 mM imidazole contained SufC and SufD. However, analytical size-exclusion experiments (Superdex 10/300 GL, 24-mL bed volume, 100-μL injection, 0.4 mL min−1 at room temperature) showed that the fractions eluted with 500 mM imidazole contained soluble aggregates eluting in the void volume. Therefore, only the fraction eluting at 125 mM imidazole was used for subsequent purification.
The protein solution (30–50 mL) was dialyzed overnight against 20 mM Tris-HCl, pH 8, 300 mM NaCl, and 1 mM DTT and concentrated to <5 mL (Vivaspin 5 kDa or 10 kDa cutoff).
The final step of purification was size-exclusion chromatography on a Superdex 200 column (HiLoad 26/60 Superdex 200, bed volume 320 mL) equilibrated in 20 mM Tris-HCl, pH 8, 300 mM NaCl, and 1 mM dithiothreitol. The column was loaded with 2 mL of the protein solution and the complexes eluted under isocratic conditions at a flow rate of 1 mL min−1 (all steps were performed at room temperature). Three major peaks eluted: The first was at the void volume of the column, the second contained both SufC and SufD shown by SDS gel electrophoresis, and the third contained only SufC. Both the SufCD complex and the SufC were dialyzed against 50 mM Tris-HCl, pH 7.5, 100 mM KCl, 5 mM MgCl2, and 1 mM dithiothreitol. Sample purity was estimated by NuPAGE 12% Bis-Tris SDS-PAGE, and the gels were stained with Coomassie Blue. For SufCD, purity was estimated by eye to be >95%, with a yield of ∼100 mg L−1 of culture.
When SufB and SufC were coexpressed, the complex was purified in exactly the same way as the SufCD complex and a similar purity obtained. The yield for SufBC was ∼60 mg L−1 of culture.
Concentrations of proteins were determined from their absorption at 280 nm using extinction coefficients of 75,875 M−1cm−1and 52,830 M−1cm−1 for SufBC and SufCD, respectively (ProtParam at www.expasy.ch), assuming a 1:1 stoichiometry.
Hydrodynamic measurements
Analytical ultracentrifuge equilibrium measurements were conducted with a Beckman Optima XL-A analytical ultracentrifuge (Beckman Coulter) equipped with absorbance optics using six sector cells. Three different concentrations of protein were used and allowed to come to equilibrium at 10,000, 12,000, and 15,000 rpm. All nine resulting data sets were globally fitted to a single species model using Beckman/Origin software. Sedimentation velocity measurements were made with the same instrument but using two sector cells. Solutions were centrifuged at 40,000 rpm and 200 scans at 280 nm were made at 5-min intervals. The data were analyzed as a distribution of sedimentation coefficients using Sedfit (Schuck 2000).
The solution molecular weights of SufBC and SufCD were determined using on line multiangle laser light scattering coupled with size exclusion chromatography (SEC-MALLS). Samples of the complexes (300 μg in 100 μL) were applied to a Superdex 200 10/300 GL column equilibrated in 20 mM Tris-HCl, 150 mM NaCl, and 1 mM TCEP at a flow rate of 0.5 mL/min. The column was mounted on a Jasco HPLC controlled by the Chrompass software package. The scattered light intensity of the column eluant was recorded at 16 angles using a DAWN-HELEOS multiangle laser light-scattering detector (Wyatt Technology Corp.). The protein concentration of the eluant was determined from the refractive index change (dn/dc = 0.186) using an OPTILAB-rEX differential refractometer equipped with a Peltier temperature-regulated flow cell, maintained at 25°C (Wyatt Technology Corp.). The wavelength of the laser in the DAWN-HELEOS and the light source in the OPTILAB-rEX were both 658 nm. The weight-averaged molecular weight of material contained in chromatographic peaks was determined using the ASTRA software version 5.1 (Wyatt Technology Corp.). Briefly, at 1-s intervals throughout the elution of chromatographic peaks the scattered light intensities, together with the corresponding protein concentration, were used to construct Debye plots (KC/R θ vs. sin2[θ/2]). The weight-averaged molecular weight was then calculated at each point in the chromatogram from the intercept of an individual plot. An overall average molecular weight was calculated by combining and averaging the data from the individual measurements.
Fluorescence measurements
Mant-nucleotides were synthesized, purified, and analyzed as described previously (Jameson and Eccleston 1997).
Rapid fluorescence measurements were made with a Hi-Tech-Scientific SF-61 DX2 stopped-flow instrument (TgK Scientific). Excitation was through a monochromator at 366 nm when the mant-fluorophore was directly excited or at 280 nm where the mant-fluorophore was excited by resonance energy transfer via tryptophan fluorophores. In both cases, emission was viewed through a Schott KV 399 cutoff filter. Intensity measurements were made with an “L” format whereas anisotropy measurements were made in the “T” format. In the latter case, the excitation light was polarized, and light emitted parallel and perpendicular to the plane of excitation was measured simultaneously. The data were converted to total intensity by the relationship I = I II + 2I ⊥ and to anisotropy by the relationship A = (I II − I ⊥)/(I II + 2I ⊥). Data were analyzed using Hi-Tech software. Slow time course measurements were made using an ISS PC1 fluorimeter with the same optical settings as the stopped-flow measurements. Data were analyzed using Grafit. For slow (>1 min) measurements of the time course of the cleavage of mantATP, 40-μL aliquots were taken at timed intervals and the reaction quenched by adding to 2.5 μL 10% perchloric acid and then neutralized by the addition of 1.75 μL 4 M potassium acetate. After removing denatured protein by centrifugation, samples were analyzed for the relative concentrations of mantATP and mantADP using HPLC monitoring mant fluorescence (Jameson and Eccleston 1997). For faster measurements, a Hi-Tech RGF-63 quenched-flow instrument (TgK Scientific) was used. For the stopped-flow and quenched-flow measurements, concentrations quoted are those after mixing and are therefore half of those in the syringes.
All hydrodynamic and kinetic measurements were made in a solution containing 50 mM Tris-HCl, pH 7.5, 100 mM KCl, 5 mM MgCl2, and 1 mM dithiothreitol at 20°C.
Electronic supplemental material
The Supplemental material consists of Table 1 (indicating primers for coexpression studies) and Figure 1 (a schematic showing constructs for polycistronic expression).
Acknowledgments
We thank Dr. Song Tan (Penn State) for providing the pET3aTr and pST39 expression vectors, Dr. Will Mawby (University of Bristol, UK) for making the Edman degradation measurements, and Dr. Ian Taylor (N.I.M.R.) for help with the light-scattering measurements and analysis.
Footnotes
Supplemental material: see www.proteinscience.org
Reprint requests to: John F. Eccleston, MRC National Institute for Medical Research, Mill Hill, London NW7 1AA, UK; e-mail: jeccles@nimr.mrc.ac.uk; fax: 44-(0)-20-8906-4489.
Abbreviation: mant-, 2′(3′)-O-(N-methylanthraniloyl)-.
Article and publication are at http://www.proteinscience.org/cgi/doi/10.1110/ps.034652.108.
References
- Badger, J., Sauder, J.M., Adams, J.M., Antonysamy, S., Bain, K., Bergseid, M.G., Buchanan, S.G., Buchanan, M.D., Batiyenko, Y., Christopher, J.A., et al. Structural analysis of a set of proteins resulting from a bacterial genomics project. Proteins. 2005;60:787–796. doi: 10.1002/prot.20541. [DOI] [PubMed] [Google Scholar]
- Barbrook, A.C., Howe, C.J., Purton, S. Why are plastid genomes retained in non-photosynthetic organisms? Trends Plant Sci. 2006;11:101–108. doi: 10.1016/j.tplants.2005.12.004. [DOI] [PubMed] [Google Scholar]
- Dahl, E.L., Shock, J.L., Gut, J.L., Rosenthal, P.J. Tetracyclines specifically target the apicoplast of the malaria parasite. Antimicrob. Agents Chemother. 2006;50:3124–3131. doi: 10.1128/AAC.00394-06. [DOI] [PMC free article] [PubMed] [Google Scholar]
- Eccleston, J.F., Petrovic, A., Davis, C.T., Rangachari, K., Wilson, R.J.M. The kinetic mechanism of the SufC ATPase—the cleavage step is accelerated by SufB. J. Biol. Chem. 2006;281:8371–8378. doi: 10.1074/jbc.M513455200. [DOI] [PubMed] [Google Scholar]
- Ellis, E., Clough, B., Saldanha, J.W., Wilson, R.J.M. Nifs and Sufs in malaria. Mol. Microbiol. 2001;41:973–981. doi: 10.1046/j.1365-2958.2001.02588.x. [DOI] [PubMed] [Google Scholar]
- Gardner, M.J. Genome sequence of Theileria parva, a bovine pathogen that transforms lymphocytes. Science. 2005;309:72–73. doi: 10.1126/science.1110439. [DOI] [PubMed] [Google Scholar]
- Huet, G., Daffe, M., Saves, I. Identification of the Mycobacterium tuberculosis SUF machinery as the exclusive mycobacterial system of [Fe-S] cluster assembly: Evidence for its implication in the pathogen's survival. J. Bacteriol. 2005;187:6137–6146. doi: 10.1128/JB.187.17.6137-6146.2005. [DOI] [PMC free article] [PubMed] [Google Scholar]
- Jameson, D.M., Eccleston, J.F. Fluorescent nucleotide analogs: Synthesis and applications. Methods Enzymol. 1997;278:363–390. doi: 10.1016/s0076-6879(97)78020-0. [DOI] [PubMed] [Google Scholar]
- Johnson, D.C., Dean, D.R., Smith, A.D., Johnson, M.K. Structure, function, and formation of biological iron-sulfur clusters. Annu. Rev. Biochem. 2005;74:247–281. doi: 10.1146/annurev.biochem.74.082803.133518. [DOI] [PubMed] [Google Scholar]
- Jomaa, H., Wiesner, J., Sanderbrand, S., Altincicek, B., Weidemeyer, C., Hintz, M., Türbachova, I., Eberl, M., Zeidler, J., Lichtenthaler, H.K., et al. Inhibitors of the nonmevalonate pathway of isoprenoid biosynthesis as antimalarial drugs. Science. 1999;285:1573–1576. doi: 10.1126/science.285.5433.1573. [DOI] [PubMed] [Google Scholar]
- Kitaoka, S., Wada, K., Hasegawa, Y., Minami, Y., Fukugama, K., Takahashi, Y. Crystal structure of Escherichia coli SufC, an ABC-type ATPase component of the SUF iron-sulfur cluster assembly machinery. FEBS Lett. 2006;580:137–143. doi: 10.1016/j.febslet.2005.11.058. [DOI] [PubMed] [Google Scholar]
- Layer, G., Gaddam, S.A., Ayala-Castro, C.N., Ollagnier de Choudens, S., Lascoux, D., Fontecave, M., Outten, F.W. SufE transfers sulfur from SufS to SufB for iron-sulfur cluster assembly. J. Biol. Chem. 2007;282:13342–13350. doi: 10.1074/jbc.M608555200. [DOI] [PubMed] [Google Scholar]
- Loiseau, L., Ollagnier-de Choudens, S., Lascoux, D., Forest, E., Fontecave, M., Barras, F. Analysis of the heteromeric CsdA-CsdE cysteine desulfurase, assisting Fe-S cluster biogenesis in Escherichia coli . J. Biol. Chem. 2005;280:26760–26769. doi: 10.1074/jbc.M504067200. [DOI] [PubMed] [Google Scholar]
- Mihara, K., Esaki, N. Bacterial cysteine desulfurases: Their function and mechanisms. Appl. Microbiol. Biotechnol. 2002;60:12–23. doi: 10.1007/s00253-002-1107-4. [DOI] [PubMed] [Google Scholar]
- Nachin, L., Loiseau, L., Expert, D., Barras, F. SufC: An unorthodox cytoplasmic ABC/ATPase required for [Fe-S] biogenesis under oxidative stress. EMBO J. 2003;22:427–437. doi: 10.1093/emboj/cdg061. [DOI] [PMC free article] [PubMed] [Google Scholar]
- Nagamune, K., Hicks, L.M., Fux, B., Brossier, F., Chini, E.N., Sibley, L.D. Abscisic acid controls calcium-dependent egress and development in Toxoplasma gondii . Nature. 2008;451:207–210. doi: 10.1038/nature06478. [DOI] [PMC free article] [PubMed] [Google Scholar]
- Noble, C.G., Walker, P.A., Calder, L.J., Taylor, I.A. Rna14-Rna15 assembly mediates the RNA-binding capability of Saccharomyces cerevisiae cleavage factor IA. Nucleic Acids Res. 2004;32:3364–3375. doi: 10.1093/nar/gkh664. [DOI] [PMC free article] [PubMed] [Google Scholar]
- Outten, F.W., Wood, M.J., Munoz, F.M., Storz, G. The SufE protein and the SufBCD complex enhance SufS cysteine desulfurase activity as part of a sulfur transfer pathway for Fe-S cluster assembly in Escherichia coli . J. Biol. Chem. 2003;278:45713–45719. doi: 10.1074/jbc.M308004200. [DOI] [PubMed] [Google Scholar]
- Outten, F.W., Djaman, O., Storz, G. A suf operon requirement for Fe-S cluster assembly during iron starvation in Escherichia coli . Mol. Microbiol. 2004;52:861–872. doi: 10.1111/j.1365-2958.2004.04025.x. [DOI] [PubMed] [Google Scholar]
- Rangachari, K., Davis, C.T., Eccleston, J.F., Hirst, E.M.A., Saldanha, J.W., Strath, M., Sato, S., Wilson, R.J.M. SufC hydrolyzes ATP and interacts with SufB from Thermotoga maritima . FEBS Lett. 2002;514:225–228. doi: 10.1016/s0014-5793(02)02369-4. [DOI] [PubMed] [Google Scholar]
- Sato, S., Wilson, R.J.M. The genome of Plasmodium falciparum encodes an active delta-aminolevulinic acid dehydratase. Curr. Genet. 2002;40:391–398. doi: 10.1007/s00294-002-0273-3. [DOI] [PubMed] [Google Scholar]
- Schuck, P. Size-distribution analysis of macromolecules by sedimentation velocity ultracentrifugation and Lamm equation modeling. Biophys. J. 2000;78:1606–1619. doi: 10.1016/S0006-3495(00)76713-0. [DOI] [PMC free article] [PubMed] [Google Scholar]
- Tan, S., Kern, R.C., Selleck, W. The pST44 polycistronic expression system for producing protein complexes in Escherichia coli . Protein Expr. Purif. 2005;40:385–395. doi: 10.1016/j.pep.2004.12.002. [DOI] [PubMed] [Google Scholar]
- Takahashi, Y., Tokumoto, U. A third bacterial system for the assembly of iron-sulfur clusters with homologs in Archaea and plastids. J. Biol. Chem. 2002;277:28380–28383. doi: 10.1074/jbc.C200365200. [DOI] [PubMed] [Google Scholar]
- Watanabe, S., Kita, A., Miki, K. Crystal structure of atypical cytoplasmic ABC-ATPase SufC from Thermus thermophilus HB8. J. Mol. Biol. 2005;353:1043–1054. doi: 10.1016/j.jmb.2005.09.017. [DOI] [PubMed] [Google Scholar]
- Waller, R.F., Keeling, P.J., Donald, R.G., Striepen, B., Handman, E., Lang-Unnasch, N., Cowman, A.F., Besra, G.S., Roos, D.S., McFadden, G.I. Nuclear-encoded proteins target to the plastid in Toxoplasma gondii and Plasmodium falciparum . Proc. Natl. Acad. Sci. 1998;95:12352–12357. doi: 10.1073/pnas.95.21.12352. [DOI] [PMC free article] [PubMed] [Google Scholar]
- Wilson, R.J.M., Denny, P.W., Preiser, P.R., Rangachari, K., Roberts, K., Roy, A., Whyte, A., Strath, M., Moore, D.J., Moore, P.W., et al. Complete gene map of the plastid-like DNA of the malaria parasite Plasmodium falciparum . J. Mol. Biol. 1996;261:155–172. doi: 10.1006/jmbi.1996.0449. [DOI] [PubMed] [Google Scholar]
- Wilson, R.J.M., Rangachari, K., Saldanha, J.W., Rickman, L., Buxton, R.S., Eccleston, J.F. Parasite plastids: Maintenance and functions. Philos. Trans. R. Soc. Lond. B Biol. Sci. 2003;358:155–164. doi: 10.1098/rstb.2002.1187. [DOI] [PMC free article] [PubMed] [Google Scholar]
- Xu, X.M., Moller, S.G. AtNAP7 is a plastidic SufC-like ATP-binding cassette/ATPase essential for Arabidopsis embryogenesis. Proc. Natl. Acad. Sci. 2004;101:9143–9148. doi: 10.1073/pnas.0400799101. [DOI] [PMC free article] [PubMed] [Google Scholar]
- Zheng, L., White, R.H., Cash, V.L., Jack, R.F., Dean, D.R. Cysteine desulfurase activity indicates a role for NIFS in metallocluster biosynthesis. Proc. Natl. Acad. Sci. 1993;90:2754–2758. doi: 10.1073/pnas.90.7.2754. [DOI] [PMC free article] [PubMed] [Google Scholar]
- Zheng, L., White, R.H., Cash, V.L., Dean, D.R. Mechanism for the desulfurization of L-cysteine catalyzed by the nifS gene product. Biochemistry. 1994;33:4714–4720. doi: 10.1021/bi00181a031. [DOI] [PubMed] [Google Scholar]