

Abstract
On-line sample preconcentration of oligonucleotides with a new sweeping carrier was developed by using dodecyltrimethylammonium bromide (DTAB) below the critical micelle concentration (CMC). The sweeping results with DTAB below and above the CMC were compared. The use of DTAB below the CMC benefits the preconcentration of the oligonucleotides, while the use of DTAB above the CMC is good for hydrophobic small molecules. The factors affecting the sweeping results were optimized and this method was evaluated by constructing calibration curves for thrombin aptamers. The sweeping scheme produced a 112-fold sensitivity enhancement for the oligonucleotides relative to that run in a running buffer without DTAB. The sweeping method developed here can be a good reinforcement of the preconcentration scheme by sweeping when less-hydrophobic analytes or large negatively-charged molecules need to be preconcentrated.
Keywords: Sweeping, Capillary zone electrophoresis, Sample preconcentration, Thrombin aptamers, Dodecyltrimethylammonium bromide
1. Introduction
Capillary electrophoresis (CE) separation techniques, such as capillary zone electrophoresis (CZE) and micellar electrokinetic chromatography (MEKC), offer a number of advantages including high separation efficiency, rapid analysis times, small sample requirements and low solvent and waste disposal costs. Relative to most CE-based approaches, MEKC offers the potential of separating both charged and neutral species within a single run by employing a pseudostationary phase typically in the form of micelles. However, both MEKC and CZE generally suffer from a 100-fold lower detection sensitivity than HPLC when UV absorbance detection is used [1,2] Although more sensitive optical detection approaches, such as laser-induced fluorescence (LIF) [3,4], improve detection sensitivity, most analytes do not have native fluorescence, and fluorophore labeling of analytes is often required before analysis by LIF [5,6]. Moreover, not all analytes can be modified with a suitable fluorophore [7].
On-line sample preconcentration techniques in CE have been developed and widely used for both CZE and MEKC [8-11]. Among them, field-amplified sample stacking (FASS) and sweeping are common and easy to perform. FASS takes advantage of the discontinuous electric field distribution across a two-buffer system with different conductivities [9]. The charged analytes in the low-conductivity buffer zone are accelerated under an applied voltage and immediately slow down after crossing the conductivity boundary and as a result are concentrated at the conductivity boundary zone. The primary analyte requirement for FASS is a charge; therefore neutral solutes cannot be concentrated by traditional FASS. However, micelle-assisted FASS has been developed to achieve FASS for neutral analytes [12-14]. On the basis of micelle-assisted FASS, Quirino and Terabe have developed an exciting preconcentration method, termed sweeping, which may produce 80- to 5000-fold detection enhancement [15].
Sweeping in MEKC is defined as the picking and accumulating of analytes by a pseudostationary phase (micelles) penetrating into the sample zone under an applied voltage [15]. The fundamental condition used is that the running buffer contains a surfactant at a concentration above the critical micelle concentration (CMC), while the sample solution is devoid of the surfactant. The determining factor for the final magnitude of concentration enhancement is the analyte’s retention factor, which is the ratio of the number of solutes distributed in the micellar phase to that in the aqueous phase. The most commonly used pseudostationary phase is sodium dodecyl sulfate (SDS) [10], which is a good choice for sweeping neutral and cationic analytes. Other kinds of surfactants used for sweeping also have been studied, such as cationic [7,16,17], nonionic [18] and polymeric [19] as well as mixed micelles [20]. From the viewpoint of electrostatic interaction, the ionic micelles favor the analytes with opposite charge, so that cationic surfactants, such as tetradecyltrimethylammonium bromide (TTAB), are selected for sweeping anionic analytes. However, according to the principle of sweeping in MEKC, low-hydrophobicity solutes, such as oligonucleotides, DNAs and RNAs, cannot be satisfactorily concentrated by the usual sweeping scheme. Sweeping by ion-pairing reagents [21] or complexing agents [22] can also be employed, however, the detection enhancement is limited to 10- to 40-fold. Therefore, other complexing reagents are needed.
We report here a new sweeping carrier for the preconcentration of negatively charged solutes with a cationic surfactant, dodecyltrimethylammonium bromide (DTAB), at a concentration below the CMC. As a complexing reagent, DTAB can form aggregates with negatively charged analytes. The sweeping power of DTAB below the CMC was investigated. The optimal conditions were determined, and the concentrating capability was evaluated.
2. Experimental
2.1. Instrumentation
All experiments were performed with a P/ACE MDQ instrument from Beckman Coulter (Fullerton, CA, USA). Electropherograms were obtained in fused silica capillaries of 50 μm I.D. and 375 μm O.D. from Polymicro Technologies (Phoenix, AZ, USA). The total length of the capillary was 61.0 cm and the effective length was 50.3 cm from the inlet to the detection point. LIF detection was used at the wavelengths of 488 nm for excitation and 520 nm for emission. The capillary was thermostatted at 25°C. Conductivities were measured with an ExStik EC400 Conductivity/TDS/Salinity meter manufactured by Extech Instruments (Waltham, MA, USA).
2.2. Chemicals and reagents
DTAB, 5-carboxyfluorescein (5-FAM), acetonitrile, 0.1 M NaOH and 1.0 M NaOH were purchased from Sigma-Aldrich (St. Louis, MO, USA). Fluorescein disodium salt (FL) was from ICN Biomedicals (Aurora, OH, USA). BODIPY 505/515 (4,4-difluoro-1,3,5,7-tetramethyl-4-bora-3a,4a-diaza-s-indacene), used as a neutral marker, was from Molecular Probes (Eugene, OR, USA). Thrombin aptamer (5′-/5Fluor/GGT TGG TGT GGT TGG -3′) was from Integrated DNA Technologies (Coralville, IA, USA). Dibasic sodium phosphate was from Fisher Scientific (Fair Lawn, NJ, USA). Water was purified with a Milli-Q system (Millipore, Bedford, MA, USA). All chemicals and reagents were used without further purification. The stock solutions of DTAB and phosphate buffer (Na2HPO4) were prepared in the purified water at a concentration of 200 mM, respectively. The stock solution of BODIPY 505/515 was prepared in methanol at a concentration of 2.5 mM, and those of FL and 5-FAM were prepared in 30% methanol at concentrations of 1.0 and 0.44 mM, respectively. For sample preparation, the solutes (FL, 5-FAM and thrombin aptamer) were diluted to 1.0 μM with purified water. All the solutions entering the capillary were filtered through 0.44 μm syringe filters purchased from Gelman Laboratory, Pall Corp. (Ann Arbor, MI, USA).
2.3. Procedure
The new capillary was conditioned sequentially for 10 min each at 40 psi with 1.0 M NaOH, water and running buffer. Before performing a new run, the capillary was conditioned sequentially with 0.1 M NaOH, methanol, water and running buffer under a pressure of 40 psi for 2 min. Sample injection was performed under various pressures for 60 s to adjust the injection volume. Samples run under sweeping conditions were dissolved in phosphate buffer devoid of the DTAB and separated using a running buffer containing 20 mM Na2HPO4 (pH 9.0), containing varying concentrations of DTAB and acetonitrile with a reversed-polarity voltage of 25 kV. Samples run under traditional or non-sweeping conditions were injected in 20 mM Na2HPO4 (pH 9.0), under a pressure of 0.2 psi for 5 s and separated using a 20 mM Na2HPO4 (pH 9.0) running buffer with a normal-polarity voltage of 25 kV. The injection lengths were determined by using multiple injections divided by running buffer introduction [16].
3. Results and Discussion
3.1. Principle of DTAB carrying power
The basic concept behind sweeping and separation using a cationic surfactant is shown in Fig. 1. The sample containing the anionic analytes but no cationic surfactant is hydrodynamically injected into the capillary. A reversed-polarity voltage is applied causing the cationic surfactants and the anionic analytes to move in the direction of the cathode and anode, respectively. As the cationic surfactants move through the sample zone, they effectively sweep or collect the anionic analytes into a tight swept zone. The anionic analyte-cationic surfactant complexes are then separated along the capillary and detected. It should also be noted that when a cationic surfactant is added to the running buffer the capillary wall will be dynamically coated by surfactant and at a sufficient surfactant will cause the EOF to reverse. DTAB can produce significant reversed EOF at a concentration above 3 mM and therefore it is necessary to use a reversed-polarity voltage to have the EOF in the direction of the detector.
Fig. 1.

Sweeping and separation process. (1) Sample solution is introduced into the capillary under pressure. (2) Under an applied voltage with reversed polarity, cationic surfactants move to the cathode and anionic analytes to the anode, finally forming a swept zone. (3) Separation and detection. Blank refers to running buffer; sparse dots refer to sample buffer without acetonitrile and DTAB; dense dots refer to analyte-containing solution; and the black blocks are concentrated analyte zones.
There are several possible modes of interaction between the anionic analytes and the cationic surfactant. Surfactant monomers can interact with molecules of opposite charge to form ion-pairs. First order ion-pairs are the strongest, although higher orders of aggregates possibly may form. In the practical discussion of applications, only the first order ion-pairs are generally considered [23-26]. As can be easily understood, first order ion-pairing effects generally cannot reverse the electrophoretic mobilities of charged analytes since the ion-pair would at most approximate a neutral complex. In experiments, however, it was observed that negatively charged analytes, 5-FAM, FL and the thrombin aptamer, in running buffers containing DTAB at concentrations below the CMC have large reversed electrophoretic mobilities (Table 1), which cannot be interpreted by an ion-pair effect alone. Therefore, the observed reversed electrophoretic mobilities for the anionic analytes indicate that the interaction between the anionic analytes and the surfactant is not a simple ion pairing mechanism.
Table 1.
Electroosmotic and effective electrophoretic mobilities in different buffers: 20 mM Na2HPO4 plus additives
| Mobilities (10-4 cm2/Vs) | ||||
|---|---|---|---|---|
| Run buffer Additives | None a | 11% ACN a | 10 mM DTAB b | 10 mM DTAB + 11% CAN b |
| EOF | 5.61 | 4.70 | 3.9 | 4.0 |
| BODIPY 505/515 | 0 | 0 | -2.6 | -1.3 |
| FL | -2.92 | -2.53 | -2.6 | -1.0 |
| Thrombin Aptamer | -3.64 | -2.89 | -2.6 | -2.2 |
| 5-FAM | -3.97 | -3.32 | -2.6 | -0.5 |
Measured with BODIPY as the neutral marker at normal polarity.
Determined with current monitoring method at reversed polarity.
It has been reported that aggregate formation for some surfactants can be induced by oppositely charged polyelectrolytes [27,28]. These aggregates are only formed above a surfactant concentration, called the critical aggregation concentration (CAC) [29,30], which is much lower than the CMC [31]. The cause of aggregate formation is usually attributed to the cooperative binding between surfactants and polyelectrolytes [27,29], depending on hydrophobic and electrostatic interactions. During recent years, polyelectrolyte complexes have been used as novel pseudo-stationary phases in MEKC [32-34]. Sabate et al have studied the electrophoretic properties of DTAB by using Doppler microelectrophoresis [35]. They found that the maximum zeta potentials were obtained at DTAB concentrations below the CMC at different concentrations of KBr, leading to the inference that DTAB aggregates of dimers, trimers, and so on must be present in the DTAB solution below the CMC. DTAB surfactant undergoes a premicellar association of surfactant molecules at a concentration below the CMC, as also observed for some anionic surfactants [36]. The observed reversed electrophoretic mobilities of the anionic analytes (Table 1) could be accounted for by the formation of anionic analyte-DTAB aggregates with the electrophoretic mobility being dictated by the positively charged aggregates.
3.2. Organic additive effect
In initial sweeping experiments a mixture of several negatively charged analytes (FL, 5-FAM and thrombin aptamer) were found to migrate at the same velocities and appear as a single peak when DTAB was present below the CMC as shown in Fig. 2a. Co-elution occurred despite the significant difference of charge and size ratio of the individual molecules, again suggesting that the charged analytes interact with premicellar associated DTAB and the resulting complex’s elution time is dominated by the DTAB aggregates. Organic solvents, such as methanol and acetonitrile, are often added to the running buffer to improve resolution in MEKC. [16,17,37,38] Organic additives can increase the solubility of hydrophobic solutes in the aqueous phase thereby affecting retention factors of the analytes and potentially altering the resolution of the analytes. The counter effect of organic additives is a reduction in electroosmotic flow (EOF) and the electrophoretic mobilities of analytes due to the higher mobile phase viscosity resulting in longer migration times. The effect of acetonitrile as an organic modifier for the DTAB containing running buffer was studied. It was found that 11% (v/v) acetonitrile added to the running buffer resulted in resolution of the three analytes (Fig. 2b); however, the FL and 5-FAM peaks became broadened relative to the peak width obtained in Fig. 2a. Addition of acetonitrile to the running buffer at 0, 5, 15 or 20% (v/v) levels resulted in no resolution of the three analytes, FL, 5-FAM and aptamers, with all reaching the detector at the same time resulting in one sharp peak as shown in Fig. 2a. Therefore, 11% acetonitrile (v/v) was necessary for CE separation, although the final preconcentration enhancement was somewhat deteriorated due to the presence of acetonitrile.
Fig. 2.
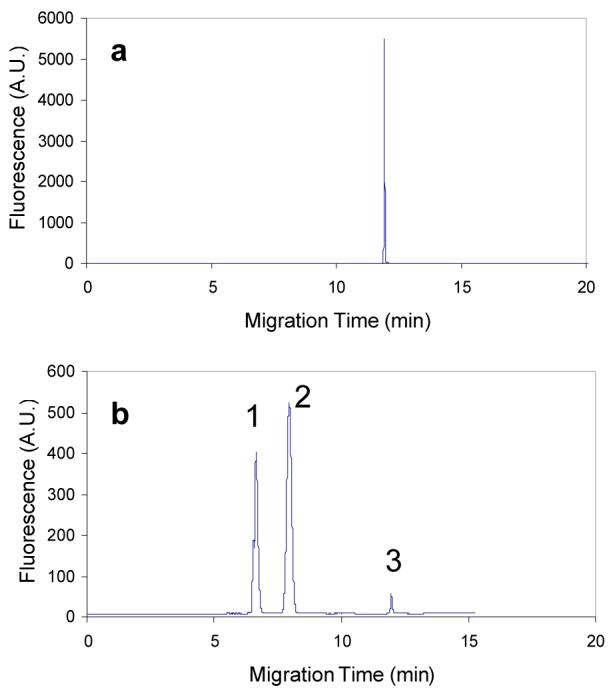
Acetonitrile effect on the separation of 5-FAM, FL and thrombin aptamers at concentrations of 5 nM, respectively. a, running buffer is 20.0 mM Na2HPO4 + 10 mM DTAB; b, running buffer is 20.0 mM Na2HPO4 + 10 mM DTAB + 11% acetonitrile (v/v). Analytes were dissolved in Na2HPO4 buffer. The conductivities of sample solutions were adjusted to be equivalent to that of the corresponding running buffer with Na2HPO4. Injection for both is at 2.0 psi × 60 s. 25 kV at reversed polarity. Peaks 1, 2, and 3 are for 5-FAM, FL and aptamer, respectively.
Under a reversed-polarity voltage, cationic surfactants are moving to the cathode, and anionic analytes to the anode, resulting in the concentration of analytes to the central part of the originally injected sample plug zone and leaving acetonitrile apart from the analyte zone (Fig. 1). Because the concentrated analyte zone does not involve acetonitrile, it will continue migrating as a whole until it penetrates into the running buffer zone containing acetonitrile, and then analytes are separated from each other and detected. If the concentrated analyte zone has not entered the running buffer zone or just enters it for a short time when passing the detection point, the signals will appear as one peak or several peaks with poor resolution. Therefore, care must be taken in selection of the injection and sweeping conditions to insure the concentrated analyte zone penetrates into the running buffer zone containing the acetonitrile.
3.3. DTAB concentration effect
As stated previously, sweeping in MEKC generally employs a surfactant at a concentration far above the CMC [7,15-17]. The effect of varying the DTAB concentration in the running buffer was examined in terms of signal enhancement for 5-FAM, FL and the thrombin aptamer (Fig. 3). The best signal enhancements for 5-FAM and FL were obtained at a DTAB concentration of 20.0 mM, which is above the CMC. However, interestingly, 5-FAM also gave significant signal enhancements well below the CMC (Fig. 3a). For the thrombin aptamer very similar results were obtained at DTAB concentrations below 20 mM although 10 mM DTAB produced relatively higher signal (Fig. 3b). Above 20 mM DTAB, the aptamer appeared as several peaks (Fig. 4b), resulting in lower aptamer signal (Fig. 3b). In addition, the migration times of the three analytes run at DTAB concentrations below and above the CMC were different as shown in Fig. 4. Below the CMC, the analytes migrated in the surfactant condition, regarded as capillary zone electrophoresis (CZE), while above the CMC the analytes are separated by MEKC. The stronger interaction between 5-FAM or FL molecules and the micelles caused longer migration times than those below the CMC and resulted in both eluting after the aptamer. Due to the low hydrophobicity of aptamer molecules the partitioning of aptamer molecules into micelles is relatively weak and as a result the migration time of the aptamer was not strongly affected by the DTAB concentration. However, the higher separation power of MEKC resulted in two peaks for the aptamer indicating either the presence of an impurity or multiple conformations of the aptamer (Fig. 4b). All the following experiments were performed with 10.0 mM DTAB surfactant in the running buffer.
Fig. 3.

Effect of DTAB concentration in running buffer on of peak height. Running buffer is composed of 20.0 mM Na2HPO4, 11% acetonitrile (v/v) and various concentrations of DTAB. Sample solutions were prepared in Na2HPO4 buffer with conductivities adjusted to be similar to those of corresponding running buffers. Injection is at 2.0 psi × 60 s. Series 1, 2 and 3 are for 5-FAM (5.0 nM), FL (5.0 nM) and aptamers (12.5 nM), respectively.
Fig. 4.

Comparison of electropherograms obtained below and above the CMC of DTAB. (a) running buffer is 20.0 mM Na2HPO4 + 11% acetonitrile (v/v) + 10 mM DTAB and (b) running buffer is 20.0 mM Na2HPO4 + 11% acetonitrile (v/v) + 20.0 mM DTAB. Sample solutions were prepared in Na2HPO4 buffer with conductivities adjusted to be similar to those of corresponding running buffers. Injection is at 2.0 psi × 60 s. Peaks 1, 2, and 3 are for 5-FAM (5.0 nM), FL (5.0 nM) and aptamers (12.5 nM), respectively.
3.4. Conductivity ratio effect
Several reports have discussed the conductivity ratio effect during sweeping with micelles [39,40]. The general view about a high-conductivity matrix of sample solution is that the micelles are stacked at the interface boundary of the sample and running buffer zones as the micelles penetrate the leading side of the sample zone. As a result, the invading micelles have a higher concentration than in an equal- or low-conductivity sample matrix, leading to higher sweeping results. However, Quirino et al [39] investigated high-salt-containing matrices for sweeping and found that the stacking effect of micelles on the invading side of the sample zone and the destacking effect on the other side counteract each other. Consequently, the focusing effect of sweeping using a high-conductivity sample matrix is negligible.
The effect of the conductivity ratio was investigated under our sweeping conditions in terms of analyte peak height (Fig. 5). The best enhancement was obtained at a sample matrix concentration of 40.0 mM Na2HPO4 which gives a conductivity ratio of 1.7. The conductivity ratio had only a moderate effect on 5-FAM, the peak height increasing by only two-fold from the worst to the best condition. However, the conductivity ratio had a dramatic impact on the enhancement observed for the thrombin aptamer with over a 100-fold difference between the worst to the best condition. The CMC of DTAB at the conditions used (20.0 mM Na2HPO4, pH 9.0) is 12.7 mM determined by conductivity, which is consistent with the reported value at a similar condition [26]. It is possible the stacking effect of the DTAB molecules at the sample matrix interface generates a local DTAB concentration above the CMC and results in improved sweeping of the aptamer. During the following separation step the DTAB in the concentrated zone would fall below the CMC and the aptamer would be trapped as a complex with DTAB aggregates and would continue to migrate to the detector. In order to study the sweeping effect of DTAB below the CMC, the equal-conductivity matrix was used for the following experiments.
Fig. 5.

Conductivity ratio effect for detection enhancement in terms of peak height. The dotted bars are for 5-FAM (5.0 nM), the lined bars are for FL (5.0 nM), and the blank series are for aptamers (12.5 nM) shown with 10-fold amplification of the real peak height.
3.5. Injection length effect
The sample preconcentration involves accumulating analytes originally distributed in a large volume of solution into a narrow zone so injection of a large volume of sample solution is the basis for sweeping enhancement. The maximum volume introduced into the capillary is limited by the capillary length since a sufficient length of the capillary needs to be left free of sample solution for the following separation after sweeping. In our case, there is another limitation, which is the dynamic coating process of the cationic surfactants onto the negatively charged capillary wall. The running buffer contains surfactant, while the sample solution is devoid of surfactant. When the sample solution is introduced into the capillary, the original DTAB coating on the capillary wall is destroyed by the desorption process of surfactant into the sample buffer. Therefore, the magnitude of the local EOF is lower than that of the remaining part of the capillary that is occupied by running buffer containing DTAB. As a result, the bulk EOF decreases, resulting in longer migration times when a long sample zone is introduced. The optimal injection length needs to be a compromise between the detection enhancement and the time required for analyte elution. Various injection volume lengths were examined by injecting for 60 s at pressures ranging from 2 to 4 psi (Fig. 6). Under 4.0 psi for 60 s, the migration time of the aptamer reached about 27 min with just a small increase of the aptamer peak height relative to the injections performed at lower pressure. The optimal pressure was between 2.5 to 3.0 psi for 60 s, which can fill the capillary at a length of 10 to 13 cm. The following experiments were performed with injection at 2.5 psi for 60 s unless otherwise stated.
Fig. 6.

Injection length effect in terms of injection pressure. Running conditions are the same as those in Fig. 5a except with various injection pressures. Peaks 1, 2 and 3 are 5-FAM (5.0 nM), FL (5.0 nM) and thrombin aptamers (15 nM), respectively.
3.6. Sweeping enhancement and calibration curves
The detection enhancement obtained by sweeping relative to conventional injection was studied for 5-FAM and thrombin aptamer, and electropherograms are shown in Fig. 7. For the sweeping studies a sample containing 5 nM 5-FAM and 10 nM thrombin in Na2HPO4 buffer, adjusted to have the same conductivity as the running buffer, was injected in triplicate under 2.5 psi for 60 s. The running buffer was 20.0 mM Na2HPO4, 10 mM DTAB containing 11% acetonitrile (v/v) and the separation was done under reversed-polarity conditions at 25 kV. For the standard, non-sweeping study a sample containing 500 nM 5-FAM and 1000 nM thrombin aptamer in Na2HPO4 buffer, adjusted to have the same conductivity as the running buffer, was injected in triplicate under 0.2 psi for 5 s injection. The running buffer was 20.0 mM Na2HPO4, containing 11% acetonitrile (v/v) and the separation was done under normal polarity conditions at 25 kV. The detection enhancement was obtained as the ratio of the peak heights obtained by each injection multiplied by the sample dilution factor. Detection enhancements for 5-FAM and the thrombin aptamer were 56- and 112-fold, respectively. Additionally, the linearity of the DTAB sweeping approach was examined by constructing a calibration curve for the thrombin aptamer using 5-FAM as an internal standard and plotting the peak height ratio versus aptamer concentration over the range from 1 to 10 nM (n = 5). The regression equation was y = 0.6625x - 0.0316 with a correlation coefficient of 0.9985 (R2) The percent RSD is below 4% for the four points except at the point of 10 nM with the %RSD of 11%.
Fig. 7.

Electropherograms under sweeping and normal injection conditions. (a) Obtained under sweeping conditions for 5-FAM 5.0 nM and aptamers 10.0 nM in the phosphate buffer, injection 2.5 psi for 60 s; (b) Obtained under normal injections for 5-FAM 500.0 nM and Aptamers 1000.0 nM in the running buffer, injection under 0.2 psi for 5 s. Peaks 1 and 2 are for 5-FAM and aptamers, respectively. See the text for more details.
4. Conclusions
Aggregates of DTAB below the CMC are formed and can be used as sweeping carriers. As new sweeping reagents, DTAB aggregates below the CMC are good for low-hydrophobic molecules, such as oligonucleotides, DNAs and RNAs, which are not as suitable for separation by MEKC. Without acetonitrile added into the running buffer, all the analytes associated with DTAB aggregates migrate at the same velocities and appear as a single sharp peak. Acetonitrile as a running buffer additive can affect the interactions between DTAB aggregates and analytes, especially for FL and 5-FAM. It seems that the presence of acetonitrile in the running buffer has little effect on the interaction between aggregates and aptamers, which abound with negative charges. It is important to carefully optimize the conductivity ratio when employing the approach for highly charged, high molecular materials such as aptamers since the signal enhancement was critically dependent on this variable. The sweeping method developed here offers a preconcentration scheme by sweeping when less-hydrophobic analytes or large negatively-charged molecules are detected by optical methods.
5. Acknowledgements
Thanks to Professor Apryll Stalcup (Department of Chemistry, University of Cincinnati) for a discussion about some surfactant issues. We appreciate P&G Health Care Research Center for the permission to access the CE instrument. Thanks to Jian Dai (P&G Health Care Research Center) for assistance in the operation of the CE instrument. This project was supported by National Institute of Health (NIH, GM 69547).
References
- [1].Sun S-W, Tseng H-M. J. Pharm. Biomed. 2005;37:39. doi: 10.1016/j.jpba.2004.09.042. [DOI] [PubMed] [Google Scholar]
- [2].Albin M, Grossman PD, Moring SE. Anal. Chem. 1993;65:489A. [Google Scholar]
- [3].Wang H, Xing J, Tan W, Lam M, Carnelley T, Weinfeld M, Le XC. Anal. Chem. 2002;74:3714. doi: 10.1021/ac0201979. [DOI] [PubMed] [Google Scholar]
- [4].Tao L, Kennedy RT. Electrophoresis. 1997;18:112. doi: 10.1002/elps.1150180121. [DOI] [PubMed] [Google Scholar]
- [5].Lam MT, Le XC. Analyst. 2002;127:1633. doi: 10.1039/b206531b. [DOI] [PubMed] [Google Scholar]
- [6].Tao L, Kennedy RT. Anal. Chem. 1996;68:3899. doi: 10.1021/ac960560+. [DOI] [PubMed] [Google Scholar]
- [7].Lin C-E, Liu Y-C, Yang T-Y, Wang T-Z, Yang C-C. J. Chromatogr. A. 2001;916:239. doi: 10.1016/s0021-9673(00)01269-3. [DOI] [PubMed] [Google Scholar]
- [8].Shihabi ZK. J. Chromatogr. A. 2000;902:107. doi: 10.1016/s0021-9673(00)00743-3. [DOI] [PubMed] [Google Scholar]
- [9].Beckers JL, Bocek P. Electrophoresis. 2000;21:2747. doi: 10.1002/1522-2683(20000801)21:14<2747::AID-ELPS2747>3.0.CO;2-Z. [DOI] [PubMed] [Google Scholar]
- [10].Quirino JP, Kim J-B, Terabe S. J. Chromatogr. A. 2002;965:357. doi: 10.1016/s0021-9673(01)01499-6. [DOI] [PubMed] [Google Scholar]
- [11].Kim J-B, Terabe S. J. Pharmaceut. Biomed. 2003;30:1625. doi: 10.1016/s0731-7085(02)00509-5. [DOI] [PubMed] [Google Scholar]
- [12].Liu Z, Sam P, Sirimanne SR, McClure PC, Grainger J, Patterson JDG. J. Chromatogr. A. 1994;673:125. doi: 10.1016/0021-9673(94)87065-9. [DOI] [PubMed] [Google Scholar]
- [13].Nielsen KR, Foley JP. J. Chromatogr. A. 1994;686:283. [Google Scholar]
- [14].Quirino JP, Terabe S. J. Chromatogr. A. 1997;781:119. doi: 10.1016/s0021-9673(00)00812-8. [DOI] [PubMed] [Google Scholar]
- [15].Quirino JP, Terabe S. Science. 1998;282:465. doi: 10.1126/science.282.5388.465. [DOI] [PubMed] [Google Scholar]
- [16].Kim J-B, Quirino JP, Otsuka K, Terabe S. J. Chromatogr. A. 2001;916:123. doi: 10.1016/s0021-9673(01)00566-0. [DOI] [PubMed] [Google Scholar]
- [17].Kim J-B, Otsuka K, Terabe S. J. Chromatogr. A. 2001;912:343. doi: 10.1016/s0021-9673(01)00599-4. [DOI] [PubMed] [Google Scholar]
- [18].Monton MRN, Quirino JP, Otsuka K, Terabe S. J. Chromatogr. A. 2001;939:99. doi: 10.1016/s0021-9673(01)01346-2. [DOI] [PubMed] [Google Scholar]
- [19].Shi W, Palmer CP. J. Sep. Sci. 2002;25:215. [Google Scholar]
- [20].Monton MRN, Otsuka K, Terabe S. J. Chromatogr. A. 2003;985:435. doi: 10.1016/s0021-9673(02)01654-0. [DOI] [PubMed] [Google Scholar]
- [21].Smadja C, Potier IL, Chaminade P, Jacquot C, Trouvin JH, Taverna M. Chromatographia. 2003;58:79. [Google Scholar]
- [22].Quirino JP, Terabe S. Chromatographia. 2001;53:285. [Google Scholar]
- [23].Jacquier JC, Desbene PL. J. Chromatogr. A. 1995;718:167. [Google Scholar]
- [24].Motomizu S, Takayanagi T. J. Chromatogr. A. 1999;853:63. doi: 10.1016/s0021-9673(99)00453-7. [DOI] [PubMed] [Google Scholar]
- [25].Lin C-E, Wang T-Z, Chiu T-C, Hsueh C-C. J. High Resolut. Chromatogr. 1999;22:265. [Google Scholar]
- [26].Lin C-E, Lin K-S. J. Chromatogr. A. 2000;868:313. doi: 10.1016/s0021-9673(99)01265-0. [DOI] [PubMed] [Google Scholar]
- [27].Satake I, Yang JT. Biopolymers. 1976;15:2263. doi: 10.1002/bip.1976.360151113. [DOI] [PubMed] [Google Scholar]
- [28].Almgren M, Hansson P, Mukhtar E, Stam JV. Langmuir. 1992;8:2405. [Google Scholar]
- [29].Hansson P, Almgren M. J. Phys. Chem. 1995;99:16684. [Google Scholar]
- [30].Jain N, Trabelsi S, Guillot S, McLoughlin D, Langevin D, Letellier P, Turmine M. Langmuir. 2004;20:8496. doi: 10.1021/la0489918. [DOI] [PubMed] [Google Scholar]
- [31].Hansson P, Almgren m. J. Phys. Chem. 1995;99:16694. [Google Scholar]
- [32].Pirogov AV, Shpak AV, Shpigun OA. Anal. Bioanal. Chem. 2003;375:1199. doi: 10.1007/s00216-003-1812-6. [DOI] [PubMed] [Google Scholar]
- [33].Shpak AV, Pirogov AV, Shpigun OA. J. Chromatogr. B. 2004;800:91. doi: 10.1016/j.jchromb.2003.10.072. [DOI] [PubMed] [Google Scholar]
- [34].Shpak AV, Pirogov AV, Shpigun OA. Anal. Bioanal. Chem. 2005;382:504. doi: 10.1007/s00216-005-3219-z. [DOI] [PubMed] [Google Scholar]
- [35].Sabate R, Gallardo M, Estelrich J. Electrophoresis. 2000;21:481. doi: 10.1002/(SICI)1522-2683(20000201)21:3<481::AID-ELPS481>3.0.CO;2-9. [DOI] [PubMed] [Google Scholar]
- [36].Cócera M, López O, Maza A.d.l., Parra JL, Estelrich J. Langmuir. 1999;15:2230. [Google Scholar]
- [37].Terabe S. Anal. Chem. 2004;76:240A. [PubMed] [Google Scholar]
- [38].Takeda S, Omura A, Chayama K, Tsuji H, Fukushi K, Yamane M, Wakida S.-i., Tsubota S, Terabe S. J. Chromatogr. A. 2002;979:425. doi: 10.1016/s0021-9673(02)01404-8. [DOI] [PubMed] [Google Scholar]
- [39].Quirino JP, Terabe S, Bocek P. Anal. Chem. 2000;72:1934. doi: 10.1021/ac990566+. [DOI] [PubMed] [Google Scholar]
- [40].Palmer JF. J. Chromatogr. A. 2004;1036:95. doi: 10.1016/j.chroma.2004.02.088. [DOI] [PubMed] [Google Scholar]