

Abstract
Endocytosis of the nicotinic acetylcholine receptor (AChR) is a proposed major mechanism of neuromodulation at neuromuscular junctions and in the pathology of synapses in the central nervous system. We show that binding of the competitive antagonist α-bungarotoxin (αBTX) or antibody-mediated cross-linking induces the internalization of cell surface AChR to late endosomes when expressed heterologously in Chinese hamster ovary cells or endogenously in C2C12 myocytes. Internalization occurs via sequestration of AChR–αBTX complexes in narrow, tubular, surface-connected compartments, which are indicated by differential surface accessibility of fluorescently tagged αBTX–AChR complexes to small and large molecules and real-time total internal reflection fluorescence imaging. Internalization occurs in the absence of clathrin, caveolin, or dynamin but requires actin polymerization. αBTX binding triggers c-Src phosphorylation and subsequently activates the Rho guanosine triphosphatase Rac1. Consequently, inhibition of c-Src kinase activity, Rac1 activity, or actin polymerization inhibits internalization via this unusual endocytic mechanism. This pathway may regulate AChR levels at ligand-gated synapses and in pathological conditions such as the autoimmune disease myasthenia gravis.
Introduction
Communication at synapses requires the location and maintenance of receptors at specific sites. Factors controlling the distribution of receptors are critical determinants of the cell response to external signals. Agonist-induced endocytosis has been shown to operate in various structurally related ion channels, and this process may contribute to synaptic plasticity (Tehrani and Barnes, 1991; Ehlers, 2000; Man et al., 2000; Herring et al., 2003; Nong et al., 2003).
The acetylcholine receptor (AChR) is the best-characterized ligand-gated ion channel (for review see Karlin, 2002). This receptor is found at neuromuscular junctions (NMJs) and at the central nervous system (CNS). The AChR in skeletal muscle is a heterologous pentamer composed of four different but highly homologous subunits in the stoichiometry α2βγδ (embryonic receptor) or α2βεδ (adult receptor; Gotti et al., 2006). The binding of acetylcholine promotes transition of the receptor from a closed to an open state in which it is permeable to cations and subsequent depolarization of the postsynaptic membrane (for review see Karlin, 2002).
Blockage of activity, embryonic development (Drachman et al., 1978; Libby et al., 1980; Bursztajn et al., 1983; Akaaboune et al., 1999; Salpeter, 1999), agonist application (St John and Gordon, 2001), and pathological conditions such as myasthenia gravis (Barrantes, 1998) have been shown to affect AChR targeting and metabolic stability at the plasma membrane. The endocytic mechanism by which AChRs are internalized is not fully understood. At the same time, endocytic modulation of the AChR appears increasingly relevant for the understanding of synaptic plasticity at the CNS and NMJ (Salpeter, 1999; Sanes and Lichtman, 1999).
In this study, we characterize ligand- and antibody-induced internalization of the muscle adult-type AChR (α2βeδ) heterologously expressed in a CHO cell line (Roccamo et al., 1999) and endogenously expressed in the C2C12 muscle cell line. We find that the competitive antagonist α-bungarotoxin (αBTX) and antibody-mediated cross-linking induces down-regulation of cell surface AChR, occurring in two stages. The receptor is first removed from the surface via a surface sequestration mechanism, and then an endocytic process eventually traffics it to the late endosomes. The endocytic pathway of the αBTX–AChR complex differs from many of the well-characterized clathrin or caveolar pathways because internalization of the receptor is not blocked by inhibiting dynamin activity or membrane cholesterol removal (Conner and Schmid, 2003; Borroni et al., 2007; Mayor and Pagano, 2007). The αBTX-labeled receptor sequestration and internalization depends on the integrity of the cytoskeletal network and requires the activity of the Rho GTPase Rac1. This is stimulated by αBTX binding followed by induction of Src phosphorylation and activation.
Results
αBTX binding to cell surface AChR causes receptor down-regulation
CHO-K1/A5 is a clonal cell line that expresses adult (α2βεδ) mouse AChR (Roccamo et al., 1999). Cell surface AChR can be detected using fluorescent derivatives of the competitive antagonist αBTX or with the specific monoclonal antibodies mAb210 or mAb35 (antibodies against an extracellular epitope of the α1 AChR subunit; Feng et al., 1998). To test whether αBTX binding affects AChR internalization, we monitored the levels of AChR on the cell surface before and after incubation with αBTX and upon chasing at 37°C. In the absence of αBTX, levels of surface AChR were similar at 0 and after 6 h of chase (Fig. 1 A, histogram; gray bars); incubation of CHO-K1/A5 cells for 6 h with a saturating concentration of αBTX resulted in a 40% reduction in surface AChR levels (Fig. 1 A). In the absence of αBTX, surface levels of AChR did not change even after treatment with cycloheximide for 6 h (unpublished data). This indicates that constitutive endocytosis and degradation of AChR are very slow processes in CHO-K1/A5 cells, and the contribution of biosynthetic pools to cell surface receptor levels is insignificant over this interval.
Figure 1.

αBTX binding induces internalization of AChR. (A and B) CHO-K1/A5 (A) or C2C12 cells (B) were incubated on ice without (−αBTX) or with αBTX (+αBTX) and chased at 37°C for 0 or 6 h in the absence or presence of the toxin. At the end of the incubation, surface levels of AChR were quantified by measuring the extent of anti-AChR mAb 210 binding to surface receptors. The bars in the top (CHO-K1/A5) and bottom histograms (C2C12) represent normalized fluorescence intensity of secondary AlexaFluor568 antibody directed against the primary anti-AChR monoclonal antibody mAb 210 versus that measured in untreated (toxin free) controls. In the case of C2C12 cells, AlexaFluor488-labeled αBTX was used for inducing internalization, and the quantification represents the ratio of mAb 210/αBTX fluorescence at 0 and 6 h, further normalized to ratio at 0 h. Each bar corresponds to weighted mean ± SEM (error bars) obtained from two independent experiments, with 150 cells for CHO cells and 25 cells for C2C12 cells. *, P > 0.1; **, P < 0.001; ***, P < 0.0001. Bars, 10 μm.
To test whether the internalization of AChR is induced by αBTX in a cell line endogenously expressing the receptor, we monitored AChR endocytosis in C2C12 cells. C2C12 is a myoblast cell line of murine origin that, upon differentiation, expresses the same AChR form (St John and Gordon, 2001) as the CHO-K1/A5 clonal cell line. In C2C12 cells treated with αBTX, surface levels of AChR were found to decrease significantly (Fig. 1 B), indicating that both C2C12 and CHO-K1/A5 cells exhibit αBTX-induced down-modulation of AChR.
Antibodies to AChR cross-link the receptors and increase their internalization and degradation rates (antigenic modulation), thus contributing to AChR loss in the autoimmune disease myasthenia gravis (Tzartos et al., 1986). To find out whether the heterologously expressed and endogenously expressed receptors responded to antibody-induced modulation, cells were treated with mAb35, an antibody against the main immunogenic region in the α subunit. Antibody-mediated cross-linking resulted in the reduction of cell surface levels of AChR in both CHO-K1/A5 and C2C12 cells (Fig. 2). These experiments suggest that AChR surface modulation in CHO-K1/A5 cells is similar to that observed in muscle cells and, therefore, validate use of the former cell line as a model system to study triggered AChR down-modulation.
Figure 2.

Antibody-mediated cross-linking results in down-modulation of surface AChR. CHO-K1/A5 (top) or C2C12 (bottom) cells were labeled with mAb 35 on ice, washed, and incubated with secondary AlexaFluor568 antibody (0 h) or were chased at 37°C for 6 h and incubated with secondary antibody on ice. The histograms represent the surface fluorescence values obtained by quantifying secondary AlexaFluor568 antibody fluorescence per cell normalized to 0 h. Bars represent the weighted mean of average from four experiments with at least 65 cells each (CHO-K1/A5) or from two experiments with at least 50 cells each (C2C12) ± SEM (error bars). *, P < 0.0001. Bars, 10 μm.
AChR endocytic traffic en route to late endosomes/lysosomes
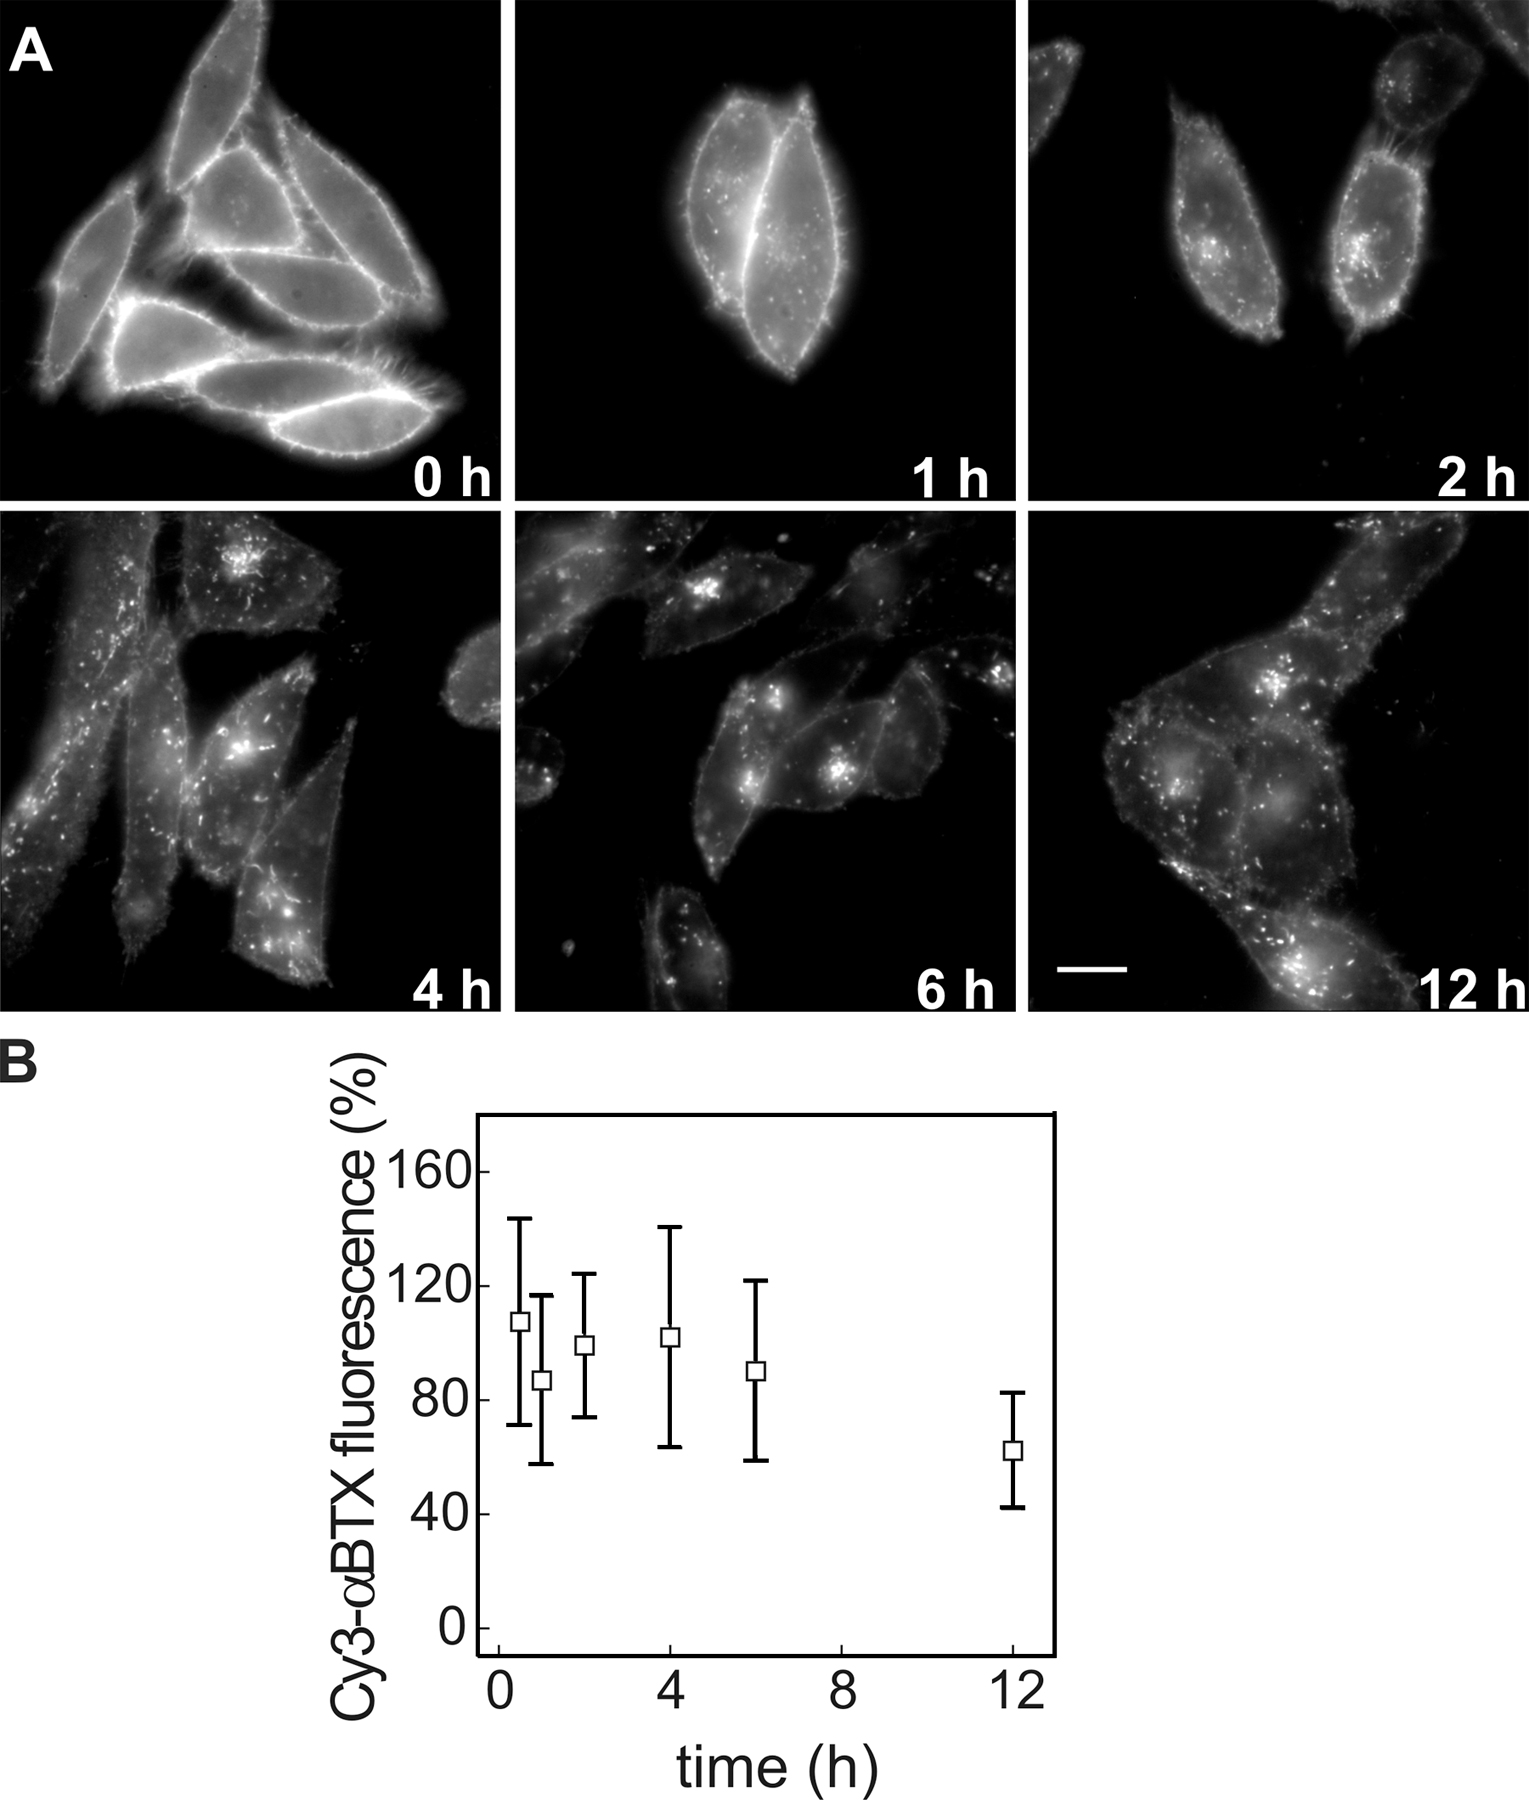
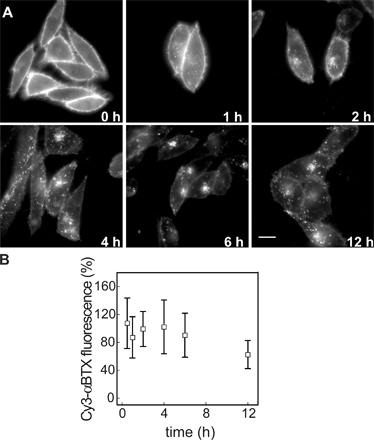
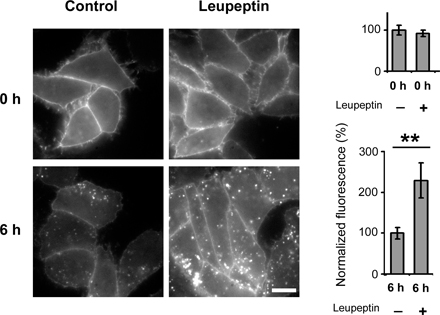
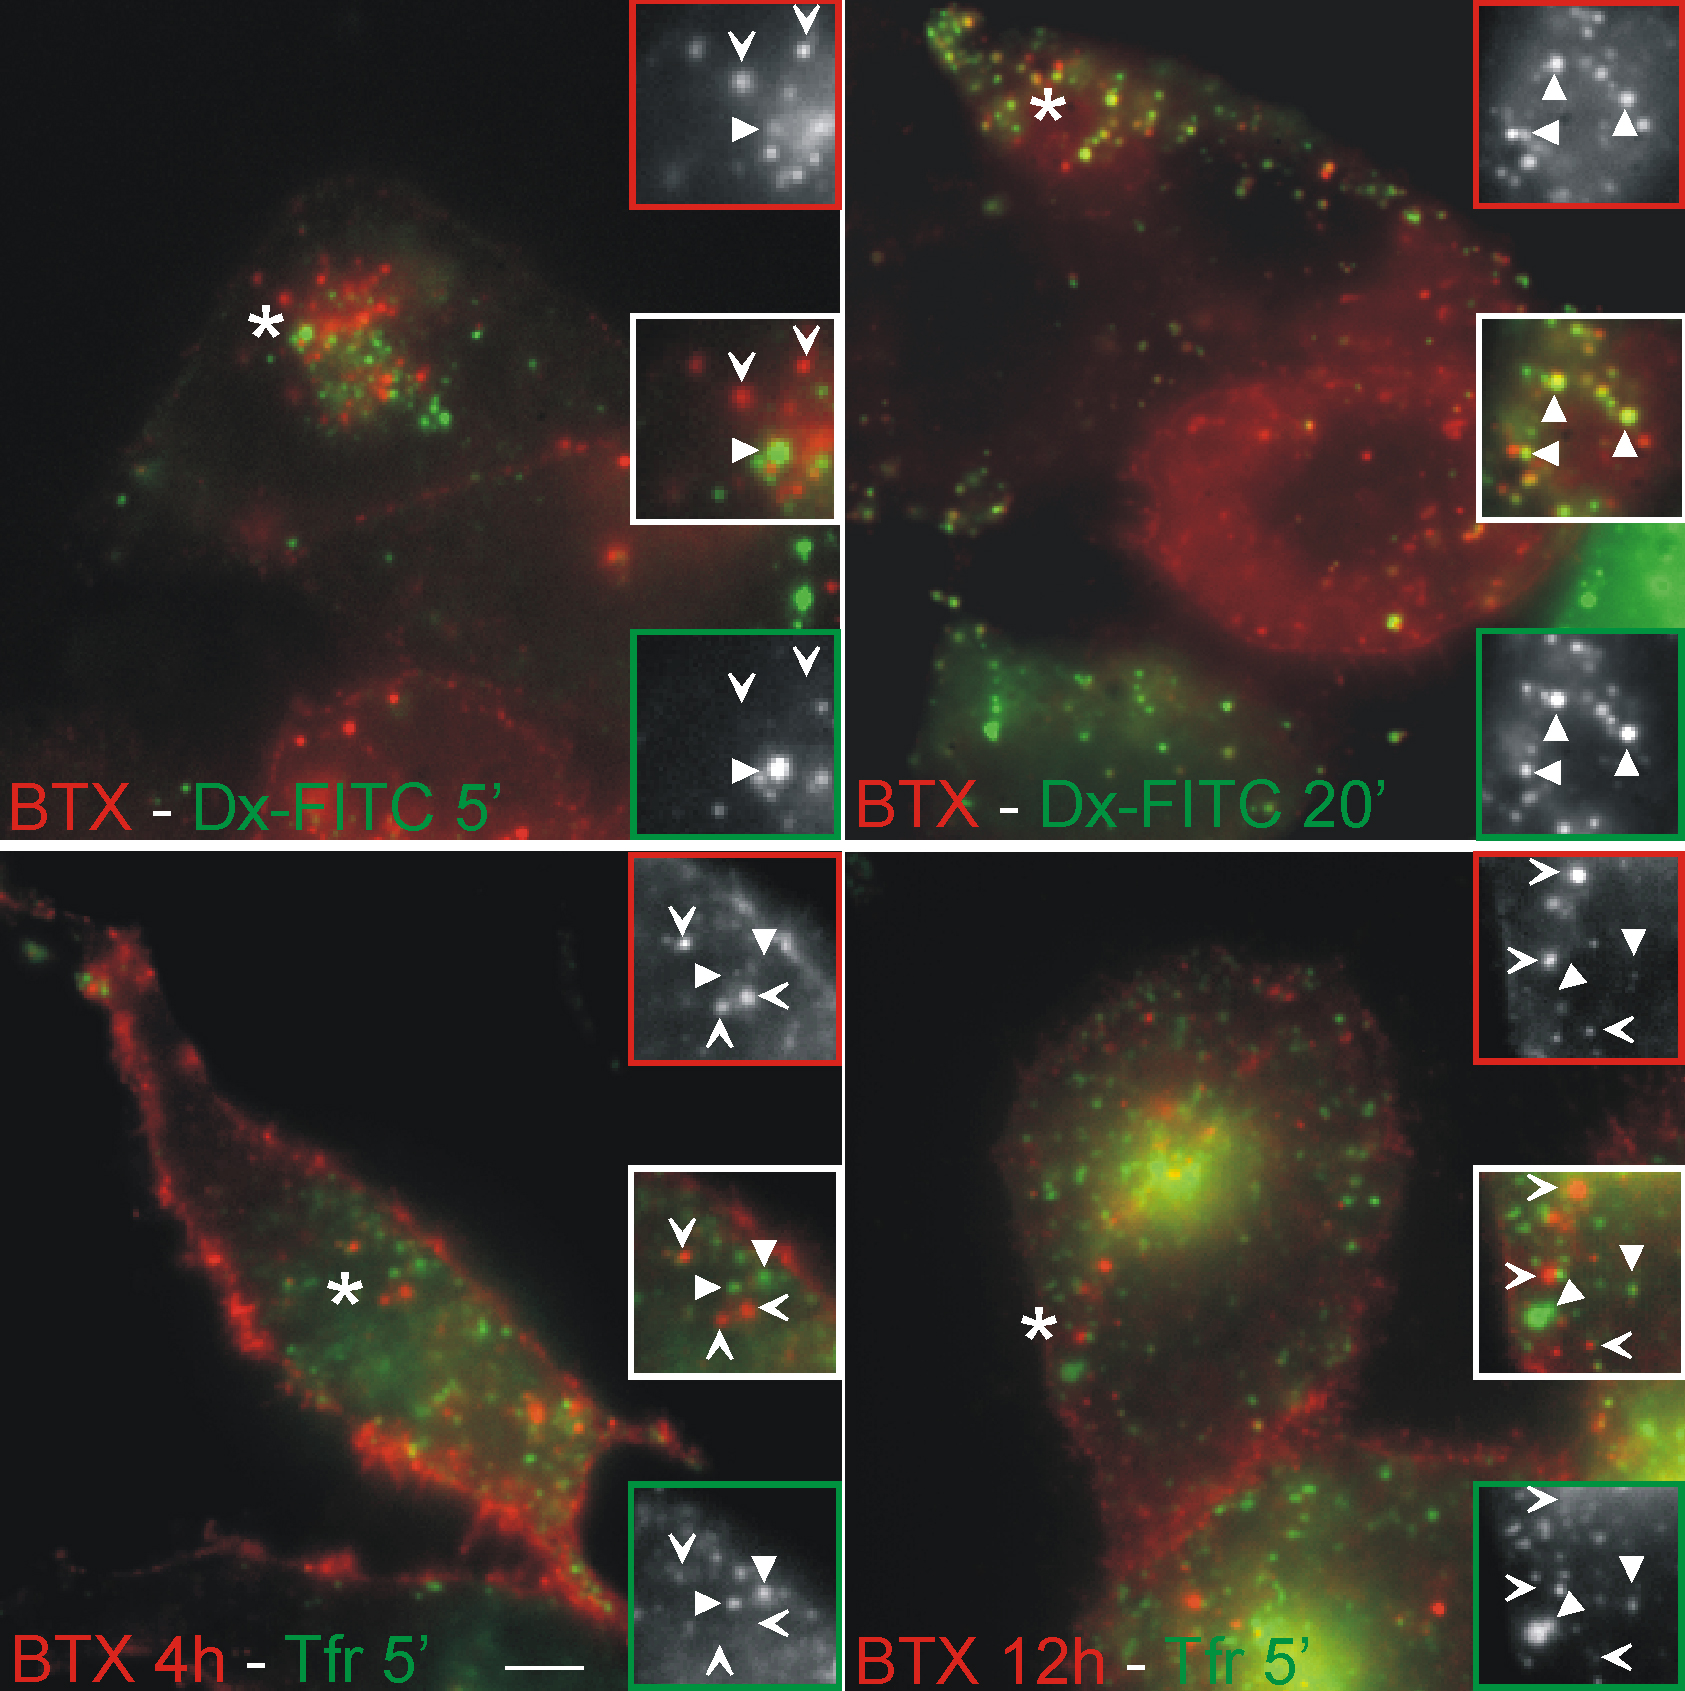
To assess the trafficking route of AChR upon internalization, we studied the kinetics of colocalization of αBTX-labeled AChR and several endomembrane markers. CHO-K1/A5 cells were labeled with Cy3αBTX for 1 h at 4°C and were chased for periods ranging from 0 to 12 h. Most of the label remained at the cell surface even after 2 h of chase (Fig. S1 A, available at http://www.jcb.org/cgi/content/full/jcb.200709086/DC1). Subsequently, a fraction of the fluorescently labeled AChR was found in punctate endosomal compartments. In live cells labeled with AlexaFluor488-αBTX, 4 h after labeling, endocytic carriers could be observed moving toward the perinuclear region (Video 1 and Fig. S2 B). The fraction of labeled AChR with a punctate intracellular distribution increased as a function of time (Fig. 3 A, 6 h; and Fig. S1 A). A significant number of such punctate compartments colocalized with lysosomal-associated membrane protein 1 (LAMP1), a late endosomal marker; colocalization with this marker increased upon further chase up to 12 h (unpublished data). Comparison of the time course of early endosomal antigen 1 (EEA1) and LAMP1 colocalization suggests that αBTX–AChR complexes are trafficked from EEA1-positive endosomes to late endosomes (compare colocalization of internalized AChR with EEA1 and LAMP1 in Fig. 3, A and B, respectively). Treatment of cells with 100 μM leupeptin (8 h), a lysosomal proteinase inhibitor, resulted in a higher amount of αBTX in late endosomes (Fig. S3), suggesting that the targeting of AChR to LAMP1-positive compartments leads to degradation of the receptor. In C2C12 cells, the intracellular distribution of AChR at various times after αBTX-induced internalization was similar to that observed in CHO-K1/A5 cells (Fig. 3 C), suggesting that the intracellular destination and trafficking of AChR in CHO-K1/A5 cells is not an artifact of exogenous expression. A significant fraction of αBTX-labeled AChR-positive punctate endosomes formed after 12 h in CHO-K1/A5 cells were accessible to a 20-min pulse but not to a 5-min pulse of fluorescein-labeled dextran, a marker of fluid-phase endocytosis (Fig. S4, top). This is consistent with their designation as fusion-competent late endocytic compartments.
Figure 3.

The AChR–αBTX complex is trafficked to late endosomes in CHO and C2C12 cells. (A) CHO-K1/A5 cells were labeled with Cy3αBTX for 1 h at 4°C and were chased for 0, 2, 4, or 6 h at 37°C, fixed, and stained with the indicated antibodies to organelle-specific markers EEA1 (early endosomes) and LAMP1 (lysosomes). Images of Cy3αBTX (red) and organelle-specific markers (green) were collected from single slices on a confocal microscope and color combined. Note that Cy3αBTX bound to AChR is initially extensively colocalized with EEA1, and, after a chase of 6 h, it is located with the late endosomal marker. Insets show magnified images of the boxed areas for αBTX (red outline) with EEA1 or LAMP1 (green outline) and a merge of the two (white outline). (B) The histogram represents the colocalization index of internalized αBTX with EEA1 or LAMP1 at the indicated time points depicted as a mean of the percentage of internalized αBTX colocalizing with the indicated organelle markers per cell (see Materials and methods). Error bars represent SEM. (C) C2C12 cells were labeled with Cy3αBTX as in A, chased for 0, 2, or 6 h, washed, fixed, and processed for indirect immunofluorescence for EEA1 (top) or lysobisphosphatidic acid (bottom). Insets are magnified images of the boxed areas for αBTX (red outline) and EEA1 or LBPA (green outline). (D) CHO-K1/A5 cells transfected with GFP-GPI (left) or caveolin 1–GFP were labeled with Cy3αBTX for 1 h on ice, chased at 37°C for 2 h, and subsequently imaged live. Images represent a single confocal section of live cells showing colocalization between αBTX (red) and GFP-GPI or caveolin 1 (green). Note that the tubular structures of αBTX (insets) are devoid of GFP-GPI or caveolin 1. Bars, 10 μm.
To elucidate the nature of the punctate endosomal compartments accessed by AChR, we examined colocalization with markers of different endocytic routes. The small punctate endosomes that formed initially did not colocalize with endocytosed transferrin (Tf) bound to its receptor (Tf receptor [TfR]; Fig. S4, bottom), a marker of the clathrin-mediated endocytic sorting and recycling pathway, or with GFP–glycosyl-phosphatidylinositol (GPI; Fig. 3 D, left), a marker of the Cdc42-regulated GPI anchored protein–enriched early endosomal compartment pathway in CHO cells (Sabharanjak et al., 2002), or with peripheral caveolin-positive structures (Fig. 3 D, right), a marker of caveolar endocytosis (Parton and Richards, 2003). However, a fraction of the 2- and 4-h αBTX-labeled AChR-positive endosomes did colocalize with EEA1 (Fig. 3, A and B).
These results indicate that αBTX binding induces a slow internalization of AChR via an endocytic pathway that results in transient accumulation of the receptor in EEA1-positive endocytic compartments distinct from those derived from the clathrin-mediated caveolar pathways or the clathrin- and caveolin-independent Cdc42-regulated GPI anchored protein–enriched early endosomal compartment pathway.
Sequestration of AChR into a surface-connected compartment
To characterize the very initial steps in the AChR down-regulation process, we examined the time course of loss of surface AChR labeled with biotin-Cy3αBTX (b-Cy3αBTX). To measure the accessibility of surface AChR to small molecules, we used the membrane-impermeable quencher potassium iodide (KI). To estimate the quantitative change in quenching efficiency as a function of incubation time, the quenching efficiency, Q, at any time point was normalized to the maximum quenching efficiency attainable after labeling the cells on ice (see Materials and methods section Accessibility of αBTX-labeled receptors to small molecules). To measure the accessibility of large molecules to b-Cy3αBTX–labeled AChR, we measured surface binding of ∼50-kD Cy5-streptavidin (SA). Measurement of the Cy5/Cy3 fluorescence ratio yielded a quantitative estimate of the accessibility of Cy5-SA to b-Cy3αBTX per cell. We carried out similar accessibility experiments using an independent label on AChR, FITC-αBTX. In this case, KI was used as a low molecular weight probe and a quenching-competent antifluorescein antibody (∼150 kD; Blakeslee, 1976) as a high molecular weight probe. Both approaches yielded identical results (unpublished data); therefore, we only report experiments carried out with b-Cy3αBTX.
After incubation on ice, all labeled AChRs were accessible to both small and large molecular weight probes (Fig. 4 A); the quenching efficiency of the KI- and Cy5-SA–binding capacity (Cy3/Cy5 fluorescence ratio) of the probes was similar to that obtained for free-labeled αBTX (Fig. 4 C, 0 time point). After 2 h, <50% of b-Cy3αBTX–labeled AChRs were accessible to Cy5-SA, whereas almost all (∼90%) of the receptors remained accessible to the small molecular weight quencher (Fig. 4, B and C). Incubation for an additional 4 h resulted in a significant loss of accessibility of the labeled AChRs to both small and large molecular weight quenchers: ∼60% of the receptors became inaccessible to KI and Cy5-SA after 6-h chase (Fig. 4 C), and 70% of the labeled AChRs became KI inaccessible after 12 h. However, by 12 h, there appeared to be some loss in the total Cy3αBTX receptor staining (Fig. S1 B), rendering the surface accessibility assay insufficiently accurate for quantifying the intracellular pool.
Figure 4.

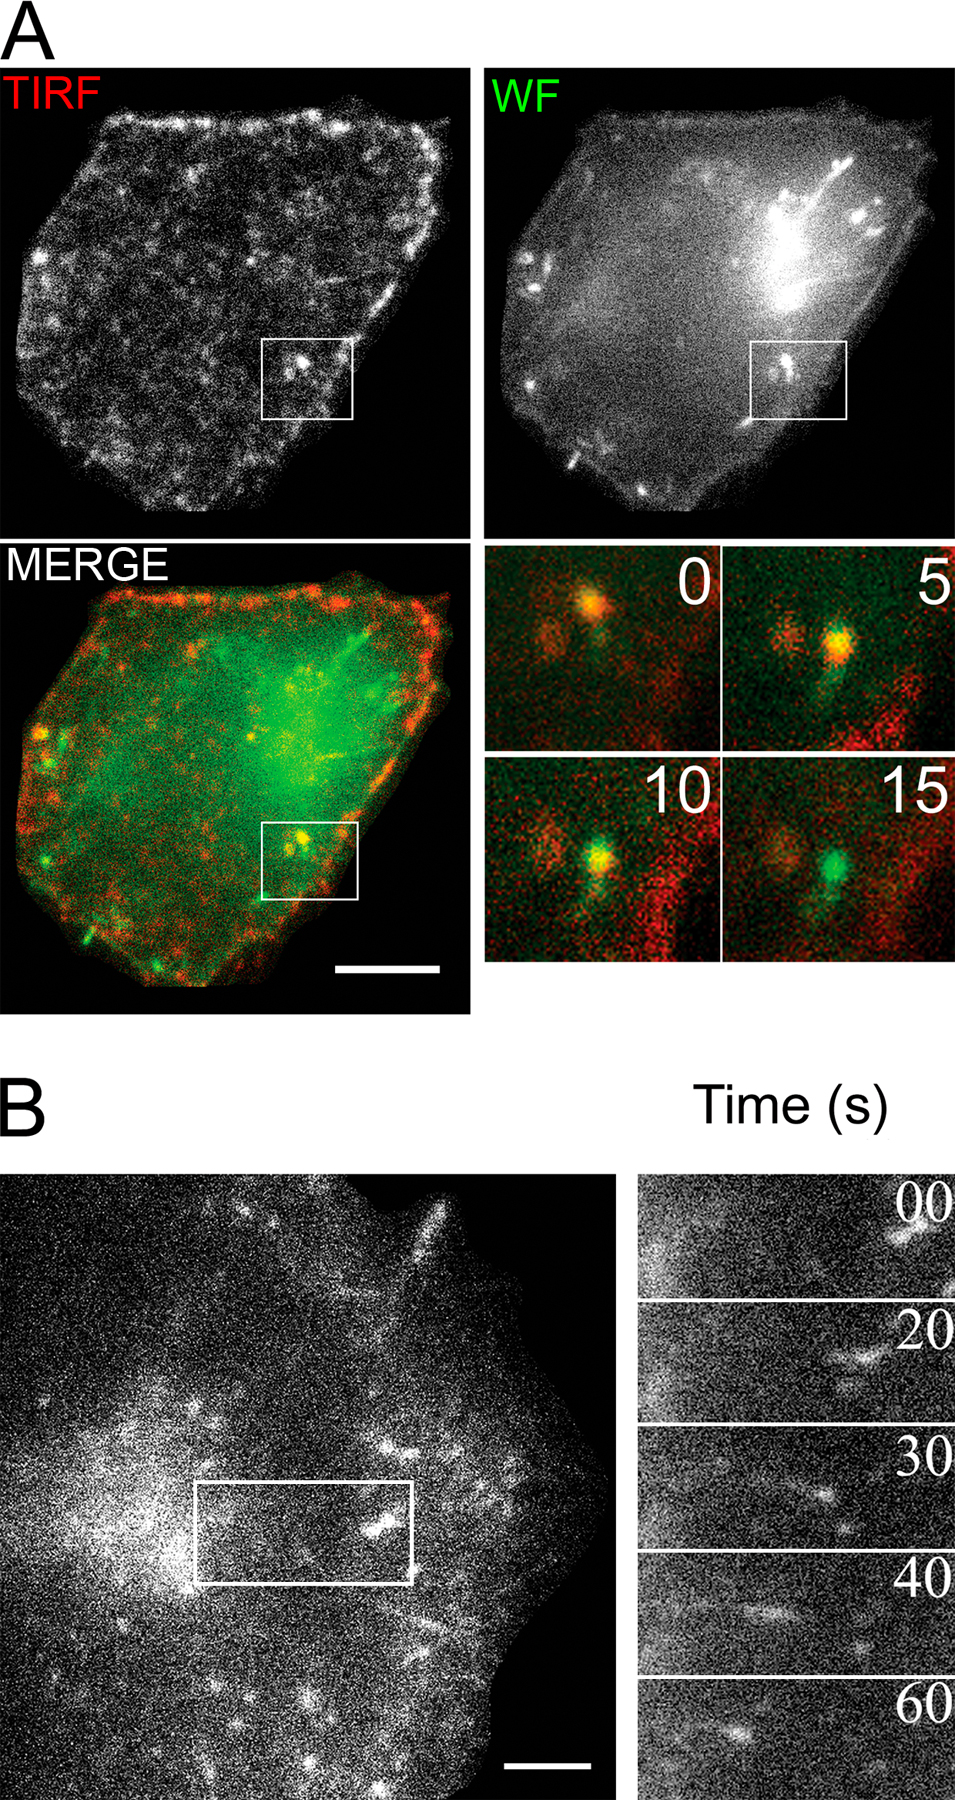
Kinetics of AChR sequestration and internalization into surface-accessible tubular structures. (A and B) CHO-K1/A5 cells were labeled at 4°C with b-Cy3αBTX for 1 h and subsequently incubated with Cy5-SA at 4°C for 1 h either before (A) or after a chase at 37°C for 2 h (B). Fluorescence images of Cy5-SA (green) and b-Cy3αBTX before (red) or immediately after quenching surface fluorescence with KI (blue). The arrows in the inset in A show the overlapping labeling of membrane with both b-Cy3αBTX and Cy5-SA before chase. The arrows in the inset in B indicate regions of the membrane that were labeled with b-Cy3αBTX that could be quenched with KI but were not accessible to Cy5-SA. Asterisks in both A and B indicate the regions of the cells that were magnified 2.5 times in the insets. (C) Graph showing quantitative estimate of the accessibility of the receptors labeled with b-Cy3αBTX at 4°C for 1 h and subsequently incubated at 37°C for the indicated times before assessing surface accessibility to Cy5-SA (indicating sequestration) or KI quenching (indicating internalization). Cy5/Cy3 fluorescence intensity ratio (squares) was calculated on a per cell basis, normalized to that at t = 0 h, and plotted against time. The extent of internalization was determined by measuring the extent of KI quenching. Cy3αBTX-labeled cells incubated for the indicated times at 37°C were imaged before and after quenching with KI, and percentage of quenching per cell (circles) was calculated (see Materials and methods). Each data point is from a minimum of 60 cells in a single experiment and represents weighted mean and errors from the mean obtained from at least three independent experiments. Error bars represent SEM. (D) TIRF imaging confirms the presence of AChR in membrane-proximal tubules before late endosomal delivery. Cells labeled with AlexaFluor488-αBTX on ice were chased at 37°C for 2 h and imaged live using TIRF microscopy. Montages from a video (Video 1, available at http://www.jcb.org/cgi/content/full/jcb.200709086/DC1) of TIRF images in the top-most panels (middle panels show their wide-field counterpart, and bottom ones are pseudocolored merge images of the wide-field [green] and TIRF [red] images) depict αBTX-labeled tubular structures close to the cell surface. The montage of insets are a magnified time-lapse sequence from a region outlined in the cell depicted in the bottom panels, where red and green outlined boxes represent αBTX distribution in TIRF and wide field, respectively. Bars: (A and B) 50 μm; (D) 10 μm.
Inspection of the fluorescence distribution of b-Cy3αBTX in cells labeled with b-Cy3αBTX on ice followed by incubation for 0 or 2 h at 37°C showed that almost all of the labeled probe was retained at the cell surface (Fig. 4, A and B; Cy3 images) and could be quenched with KI (Fig. 4, A and B, KI quenching; and C). Surprisingly, compared with the 0-h time point, after 2-h incubation at 37°C, a significant fraction of the b-Cy3αBTX probe (pseudocolored red in Fig. 4) quenched by KI could not be labeled by Cy5-SA (pseudocolored green in Fig. 4, A and B; and see merged images). Cy3-labeled regions devoid of the Cy5-SA signal could be resolved as small punctate spots (Fig. 4 B, arrows) often close to the optical resolution of the microscope setup used (∼300 nm).
The differential surface accessibility of the αBTX-labeled receptor to small and large molecular weight probes shows that the labeled receptor evolves from a fully surface-accessible state to a surface-connected but sequestered state upon incubation at 37°C. The rate of sequestration of labeled AChR may be derived from the rate of change of the Cy5-SA/b-Cy3αBTX ratio. This is described by a single exponential decay with a time constant, t1/2, of 1.98 ± 0.36 h. This result differs from those of the KI-quenching assay (Fig. 4 C), which is in agreement with the hypothesis of a sequestration process before loss of surface accessibility.
In an attempt to visualize these surface-connected but inaccessible structures, we utilized total internal reflection fluorescence (TIRF) microscopy, which reports on events in a 100–200-nm swathe of cytoplasm in proximity to the plasma membrane at the coverslip glass–water interface, where the evanescent field is generated (Axelrod, 1981). Alternating TIRF and wide-field imaging were carried out (see Materials and methods section Live cell and TIRF microscopy) to distinguish the structures being internalized beyond the TIRF field, leading to the disappearance of αBTX-labeled AChR from the cell surface. When observed live under TIRF microscopy, cells labeled with AlexaFluor488-αBTX after 2 h of chase exhibited punctate as well as tubular structures. The absence of wide-field correlates of most of the TIRF structures can be accounted for by the low contrast in wide-field illumination, especially near the cell surface (Fig. 4 D). Wide-field images showed tubular αBTX-labeled AChR-containing structures appearing as a collection of tubules and puncta in the TIRF images. These remained in the field of view for several frames but eventually disappeared from the TIRF field, although they were still detectable in the corresponding wide-field images. This behavior is consistent with the spatial movement of the tubular fragments out of the TIRF field as a result of their detachment from the surface (Video 2, available at http://www.jcb.org/cgi/content/full/jcb.200709086/DC1). Some structures were visible as spots, whereas the corresponding wide-field structures were tubular (Fig. S2 A and Video 3). Collectively, these observations suggest that αBTX–AChR complexes are endocytosed into tubular structures that reside in the proximity of the plasma membrane before detaching from the cell surface and being drawn inside the cell. Also, the occurrence of narrow tubular structures provides a likely explanation for the sequestration of AChR from high molecular weight quenchers but not KI.
Triggered AChR internalization is not blocked by inhibitors of dynamin function
Some ionotropic receptors have been shown to be internalized via a dynamin-dependent endocytic mechanism (Ehlers, 2000; Man et al., 2000; Herring et al., 2003; Nong et al., 2003). To investigate the mechanism operating in the case of the AChR, cells were transiently transfected with dynamin K44A–GFP, a GTPase-defective dominant-negative mutant of dynamin (Damke et al., 1994). We assessed endocytosis of αBTX-labeled AChR by monitoring the extent of loss of KI quenching of Cy3αBTX-labeled AChR at 6 h of uptake. The data showed that overexpression of the dominant-negative dynamin mutant did not affect internalization (Fig. 5, compare transfected cells in A and histogram in D) of the AChR, whereas it inhibited TfR uptake (Fig. 5 B). Independently, the sequestration of b-Cy3αBTX–labeled AChR was also unaffected by the expression of dynamin K44A (Fig. 5 C, compare Cy5-SA binding in transfected cells vs. untransfected cells; and Fig. 5 D, compare surface accessibility). Furthermore, overexpression of a deletion mutant of Eps15, EH21, a protein involved in endocytosis of a variety of receptors via clathrin-dependent (Benmerah et al., 1999) and -independent pathways (Mayor and Pagano, 2007), consistently blocked Tf endocytosis but had no detectable effect on AChR internalization induced by αBTX (Fig. 5 E) or mAb 35 (not depicted).
Figure 5.

Dynamin inhibition or silencing does not affect αBTX-induced AChR endocytosis. (A–D) CHO-K1/A5 cells were transiently transfected with GFP-K44A dynamin (outlined cells in A and C), and, 12 h later, cells were labeled with Cy3αBTX (A) or b-Cy3αBTX (C) and incubated at 37°C for an additional 6-h period. At the end of the incubation, Cy5-Tf was added to the cells in A to assess the effect of dynamin K44A on inhibition of clathrin-dependent endocytosis. The histogram in B shows the extent of inhibition of Tf endocytosis relative to untransfected controls. KI quenching (KI) and Cy5-SA accessibility (SA) were used to quantify the effect of dynamin K44A in transfected cells with respect to untransfected (control) cells as described in Fig. 4 (A and B), and the resultant data are shown as histograms in D. Bars represent the accessibility of b-Cy3-αBTX–labeled AChR to Cy5-SA and KI in control and untransfected cells normalized to 0 h. Weighted mean and errors from the mean were obtained from four independent experiments, each consisting of two coverslip dishes from which at least 30 cells per dish were analyzed. Error bars represent SD. *, P < 0.005; **, P > 0.1. (E) Cells transfected with a dominant-negative eps15 construct, EH21-GFP, for 14 h were incubated with Cy3-αBTX at 4°C for 1 h and chased for 6 h at 37°C. During the last 20 min of chase, Cy5-Tf was added to the cells. Cells were washed, and surface Tf was stripped off, fixed, and imaged. Note that cells expressing EH21 show reduction in Tf uptake as compared with surrounding cells, whereas internalized αBTX remains unaffected. In each experiment, at least 15 cells were analyzed, and 40% of cells showed a reduction in Tf uptake, whereas αBTX internalization is unaffected in that population. (F–J) CHO-K1/A5 cells were labeled with mAb 35 on ice and were either directly incubated with secondary antibody before (0 h) or after chase for 6 h at 37°C (F). Surface levels of AChR in cells treated with transfected pGSUPER-based dynamin shRNA-expressing constructs targeted against human (h) or mouse (m) dynamin 2 were quantified by measuring the level of labeled secondary antibody staining against mAb 35 remaining at the cell surface in transfected or untransfected cells, respectively, and were normalized to the level of secondary antibody staining at 0 h. Cells transfected with shRNA plasmids were identified by GFP expression from pGSUPER vector (corresponding images are not depicted). The histogram in G represents the weighted mean of average values obtained from at least 60 cells per dish in each case. *, P < 0.0001; **, P > 0.1. CHO-K1/A5 cells were transfected with dynamin shRNA-expressing constructs and, 68–72 h later, were either monitored for Tf uptake (H) or for dynamin levels (I and J). The histogram in H represents Tf-AlexaFluor546 uptake (ratio of internalized/surface Tf fluorescence) in cells transfected with shRNA constructs, and the ratio was further normalized to uptake in control. Each bar in the histogram represents weighted mean of averages ± SEM (error bars). *, P < 0.001. To assess dynamin levels, CHO-K1/A5 cells were transfected with shRNA vectors, harvested 72 h after transfection, and lysed, and levels of dynamin were detected on Western blots (I). Blots represent dynamin levels, and bottom lanes represent loading controls. The histogram in J shows quantification of dynamin levels in CHO-K1/A5 cells. Each bar represents the mean of dynamin levels normalized to actin levels per lane taken from two independent experiments, further normalized to the control in each case ± SD (error bars). Bars: (C) 20 μm; (F) 10 μm.
To confirm that dynamin is not required for triggered AChR endocytosis, we depleted cells of dynamin 2 using shRNA constructs as reported previously (Gomez et al., 2005). Expression of shRNAs resulted in a significant reduction in the rate of Tf endocytosis and in dynamin levels (Fig. 5, H–J). A CHO-K1–derived cell line that stably expresses human TfR, IA2.2, also showed similar defects in Tf endocytosis upon dynamin depletion (unpublished data). However, depletion of dynamin had no effect on AChR down-modulation by αBTX and mAb (Fig. 5, F and G) or by antibody alone (not depicted). These results confirm that AChR endocytosis is independent of the amount and activity of the dynamin 2 protein and that dynamin- and clathrin-dependent internalization machineries are not involved in AChR endocytosis.
AChR internalization depends on actin polymerization and activity of the Rho GTPase Rac1
Clathrin- and dynamin-independent endocytic processes appear to recruit the actin polymerization machinery to aid in endocytosis (Mayor and Pagano, 2007). Therefore, we investigated the role of actin polymerization in AChR endocytosis. We treated cells with cytochalasin D; cytochalasins inhibit actin polymerization by binding to the barbed end of the actin filament and by blocking monomer addition. Actin polymerization inhibitors have variable effects on clathrin-mediated endocytosis (Lamaze et al., 1997; Fujimoto et al., 2000). 2.5 μM cytochalasin D treatment for 2 h did not affect Tf uptake (Fig. 6, A and C; compare Tf uptake in treated vs. untreated cells), whereas it significantly decreased AChR sequestration (Fig. 6 B, compare Cy5-SA accessibility in treated vs. untreated cells). These results indicate that a dynamic rearrangement of the actin cytoskeleton is required for sequestration of the AChR. In addition, whereas untreated cells showed punctate endosomes 2 h after internalization, cytochalasin D–treated cells appeared devoid of internalized AChR puncta, showing that internalization of AChR is blocked by actin depolymerization.
Figure 6.

Inhibition of actin dynamics or Rho GTPase Rac1 blocks AChR sequestration and endocytosis. (A–C) CHO-K1/A5 cells were labeled with b-Cy3αBTX in the absence (control) or presence of cytochalasin D for 2 h and were labeled at 4°C with Cy5-SA to assess the fraction of surface-accessible receptors as described in Materials and methods. Comparison of Tf-AlexaFluor488 uptake (right panels in A and C) in control and cytochalasin D–treated cells shows that cytochalasin D treatment did not affect Tf-AlexaFluor488 uptake. The histogram in B shows the extent of Cy5-SA accessibility in cytochalasin D–treated and control cells normalized to that obtained at 0 h. Note that surface accessibility of AChR increased significantly in cytochalasin D–treated cells compared with control cells exposed to DMSO alone. Mean and SD (error bars) were obtained from at least 60 cells per experiment; similar results were obtained in three independent experiments. *, P < 0.001. (D) Cells were transfected with different dominant-negative mutant isoforms of Rho GTPases (Cdc42 N17, RhoA N19, and Rac1 N17) for 14 h or were treated for 1 h with 1 μg/ml C. difficle toxin B, were labeled with αBTX, subsequently chased for 6 h at 37°C, and incubated with mab 210 followed with secondary antibody on ice for 1 h to determine the level of surface AChR remaining at the end of the chase period. The histogram shows weighted mean ± SEM (error bars) values from two independent experiments. *, P < 0.0001; **, P > 0.05; ***, P > 0.1. (E) Images show the distribution of internalized b-Cy3αBTX (left) and mAb 210 antibody–stained surface AChR (right) in cells transfected with Rac1 N17 (outlined) with respect to untransfected control cells. (F) αBTX incubation of AChR-expressing CHO-K1/A5 cells with or without 10 μM PP2 were lysed, and activated Rac1 was precipitated using PAK-PBD; total Rac1 and PAK-PBD–precipitated Rac1 were analyzed by Western blots from the same cell lysates. Note that αBTX binding induces PP2-inhibitable Rac1 activation. Bars: (C) 20 μm; (E) 10 μm.
The Rho family of GTPases regulates actin dynamics and is known to affect endocytosis of a variety of proteins and membrane lipids (Mayor and Pagano, 2007). The sensitivity of AChR internalization to actin polymerization indicated the possible involvement of a Rho family GTPase in AChR endocytosis. To address this possibility, cells were treated with Clostridium difficile toxin B, which specifically and irreversibly glucosylates members of the Rho family of GTPases (Sehr et al., 1998). Toxin B treatment resulted in inhibition of αBTX-induced AChR uptake (Fig. 6 D). To specifically investigate the identity of the Rho GTPase involved, cells were independently transfected with GTP exchange–deficient forms of Rho GTPases regulating distinct pathways of endocytosis (i.e., Rac1, Cdc42, and RhoA). Whereas overexpression of dominant-negative RhoA and Cdc42 had no effect on AChR uptake, dominant-negative Rac1 blocked AChR uptake to a significant degree (Fig. 6, D and E).
To assess whether αBTX binding to AChR induces Rac1 activation, we exploited the observation that upon activation, GTP-bound Rac1 binds tightly to p21-associated kinase (Pak; Bagrodia et al., 1995). αBTX labeling resulted in significant Rac1 activation, which was observed as an increase in the amount of Rac1 that coimmunoprecipitated with Pak (Fig. 6 F). These observations suggest that αBTX binding to AChR triggers Rac1 activation, which, in turn, regulates AChR endocytosis, possibly through modulation of the actin cytoskeleton.
Src phosphorylation and AChR endocytosis
Src activation has previously been shown to modify AChR anchoring and phosphorylation (Mohamed and Swope, 1999; Sadasivam et al., 2005). In CHO-K1/A5 cells, binding of αBTX to AChR leads to an increase in Src phosphorylation (Fig. 7 C). The phosphorylation of Src is sensitive to treatment with the Src kinase–specific inhibitor PP2 (Hanke et al., 1996), indicating this to be an autophosphorylation event. Inhibition of Src phosphorylation by PP2 also inhibited the activation of Rac1 (Fig. 6 F), an event critical for AChR internalization. Therefore, we tested the role of Src activation in αBTX-induced AChR endocytosis using pharmacological inhibition of Src kinase by PP2 as well as overexpression of a Src K297R kinase-dead mutant form. Treatment of cells with PP2 or Src K297R overexpression inhibited the entry of AChR into the cell (Fig. 7, A and B). These results confirm that αBTX-induced AChR internalization involves Src autophosphorylation and the downstream activation of Rac1.
Figure 7.

αBTX-induced AChR endocytosis is mediated by Src phosphorylation. (A) CHO-K1/A5 cells were cotransfected with dominant-negative Src K297R and GFP, and the internalization of AChR induced by αBTX was assessed in cells positive for Src K297R. Note the absence of punctate structures in cells transfected with dominant-negative Src K297R. (B) CHO-K1/A5 cells were labeled with b-αBTX in the presence or absence of 10 μM PP2 and chased for 6 h. Surface AChR levels were determined by measuring the accessibility of b-αBTX to SA-PE. The histogram shows the quantification of surface-accessible AChR in the presence or absence (αBTX alone) of PP2. Each bar represents the weighted mean of internal AChR as estimated using flow cytometry data from 10,000 cells (see Materials and methods) normalized to cells labeled with b-αBTX on ice. Error bars represent SEM. *, P < 0.001. (C) CHO-K1/A5 cells treated without or with PP2 were incubated with αBTX for 2 h, and cell lysates from the same cells were analyzed by Western blotting for phosphorylated Src (antiphospho–Tyr418-Src) and total Src. Note that αBTX induces Src phosphorylation, which, in turn, is inhibited by pretreatment with PP2. Bar, 10 μm.
Discussion
Diffusion of AChRs to perijunctional areas and internalization has been shown to occur when neuromuscular transmission is blocked using αBTX, resulting in a shorter AChR half-life. Direct muscle stimulation inhibits this process (Akaaboune et al., 1999). Interestingly, these alterations in AChR density at the NMJ are equivalent to long-term potentiation and long-term depression in the CNS (Akaaboune et al., 1999). The rate of AChR endocytosis has also been found to increase in myotubes incubated in the continuous presence of cholinergic agonists (St John and Gordon, 2001) and by cross-linking with antibodies in human culture muscle cells (Tzartos et al., 1986) and in the BC3H-1 muscle cell line (Clementi and Sher, 1985). However, the endocytic mechanisms that lead to alterations in AChR levels at the cell surface have not been characterized.
In this study, we show that binding of the quasi-irreversible antagonist αBTX induces the internalization of the AChR via a relatively slow process. Internalization appears to proceed in two stages. First, the AChR seems to be sequestered in a surface-connected compartment that is not accessible to large molecular weight molecules such as SA or anti-AChR mAb. This process requires actin polymerization and Rac1 GTPase activation because treatment with cytochalasin D and toxin B and overexpression of a GDP exchange–deficient form of Rac1 result in a reduction of αBTX-triggered AChR sequestration. Second, αBTX-bound AChR is delivered to the lysosomal compartment via a distinct endocytic mechanism, as discussed below in this section. The relationship between these two stages is not clear, although it is likely that subsequent to sequestration, αBTX-liganded AChR is driven into the late compartments from surface-connected invaginations. The ability of small molecule quenchers (but not large molecular weight reagents) to access the nascent internalized receptors and their presence in surface-localized tubules visible in a TIRF field provide support for the proposed internalization model. However, these are indirect methods, and the ultrastructure of these surface-accessible structures remains uncharacterized. The sequestration in a surface-connected compartment (if reversible) may provide an alternative, faster mechanism for regulating the availability of AChRs to modulate signals accessible from the intersynaptic gap.
The mechanism behind surface sequestration resembles the sequestration mechanism of β-VLDL and other aggregated lipoproteins internalized via scavenger receptors into STEMs (surface tubule for entry into macrophages) in macrophages (Myers et al., 1993; Kruth et al., 1995; Zhang et al., 1997). Involvement of the actin cytoskeleton in both of these processes also suggests a similarity in mechanism; recruitment of the actin-modulating machinery to the site of sequestration appears necessary for both pathways. Surface sequestration and internalization are both insensitive to inhibition of dynamin function (via expression of a dominant-negative dynamin isoform or by expressing shRNA constructs), suggesting that this pathway is independent of the most extensively addressed vesicle-pinching mechanism (Conner and Schmid, 2003). The lack of a requirement for dynamin and Eps15, the absence of colocalization of AChR peripheral endosomes with caveolin, and the lack of colocalization with a well-characterized clathrin pathway marker, endocytosed Tf, indicate that this pathway is neither clathrin nor caveolin dependent. In addition, neither acute cholesterol depletion (Borroni et al., 2007) nor Cdc42 N17 expression inhibits internalization of αBTX-bound AChR. Endocytosed AChR also does not colocalize with GFP-GPI, further supporting the idea that this endocytic pathway represents an internalization mechanism distinct from the medley of clathrin-independent pathways available for membrane proteins at the surface of eukaryotic cells (Mayor and Pagano, 2007).
Once internalized, αBTX is trafficked to late endosomes via EEA1-positive endosomes, suggesting that the αBTX-bound receptor eventually accumulates in degradative compartments after fusing with early endosomes. However, at no stage do the endocytosed αBTX–AChR complexes colocalize with endocytosed Tf or a short pulse of fluid-phase marker. These results suggest that the trafficking of internalized αBTX–AChR complexes also represents an uncharacterized route to bonafide LAMP1-positive late endosomes.
At first glance, the data presented here appear to be in disagreement with a previous study (Trinidad and Cohen, 2004) showing the colocalization of internalized AChR and caveolin 3 in myotubes. This apparent discrepancy can be explained by the cell type and the scale of AChR organization during development: although in CHO cells, the AChR can be observed as submicrometer-sized puncta (Borroni et al., 2007) that we have interpreted as representative of preinnervation aggregates of AChRs and recently resolved as nanometer-sized AChR nanoclusters (Kellner et al., 2007), the observations of Trinidad and Cohen (2004) were carried out in C2C12 myotubes at a stage of differentiation in which AChRs are organized into large, several micrometer–sized clusters. In fact, the latter authors defined these AChR clusters as much larger structures (i.e., longer than 4 μm; Trinidad and Cohen, 2004). Thus, endocytosis of AChR in more mature clusters may proceed through caveolin-mediated mechanisms, although the colocalization with caveolin 3 has more recently been challenged (Stetzkowski-Marden et al., 2006).
Here, we show that binding of αBTX to AChR leads to the activation of Rac1, which is required for AChR internalization possibly via the modulation of actin dynamics, which is critical for AChR surface sequestration. In parallel, we observe that the concomitant autophosphorylation of Src is also required for AChR endocytosis. It will be interesting to investigate whether activated Src phosphorylates molecular regulators of AChR internalization like Rac1 or AChR, or both. A pivotal role of Src and Rac1 activation has also been recently observed in HIV-Nef–mediated down-modulation of immune costimulatory molecules CD80/CD86 (Chaudhry et al., 2005, 2007). Both AChR and CD80/CD86 are long-term cell surface–resident proteins in the cell systems studied. Thus, it is likely that this endocytic mechanism may be of general relevance in remodeling the molecular composition of the plasma membrane. The precise molecular events linking Src phosphorylation and Rac1 activation and their temporal regulation need to be explored in the context of AChR endocytosis.
Bruneau et al. (Bruneau et al., 2005; Bruneau and Akaaboune, 2006) have recently described the dynamics of recycled αBTX-labeled AChR at the living NMJ. Although the major fraction of AChRs appears to be targeted to late endosomes for degradation, in the two independent systems used here, we find that a small fraction of internalized αBTX–AChR colocalizes with Rab11, a recycling endosomal marker, at all time points of chase (unpublished data). Furthermore, the intrinsic mechanisms underlying the dynamics of AChR internalization described by Bruneau et al. (Bruneau et al., 2005; Bruneau and Akaaboune, 2006) share some similarities with the ones disclosed in this paper. First, these authors observed internalized αBTX–AChR in very stable EEA1-positive vesicles at the NMJ, the same as we do in CHO-K1/A5 and C2C12 cells. They also show that αBTX–AChR recycling to the cell surface is sensitive to Tyr phosphorylation/dephosphorylation; in this study, AChR endocytosis is shown to depend on the well-known Tyr kinase Src, which also regulates the stability of AChR clusters in vivo (Sadasivam et al., 2005).
AChR removal from the cell surface has important pathophysiological consequences in the autoimmune disease myasthenia gravis, in which receptor internalization is accelerated upon binding of anti-AChR antibodies (Barrantes, 1998). Thus, IgG from myasthenic patients causes antigenic modulation of muscle AChR in vivo and in vitro (Drachman et al., 1978). Our experiments show that monoclonal antibodies against the muscle-type AChR also induce its internalization. It is likely that the mechanism described here is similar to the one operating in the myasthenic muscle.
The αBTX-induced AChR endocytosis reported here appears to differ from the clathrin-dependent endocytosis of γ-aminobutyric acid, AMPA, and N-methyl-d-aspartate receptors (Man et al., 2000; Herring et al., 2003; Nong et al., 2003). It is important to note that all of these receptors are located at CNS synapses, whereas here, we deal with a peripheral muscle-type AChR. The rate of the endocytic mechanism operating in peripheral and central synapses also appears to differ, and this is mirrored by AChR in CHO cells and in the myocyte cell line C2C12. We calculated a t1/2 of 1.98 ± 0.36 h for endocytosis of the muscle-type AChR heterologously expressed in CHO-K1/A5 cells. The AMPA receptor in cultured neurons, on the other hand, exhibits a much faster process: t1/2 = 9.3 ± 2.3 min (Ehlers, 2000). It is possible that neuromuscular synapses regulate the availability of AChR and, consequently, synaptic strength via mechanisms different from those operating in CNS synapses.
Lynx1 is a GPI-anchored membrane-resident protein that possesses a structure notably similar to that of αBTX (Ibanez-Tallon et al., 2002). This neurotoxin-related protein was shown to directly interact with a neuronal subtype of AChR and to modulate its function (Ibanez-Tallon et al., 2002). A process similar to the slow down-regulation exerted by αBTX on muscle-type AChR may thus be operative in the CNS by the interaction between Lynx and neuronal AChR and may constitute a modulatory mechanism contributing to synaptic plasticity.
Materials and methods
Materials
All chemicals were obtained from Sigma-Aldrich unless otherwise specified. Cy3 and Cy5 fluorochromes were purchased from GE Healthcare. AlexaFluor488, FITC, and AlexaFluor594-αBTX were purchased from Invitrogen. mAb 210 antibody against the AChR α subunit was a gift from J. Lindstrom (University of Pennsylvania Medical Center, Philadelphia, PA), and mAb 35 and anti-LAMP were purchased from Developmental Studies Hybridoma Bank. Anti-EEA1, Rac1, phospho-Src antibodies, and SA-phycoerythrin (PE) were purchased from BD Biosciences. PAK–Pak-binding domain (PBD)–coupled agarose (Chemicon) was used to pull down activated Rac. Antibodies against c-Src and pTyr418-Src were obtained from Cell Signaling Technology and Millipore, anti-Rac was obtained from BD Biosciences, and anti–lysobisphosphatidic acid antibody was a gift from T. Kobayashi (University of Geneva, Geneva, Switzerland). Secondary antibodies were obtained from Jackson ImmunoResearch Laboratories. Constructs encoding shRNA against dynamin were a gift from D. Billadeau (Mayo Clinic College of Medicine, Rochester, MN; Gomez et al., 2005), and a dominant-negative inhibitor of eps15, EH21-GFP, was provided by A. Benmerah (Institut National de la Santé et de la Recherche Médicale E9925, Faculté Necker-Enfants Malades, Paris, France; Benmerah et al., 1999).
Cell culture and transfections
CHO-K1/A5, a cell line derived from CHO-K1 cells (Roccamo et al., 1999), was grown in Ham's F-12 medium containing10% FBS, 100 U/ml penicillin, 100 μg/ml streptomycin, and 0.5 mg/ml G-418. In some experiments, CHO-K1/A5 cells were transiently transfected with GFP-labeled caveolin, GFP-GPI, or GFP–dynamin K44A using Lipofectamine (Invitrogen) or Fugene (Roche) according to the protocol given by the manufacturer and were used for experiments 12 h after transfection exactly as described previously (Sabharanjak et al., 2002). The C2C12 murine myoblast cell line (provided by J. Dhawan, Centre for Cellular and Molecular Biology, Hyderabad, India) was grown in DME supplemented with 20% FBS at 37°C and 5% CO2. For differentiation, C2C12 cells were plated in phenol red–free DME (HiMEDIA Laboratories) containing 20% FBS and grown until 90% confluency. Cells were then shifted to medium containing 0.5% FBS for 24 h and used for endocytic assays.
Labeling of αBTX with fluorescent dyes
Native αBTX was dissolved in PBS (150 mM NaCl, 10 mM Na2HPO4, and 10 mM NaH2PO4, pH 7.5) to a final concentration of 125 μM. Conjugation was allowed to proceed for 1 h at room temperature with 10-fold molar excess dye. Labeled αBTX was subsequently separated from free dye by gel filtration on a Sephadex G-25 column. For biotin conjugation, an aliquot of Cy3αBTX was further incubated with biotin N-hydroxysuccinimide ester at a molar ratio of 1:5 for 30 min at room temperature. Excess biotin was separated by overnight dialysis. The dye/protein ratio was estimated, and conjugates with labeling efficiency less than one were used in experiments.
Accessibility of αBTX-labeled receptors to small molecules (KI quenching)
To measure the rate of sequestration and internalization of AChRs, CHO-K1/A5 cells were incubated with Cy3αBTX or FITCαBTX for 1 h on ice, rinsed with chilled M1, and shifted to 37°C for varying periods from 0 to 12 h. Cells were subsequently imaged both before and after adding the membrane-impermeable quencher KI at a concentration of 400 mM for b-Cy3αBTX and at 100 mM for FITCαBTX. The quenching efficiency was calculated with the equation Q(%) = 100 × (1 − FKI/F), where FKI and F are the fluorescence intensities of labeled αBTX cells immediately after adding the quencher or just before, respectively. The extent of quenching of the labeled receptors was normalized to the maximal quenching efficiency obtained after quenching receptors bound on ice. Maximal quenching efficiencies of the free probes were ∼80% for Cy3-labeled toxin and ∼60% for the FITC-labeled toxin at these concentrations of quencher, which is similar to those obtained on cell surface–bound receptors.
Surface accessibility to Cy5-SA of AChRs labeled with b-Cy3αBTX
To determine the extent of sequestration of AChRs, surface accessibility of labeled receptors was measured as described previously (Guha et al., 2003). In brief, CHO-K1/A5 cells were incubated with b-Cy3αBTX for 1 h on ice, rinsed with chilled M1, and shifted to 37°C for different periods (0–12 h). After the indicated time, cells were labeled with Cy5-SA for 1 h at 4°C, rinsed with chilled M1, and imaged by quantitative digital microscopy to measure fluorescence intensity from Cy3-labeled receptors and corresponding Cy5 signals from the same cells. The Cy5/Cy3 fluorescence ratio at different times provided an estimate of the accessibility of the biotin tag on the Cy3αBTX-labeled receptor to Cy5-labeled SA; the Cy5/Cy3 ratio of receptors labeled on ice was considered fully (100%) accessible.
Endocytosis and colocalization experiments
Unless otherwise specified, cells were incubated with saturating concentrations of AlexaFluor488-αBTX, Cy3αBTX, AlexaFluor594-αBTX, or other AChR probes for 1 h on ice and rinsed with chilled M1 medium (140 mM NaCl, 20 mM Hepes, 1 mM CaCl2, 1 mM MgCl2, and 5 mM KCl, pH 7.4). For different probes, saturation was achieved at ∼0.1–1 μM. For labeling and pulsing of AChR in the myocytes, differentiated C2C12 cells were incubated with either anti-AChR mAb or AlexaFluor488-αBTX for the indicated times, washed with M1 medium containing 0.1% BSA, 0.1% glucose, and 0.5% FBS, and imaged live in the same medium. Whenever required, protein biosynthesis was arrested by incubation of cells with 200 μg/ml cycloheximide for 6 h before labeling with fluorescent αBTX.
For endocytic trafficking of AChR, CHO-K1/A5 cells were incubated with Cy3αBTX for 1 h on ice, rinsed with chilled M1, and shifted to 37°C in growth medium for different periods (0–12 h). To assess colocalization with Cy5-Tf or FITC-dextran, these probes were added to the medium at different time points. After incubation, cells were washed for 10 min with chilled ascorbate buffer (140 mM sodium ascorbate, 65 mM ascorbic acid, 1 mM CaCl2, and 1 mM MgCl2, pH 4.5) to remove surface-bound Tf and were imaged. To test possible colocalization with the early endosomal marker EEA1 and with the late endosomal marker LAMP1, cells were labeled with Cy3αBTX and incubated at 37°C for 2, 4, 6, or 12 h. Cells were subsequently fixed, permeabilized, and immunostained with anti-EEA1 or anti-LAMP1 antibodies. For caveolin and GPI anchored protein colocalization studies, cells were transiently transfected with plasmids coding for caveolin-GFP or GPI-GFP as described previously (Sabharanjak et al., 2002), labeled with Cy3αBTX on ice for 1 h, chased at 37°C for 2 h, and imaged live. For quantitative assessment of colocalization, CHO-K1/A5 cells were labeled with Cy3αBTX on ice for 1 h, washed, chased at 37°C for 0, 2, 4, or 6 h, fixed, and processed for immunofluorescence for EEA1 or LAMP1. Cells were imaged using a spinning disc confocal microscope (CSU22; Yokagawa) mounted on a microscope (IX81S1F; Olympus) coupled to an electron multiplying CCD camera (Ixon; Andor Technology), and a single confocal slice from each plane was used for quantification. Each slice was processed for background correction using median filter in MetaMorph and spotting using Multispots to extract out spots or endosomes from whole cell images as described previously (Kalia et al., 2006). Spotted images of αBTX were compared with spotted images of EEA1 or LAMP1 using Multicolloc, a custom software designed to determine the extent of the colocalization of intensities of two probes via the generation of a colloc image. Regions were marked in the original images of cells so as to select internal fluorescence only, and these regions were extrapolated on spotted images to find total internalized intensities and extrapolated on the colloc images to find total colocalized intensities. These intensities were presented as a ratio (colloc image intensity/spotted image intensity) per cell.
For immunolocalization of organellar markers in C2C12 cells, cells were labeled with BTX, chased for the indicated time points, and fixed using 4% PFA for 20 min at room temperature. Subsequently, cells were permeabilized with 0.1% saponin for 20 min, washed, incubated with 2% goat serum for 1 h, washed, incubated with primary antibodies at 4°C overnight, washed, incubated with secondary antibody for 1 h, washed, and imaged. For washing C2C12 cells until fixation, serum-free growth medium at 37°C was used for washing instead of M1.
Dynamin inhibition
Cells were transiently transfected with dynamin K44A–GFP, a dominant-negative mutant of dynamin 2 (Altschuler et al., 1998). 12 h after transfection, AChR accessibility was determined as described in the Endocytosis and colocalization experiments section. As a positive control of dynamin inhibition, endocytosis of TfR was measured in CHO-K1/A5 cells by adding Cy5-Tf for 20 min. For dynamin 2 RNA interference studies, cells were transfected with the shRNA plasmids for 68–72 h. Transfected cells were identified by monitoring GFP fluorescence. The extent of Tf endocytosis in CHO-K1/A5 cells that express endogenous hamster TfRs was quantified by first determining the mean endocytic uptake of AlexaFluor546-Tf in GFP-expressing cells transfected with either vector control or dynamin-shRNA–containing vector by determining the amount of fluorescent Tf remaining in endocytic compartments after a pulse of 5 min, after removal of surface-bound Tf. These values were subsequently normalized to the mean level of surface TfRs by determining the extent that AlexaFluor546-Tf bound to the cells on ice in cells that were independently transfected with the corresponding constructs.
Surface accessibility of AChR was determined by incubating cells with mAb 35 in the presence or absence of αBTX at 4°C. Cells were then washed and either incubated with secondary antibody immediately or after a chase at 37°C for 6 h. Subsequently, cells were fixed and imaged.
To assess levels of dynamin 2 using Western blots, cells grown in 60-mm dishes were transfected with vector alone (control), shRNA m, or shRNA h for 72 h, harvested by scraping, washed, lysed, and analyzed by detecting proteins using nitrocellulose membranes by Western blotting. Lysate from ∼200,000 cells per lane were loaded on an 8% gel, and the approximate migration positions of dynamin 2 and actin were marked against prestained molecular weight markers after Ponceau staining. Actin- and dynamin-containing strips of membrane were processed and developed independently. For quantitation of protein levels, the developed films were scanned, and the dynamin 2 level was normalized to the respective actin level in the same lane.
Cytochalasin D treatment
Cells were labeled with b-Cy3αBTX for 1 h on ice and shifted to 37°C for 0, 2, and 4 h in complete growth medium containing 2.5 μM cytochalasin D or an equivalent amount of the solvent DMSO. 20 min before the incubation finished, AlexaFluor488-Tf was added to ascertain the specificity of cytochalasin D treatment. After incubation for specified periods, cells were washed for 10 min with ascorbate buffer, labeled with Cy5-SA for 1 h at 4°C, and imaged. The Cy5-SA/Cy3-biotin-αBTX ratio was calculated and normalized to 0 h, and the extent of TfR endocytosis was assessed by fluorescence quantification of acid wash–resistant intracellular AlexaFluor488-Tf.
Rho GTPase inhibition and toxin B treatment
CHO-K1/A5 cells were transfected with myc-RhoA N19 or myc-Rac1 N17, labeled with AlexaFluor594-αBTX on ice for 1 h, washed, and chased in complete medium at 37°C for 6 h. For toxin B treatment, the entire procedure was repeated in the presence of 1 μg/ml toxin B with a chase in complete medium for 1 h followed for a further 5 h in the absence of toxin B. Cells were then washed with chilled M1, labeled with mAb 210 followed with AlexaFluor647 secondary antibody on ice to detect the surface pool of AChR, fixed, and imaged.
Activation of c-Src and Rac1
Cells treated with αBTX for 2 h were lysed in radioimmunoprecipitation buffer (150 mM NaCl, 50 mM Tris-HCl, pH 7.5, 500 μM EDTA, 100 μM EGTA, 1.0% Triton X-100, and 1% sodium deoxycholate). For assessing Rac1 activation, lysates were precleared and affinity precipitated using PAK-PBD (Chemicon). The precipitate was resolved on a 10% SDS-PAGE and detected using anti-Rac1 antibody. To assess activation of c-Src, lysates of αBTX-treated CHO-K1/A5 cells were Western blotted with anti-Src (total c-Src) or antiphospho-–Tyr418-Src antibodies (activated c-Src). Protein content in the lysate was calculated using the microBCA kit (Thermo Fisher Scientific), and equal protein quantities were loaded.
Inhibition of c-Src activity
αBTX-treated CHO-K1/A5 cells were pretreated with 10 μM of the c-Src inhibitor PP2 for 1 h before assessing the effect of this treatment on Rac1 activation or inhibition of c-Src phosphorylation. Cells were labeled with biotin-αBTX on ice, washed extensively, and then shifted to 37°C followed by chase for 4 h. At the end of the chase, surface αBTX was removed using extreme buffer. The internalized label was detected by permeabilizing cells, staining them with SA-PE, and analysis on a flow cytometer (LSR; Becton Dickinson).
src gene mutants were made by cloning PCR-amplified versions of appropriate cDNAs into myc-p–containing pCDNA3.1 vector. Wild-type and kinase-dead (K297R) isoforms of human Src obtained from Millipore were cloned into a mammalian expression vector, pCDNA3.1(B-)MycHis+, using available restriction sites. The kinase-dead c-Src (Src K297R) was transfected into cells along with GFP expression vector in a ratio of 2:1 (wt/wt) with the maximum achievable efficiency of cotransfection.
Fluorescence microscopy and image analysis
Live cell and TIRF microscopy.
For live cell TIRF and wide-field imaging, an inverted system (TE 2000; Nikon) equipped with a 100× NA 1.45 oil objective (Nikon) coupled to a bank of lasers and a CCD camera (Cascade; Photometrics) was used. For dual-color live imaging, the growth medium was substituted with M1 containing 0.1% BSA and glucose, and a temperature-controlled stage maintained at 37°C was used. For TIRF imaging, an Argon ion 488-nm laser coupled to the aforementioned system was used at 10-mW output power.
Quantitative microscopy and image analysis.
For most of the quantitative fluorescence microscopy assays, imaging of cells was carried out on an inverted wide-field fluorescence microscope (TE 300; Nikon) using 20× NA 0.75 and 60× NA 1.4 objectives (Nikon) equipped with a sensitive digital imaging camera (MicroMax; Princeton Instruments) equipped with a sensor (TEK512 B; Roper Scientific). Images were collected using MetaMorph acquisition control software (MDS Analytical Technologies). Confocal microscopy was carried out on a spinning disc confocal imaging system (IX81; Olympus) equipped with a scanning device (CSU22; Yokogawa) and Ixon camera. For imaging, a 60× NA 1.42 oil objective (Olympus), Ixon camera, appropriate filter set dichroics, and lasers were used. Image acquisition was carried out using Revolution software (Andor Technologies) and further analysed using MetaMorph. Images were processed, and fluorescence was quantified by methods described in the figure legends and in greater detail in previous studies (Sabharanjak et al., 2002; Guha et al., 2003).
Flow cytometry
After staining with primary reagents (e.g., biotinylated αBTX), cells were stained with secondary reagents (e.g., SA-PE) on ice for 30 min or as appropriate. Stained cells were analyzed on a flow cytometer (LSR; BD Biosciences), and data from ∼100,000 cells were routinely acquired for each sample. Data were analyzed using FlowJo software (Tree Star, Inc.). All data shown are representative of at least three independent experiments.
Statistical analysis
Unless otherwise indicated, all of the values are weighted means, μx, obtained from at least two different dishes in each experiment calculated by the formula
 |
where i is the number of coverslip dishes used in an experiment,  is the mean of fluorescence intensities determined for cells in a single dish, niis the number of cells observed per dish, and σXi is the SD in the measurement. The SEM was determined by the equation
 |
unless another indicator of the spread in the data such as SD was specified. Statistical significance was measured using an unpaired two-tail distribution t test, and the p-values are reported for each case. Each experiment was repeated two or more times with similar results unless otherwise stated.
Online supplemental material
Fig. S1 shows the intracellular distribution and variation in total αBTX levels during internalization. Fig. S2 demonstrates the snapshots from a time series of αBTX carrier movement close to the cell surface or inside the cell. Fig. S3 shows the effect of blocking lysosomal degradation on levels of endocytosed αBTX. Fig. S4 shows the relative intracellular distribution of αBTX with respect to fluid-phase marker or Tf. Videos 1–3 show morphology and movement of the AChR tubule moving away from the TIRF field (Videos 1 and 2) or the movement of these endosomes inside the cell (Video 3). Online supplemental material is available at http://www.jcb.org/cgi/content/full/jcb.200709086/DC1.
Supplementary Material
Acknowledgments
We would like to thank Rahul Chadda and Abhijit Kale (National Centre for Biological Science [NCBS], Bangalore, India) for help with preparing labeled reagents and other members of the Mayor laboratory and NCBS for generous support and encouragement. We acknowledge the Wellcome Trust–aided imaging facility at NCBS under the able supervision of H. Krishnamurthy for help in confocal imaging. We are indebted to the Third World Academy of Sciences for associateships for S. Mayor and F.J. Barrantes and the Company of Biologists for travel grants to V. Borroni, R. Massoi, and B. Chanda. S. Mayor also thanks F.F. Bosphorus and K. Belur for inspiration.
F.J. Barrantes was supported by a 2002 award from the Sarojini Damodaran International Trust. S. Mayor was supported by the Wellcome Trust as an International Senior Research Fellow and by a Swarnajayanti Fellowship from the Department of Science and Technology (India). This work was supported in partnership by grants PICT01-12790 and 5-20155 from the Ministry of Science and Technology, grant PIP367 from the Argentinian Scientific Research Council (CONICET), by Philip Morris USA, Inc. and Philip Morris International, and by grant PGI 24/B135 from Universidad Nacional del Sur (Argentina) to F.J. Barrantes.
S. Kumari and V. Borroni contributed equally to this paper.
A. Chaudhry's present address is Dept. of Immunology, University of Washington School of Medicine, Seattle, WA 98195.
B. Chanda's present address is Dept. of Physiology, University of Wisconsin, Madison, WI 53706.
R. Massol's present address is GI Cell Biology Laboratories, Children's Hospital Boston, Harvard Medical School, Boston, MA 02115.
Abbreviations used in this paper: αBTX, α-bungarotoxin; AChR, acetylcholine receptor; CNS, central nervous system; EEA1, early endosomal antigen 1; GPI, glycosyl-phosphatidylinositol; LAMP, lysosomal-associated membrane protein; NMJ, neuromuscular junction; Pak, p21-associated kinase; PBD, Pak-binding domain; PE, phycoerythrin; SA, streptavidin; Tf, transferrin; TfR, Tf receptor; TIRF, total internal reflection fluorescence.
References
- Akaaboune, M., S.M. Culican, S.G. Turney, and J.W. Lichtman. 1999. Rapid and reversible effects of activity on acetylcholine receptor density at the neuromuscular junction in vivo. Science. 286:503–507. [DOI] [PubMed] [Google Scholar]
- Altschuler, Y., S.M. Barbas, L.J. Terlecky, K. Tang, S. Hardy, K.E. Mostov, and S.L. Schmid. 1998. Redundant and distinct functions for dynamin-1 and dynamin-2 isoforms. J. Cell Biol. 143:1871–1881. [DOI] [PMC free article] [PubMed] [Google Scholar]
- Axelrod, D. 1981. Cell-substrate contacts illuminated by total internal reflection fluorescence. J. Cell Biol. 89:141–145. [DOI] [PMC free article] [PubMed] [Google Scholar]
- Bagrodia, S., S.J. Taylor, C.L. Creasy, J. Chernoff, and R.A. Cerione. 1995. Identification of a mouse p21Cdc42/Rac activated kinase. J. Biol. Chem. 270:22731–22737. [DOI] [PubMed] [Google Scholar]
- Barrantes, F. 1998. Molecular pathology of the acetylcholine receptor. In The Nicotinic Acetylcholine Receptors: Current Views and Future Trends. F.J. Barrantes, editor. Springer-Verlag New York, Inc., New York; and Landes Bioscience, Georgetown, TX. 175–212.
- Benmerah, A., M. Bayrou, N. Cerf-Bensussan, and A. Dautry-Varsat. 1999. Inhibition of clathrin-coated pit assembly by an Eps15 mutant. J. Cell Sci. 112:1303–1311. [DOI] [PubMed] [Google Scholar]
- Blakeslee, D. 1976. The fluorescein-antifluorescein quenching system as a model for assaying changes in antibody function. J. Immunol. Methods. 12:19–29. [DOI] [PubMed] [Google Scholar]
- Borroni, V., C.J. Baier, T. Lang, I. Bonini, M.M. White, I. Garbus, and F.J. Barrantes. 2007. Cholesterol depletion activates rapid internalization of submicron-sized acetylcholine receptor domains at the cell membrane. Mol. Membr. Biol. 24:1–15. [DOI] [PubMed] [Google Scholar]
- Bruneau, E.G., and M. Akaaboune. 2006. The dynamics of recycled acetylcholine receptors at the neuromuscular junction in vivo. Development. 133:4485–4493. [DOI] [PubMed] [Google Scholar]
- Bruneau, E., D. Sutter, R.I. Hume, and M. Akaaboune. 2005. Identification of nicotinic acetylcholine receptor recycling and its role in maintaining receptor density at the neuromuscular junction in vivo. J. Neurosci. 25:9949–9959. [DOI] [PMC free article] [PubMed] [Google Scholar]
- Bursztajn, S., J.L. McManaman, S.B. Elias, and S.H. Appel. 1983. Myasthenic globulin enhances the loss of acetylcholine receptor clusters. Science. 219:195–197. [DOI] [PubMed] [Google Scholar]
- Chaudhry, A., S.R. Das, A. Hussain, S. Mayor, A. George, V. Bal, S. Jameel, and S. Rath. 2005. The Nef protein of HIV-1 induces loss of cell surface costimulatory molecules CD80 and CD86 in APCs. J. Immunol. 175:4566–4574. [DOI] [PubMed] [Google Scholar]
- Chaudhry, A., S.R. Das, S. Jameel, A. George, V. Bal, S. Mayor, and S. Rath. 2007. A two-pronged mechanism for HIV-1 Nef-mediated endocytosis of immune costimulatory molecules CD80 and CD86. Cell Host Microbe. 1:37–49. [DOI] [PubMed] [Google Scholar]
- Clementi, F., and E. Sher. 1985. Antibody induced internalization of acetylcholine nicotinic receptor: kinetics, mechanism and selectivity. Eur. J. Cell Biol. 37:220–228. [PubMed] [Google Scholar]
- Conner, S.D., and S.L. Schmid. 2003. Regulated portals of entry into the cell. Nature. 422:37–44. [DOI] [PubMed] [Google Scholar]
- Damke, H., T. Baba, D.E. Warnock, and S.L. Schmid. 1994. Induction of mutant dynamin specifically blocks endocytic coated vesicle formation. J. Cell Biol. 127:915–934. [DOI] [PMC free article] [PubMed] [Google Scholar]
- Drachman, D.B., C.W. Angus, R.N. Adams, J.D. Michelson, and G.J. Hoffman. 1978. Myasthenic antibodies cross-link acetylcholine receptors to accelerate degradation. N. Engl. J. Med. 298:1116–1122. [DOI] [PubMed] [Google Scholar]
- Ehlers, M.D. 2000. Reinsertion or degradation of AMPA receptors determined by activity-dependent endocytic sorting. Neuron. 28:511–525. [DOI] [PubMed] [Google Scholar]
- Feng, G., J.H. Steinbach, and J.R. Sanes. 1998. Rapsyn clusters neuronal acetylcholine receptors but is inessential for formation of an interneuronal cholinergic synapse. J. Neurosci. 18:4166–4176. [DOI] [PMC free article] [PubMed] [Google Scholar]
- Fujimoto, L.M., R. Roth, J.E. Heuser, and S.L. Schmid. 2000. Actin assembly plays a variable, but not obligatory role in receptor-mediated endocytosis in mammalian cells. Traffic. 1:161–171. [DOI] [PubMed] [Google Scholar]
- Gomez, T.S., M.J. Hamann, S. McCarney, D.N. Savoy, C.M. Lubking, M.P. Heldebrant, C.M. Labno, D.J. McKean, M.A. McNiven, J.K. Burkhardt, and D.D. Billadeau. 2005. Dynamin 2 regulates T cell activation by controlling actin polymerization at the immunological synapse. Nat. Immunol. 6:261–270. [DOI] [PubMed] [Google Scholar]
- Gotti, C., M. Zoli, and F. Clementi. 2006. Brain nicotinic acetylcholine receptors: native subtypes and their relevance. Trends Pharmacol. Sci. 27:482–491. [DOI] [PubMed] [Google Scholar]
- Guha, A., V. Sriram, K.S. Krishnan, and S. Mayor. 2003. Shibire mutations reveal distinct dynamin-independent and -dependent endocytic pathways in primary cultures of Drosophila hemocytes. J. Cell Sci. 116:3373–3386. [DOI] [PubMed] [Google Scholar]
- Hanke, J.H., J.P. Gardner, R.L. Dow, P.S. Changelian, W.H. Brissette, E.J. Weringer, B.A. Pollok, and P.A. Connelly. 1996. Discovery of a novel, potent, and Src family-selective tyrosine kinase inhibitor. Study of Lck- and FynT-dependent T cell activation. J. Biol. Chem. 271:695–701. [DOI] [PubMed] [Google Scholar]
- Herring, D., R. Huang, M. Singh, L.C. Robinson, G.H. Dillon, and N.J. Leidenheimer. 2003. Constitutive GABAA receptor endocytosis is dynamin-mediated and dependent on a dileucine AP2 adaptin-binding motif within the beta 2 subunit of the receptor. J. Biol. Chem. 278:24046–24052. [DOI] [PubMed] [Google Scholar]
- Ibanez-Tallon, I., J.M. Miwa, H.L. Wang, N.C. Adams, G.W. Crabtree, S.M. Sine, and N. Heintz. 2002. Novel modulation of neuronal nicotinic acetylcholine receptors by association with the endogenous prototoxin lynx1. Neuron. 33:893–903. [DOI] [PubMed] [Google Scholar]
- Kalia, M., S. Kumari, R. Chadda, M.M. Hill, R.G. Parton, and S. Mayor. 2006. Arf6-independent GPI-anchored protein-enriched early endosomal compartments fuse with sorting endosomes via a Rab5/phosphatidylinositol-3'-kinase-dependent machinery. Mol. Biol. Cell. 17:3689–3704. [DOI] [PMC free article] [PubMed] [Google Scholar]
- Karlin, A. 2002. Emerging structure of the nicotinic acetylcholine receptors. Nat. Rev. Neurosci. 3:102–114. [DOI] [PubMed] [Google Scholar]
- Kellner, R.R., C.J. Baier, K.I. Willig, S.W. Hell, and F.J. Barrantes. 2007. Nanoscale organization of nicotinic acetylcholine receptors revealed by STED microscopy. Neuroscience. 144:135–143. [DOI] [PubMed] [Google Scholar]
- Kruth, H.S., S.I. Skarlatos, K. Lilly, J. Chang, and I. Ifrim. 1995. Sequestration of acetylated LDL and cholesterol crystals by human monocyte-derived macrophages. J. Cell Biol. 129:133–145. [DOI] [PMC free article] [PubMed] [Google Scholar]
- Lamaze, C., L.M. Fujimoto, H.L. Yin, and S.L. Schmid. 1997. The actin cytoskeleton is required for receptor-mediated endocytosis in mammalian cells. J. Biol. Chem. 272:20332–20335. [DOI] [PubMed] [Google Scholar]
- Libby, P., S. Bursztajn, and A.L. Goldberg. 1980. Degradation of the acetylcholine receptor in cultured muscle cells: selective inhibitors and the fate of undegraded receptors. Cell. 19:481–491. [DOI] [PubMed] [Google Scholar]
- Man, H.Y., J.W. Lin, W.H. Ju, G. Ahmadian, L. Liu, L.E. Becker, M. Sheng, and Y.T. Wang. 2000. Regulation of AMPA receptor-mediated synaptic transmission by clathrin-dependent receptor internalization. Neuron. 25:649–662. [DOI] [PubMed] [Google Scholar]
- Mayor, S., and R.E. Pagano. 2007. Pathways of clathrin-independent endocytosis. Nat. Rev. Mol. Cell Biol. 8:603–612. [DOI] [PMC free article] [PubMed] [Google Scholar]
- Mohamed, A.S., and S.L. Swope. 1999. Phosphorylation and cytoskeletal anchoring of the acetylcholine receptor by Src class protein-tyrosine kinases. Activation by rapsyn. J. Biol. Chem. 274:20529–20539. [DOI] [PubMed] [Google Scholar]
- Myers, J.N., I. Tabas, N.L. Jones, and F.R. Maxfield. 1993. β-very low density lipoprotein is sequestered in surface-connected tubules in mouse peritoneal macrophages. J. Cell Biol. 123:1389–1402. [DOI] [PMC free article] [PubMed] [Google Scholar]
- Nong, Y., Y.Q. Huang, W. Ju, L.V. Kalia, G. Ahmadian, Y.T. Wang, and M.W. Salter. 2003. Glycine binding primes NMDA receptor internalization. Nature. 422:302–307. [DOI] [PubMed] [Google Scholar]
- Parton, R.G., and A.A. Richards. 2003. Lipid rafts and caveolae as portals for endocytosis: new insights and common mechanisms. Traffic. 4:724–738. [DOI] [PubMed] [Google Scholar]
- Roccamo, A.M., M.F. Pediconi, E. Aztiria, L. Zanello, A. Wolstenholme, and F.J. Barrantes. 1999. Cells defective in sphingolipids biosynthesis express low amounts of muscle nicotinic acetylcholine receptor. Eur. J. Neurosci. 11:1615–1623. [DOI] [PubMed] [Google Scholar]
- Sabharanjak, S., P. Sharma, R.G. Parton, and S. Mayor. 2002. GPI-anchored proteins are delivered to recycling endosomes via a distinct cdc42-regulated, clathrin-independent pinocytic pathway. Dev. Cell. 2:411–423. [DOI] [PubMed] [Google Scholar]
- Sadasivam, G., R. Willmann, S. Lin, S. Erb-Vogtli, X.C. Kong, M.A. Ruegg, and C. Fuhrer. 2005. Src-family kinases stabilize the neuromuscular synapse in vivo via protein interactions, phosphorylation, and cytoskeletal linkage of acetylcholine receptors. J. Neurosci. 25:10479–10493. [DOI] [PMC free article] [PubMed] [Google Scholar]
- Salpeter, M.M. 1999. Neurobiology. The constant junction. Science. 286:424–425. [DOI] [PubMed] [Google Scholar]
- Sanes, J.R., and J.W. Lichtman. 1999. Development of the vertebrate neuromuscular junction. Annu. Rev. Neurosci. 22:389–442. [DOI] [PubMed] [Google Scholar]
- Sehr, P., G. Joseph, H. Genth, I. Just, E. Pick, and K. Aktories. 1998. Glucosylation and ADP ribosylation of rho proteins: effects on nucleotide binding, GTPase activity, and effector coupling. Biochemistry. 37:5296–5304. [DOI] [PubMed] [Google Scholar]
- St John, P.A., and H. Gordon. 2001. Agonists cause endocytosis of nicotinic acetylcholine receptors on cultured myotubes. J. Neurobiol. 49:212–223. [DOI] [PubMed] [Google Scholar]
- Stetzkowski-Marden, F., K. Gaus, M. Recouvreur, A. Cartaud, and J. Cartaud. 2006. Agrin elicits membrane lipid condensation at sites of acetylcholine receptor clusters in C2C12 myotubes. J. Lipid Res. 47:2121–2133. [DOI] [PubMed] [Google Scholar]
- Tehrani, M.H., and E.M. Barnes Jr. 1991. Agonist-dependent internalization of gamma-aminobutyric acidA/benzodiazepine receptors in chick cortical neurons. J. Neurochem. 57:1307–1312. [DOI] [PubMed] [Google Scholar]
- Trinidad, J.C., and J.B. Cohen. 2004. Neuregulin inhibits acetylcholine receptor aggregation in myotubes. J. Biol. Chem. 279:31622–31628. [DOI] [PubMed] [Google Scholar]
- Tzartos, S.J., D. Sophianos, K. Zimmerman, and A. Starzinski-Powitz. 1986. Antigenic modulation of human myotube acetylcholine receptor by myasthenic sera. Serum titer determines receptor internalization rate. J. Immunol. 136:3231–3238. [PubMed] [Google Scholar]
- Zhang, W.Y., P.M. Gaynor, and H.S. Kruth. 1997. Aggregated low density lipoprotein induces and enters surface-connected compartments of human monocyte-macrophages. Uptake occurs independently of the low density lipoprotein receptor. J. Biol. Chem. 272:31700–31706. [DOI] [PubMed] [Google Scholar]
Associated Data
This section collects any data citations, data availability statements, or supplementary materials included in this article.