

Abstract
Spatial-angular compounding for elastography is a new technique that enables the reduction of noise artifacts in elastograms. This technique is most effective when the angular strain estimates to be averaged or compounded are uncorrelated. In this paper, we present a theoretical analysis of the correlation between pre- and postcompression radio-frequency echo signals acquired from the same location but at different beam insonification angles. The accuracy of the theoretical results is verified using radio- frequency pre- and postcompression echo signals acquired using a real-time clinical scanner on tissue-mimicking uniformly elastic and homogenous phantoms. The theory predicts an increased signal decorrelation with an increase in the beam-steered insonification angle as the applied strain increases and for increasing depths in the medium. Theoretical results provide useful information regarding the correlation of the angular strain estimates obtained from different beam angles that helps in finding optimum compounding schemes for elastography.
I. Introduction
spatial-angular compounding for strain imaging or elastography was recently introduced by our group [1]-[3] as a method of reducing noise artifacts in elastograms. Here, pre- and postcompression radio-frequency (RF) echo signals are acquired at multiple insonification angles for a unidirectional, quasistatic compression. Angular elastograms estimated at different angles are weighted, then averaged to generate a compounded elastogram. However, to perform efficient spatial angular compounding, it is essential to derive an optimum angular increment to obtain independent angular strain measurements. The most efficient compounding scheme would be to average strain measurements with independent, uncorrelated noise [4]. In our previous work [5], [6], we derived the correlation between pre- and postcompression RF signals acquired from a specific beam angle. In this paper, we follow the framework used in [5], [6] to derive the correlation between precompression RF signals acquired from one beam angle and postcompression RF signals acquired from a different beam angle. The difference between these two angles is referred to as the rotation angle. To corroborate the theoretical development, experimental results using a tissue-mimicking phantom are presented that verify the theoretical expressions derived in this paper. Various factors such as applied strains, center frequency, and aperture size of the transducer that affect the correlation coefficient versus the rotation angle are discussed. The derived expression for the correlation coefficient provides useful information to obtain an optimum scheme for angular compounding techniques in elastography.
II. Theory
The schematic diagram illustrating the acquisition of pre- and postcompression RF signal is shown in Fig. 1. It is assumed that the precompression signals are obtained from scatterers at position O1 with beam steering angle θ1. A quasistatic compression then is applied to the medium along the -z direction. Thus, scatterers around O1 move to position after compression. Here we assume that O1 is at the center of the medium and does not incur any lateral displacement. The postcompression signal arises from scatterers at position O2, which is the projection point of on the ultrasound beam with angle θ2. We establish our coordinates by setting the midpoint of the position of the two transducer’s aperture as the coordinate origin, as shown in Fig. 1. So the center of the aperture for the precompression signals is positioned at A1 (b/2, 0), and the center of the aperture for postcompression signals is positioned at A2 (-b/2, 0). The cross correlation between the signals acquired before and after compression are modeled as follows (similar to that described in (14) in our previous work [5]):
| (1) |
where s1 and s2 denote ultrasonic RF echo signals before and after compression. The subscripts 1 and 2 refer to the pre- and postcompression signals, respectively. B’ is a normalization factor, pz and px represent the axial and lateral beam point-spread functions (PSF), and Δϕ is the phase difference between pre- and postcompression signals, which can be written as 4π (R2 - R1)/λ0, where λ0 is the wavelength at the center frequency, R1 and R2 are the distances from the scatterer to the transducer for the pre- and postcompression situations, respectively:
| (2) |
where a is the strain factor defined in terms of the actual tissue strain ε, a = 1/(1 - ε) ∼ 1 + ε for ε ≪ 1, b is the distance between the two apertures of the transducer given by b = z01(tan θ1 - tan θ2).
Fig. 1.

Schematic of the acquisition of the pre- and postcompression RF signals with beam steering angle θ1 and θ2, respectively. The precompression RF signals come from scatterers at position O1, and the postcompression signals are corresponding to the scatterers at location O2.
The lateral distances from the scatter to the beam axis for pre- and postcompression, respectively, are written as:
| (3) |
Similarly, the axial distances from the scatterer to the center point are written as:
| (4) |
For small beam angles (θ < 10°), sin θ ≪ cos θ, and the sin θ term in (3) and (4) can be ignored. The phase term exp [4πj(R2 - R1)/λ0] is a function of x and z. Because only scatterers close to the point of interest contribute to the signal, we can approximate the phase term as: exp [4πjbx/z01λ0 + 2πjz(1 - a2)/a2λ0]. We then can perform the integral along the lateral and axial direction separately as described by Wagner et al. [7] to obtain (5) (see next page).
Let c1 = cos2 θ1 and c2 = cos2 θ2, and the correlation coefficient is obtained as follows:
| (6) |
where F1 and F2 can be written as:
| (7) |
| (8) |
Here we have assumed that both the axial and lateral PSFs have a Gaussian envelope with characteristic widths σz and σx, respectively [5]:
| (9) |
The effect of the finite window length on the correlation coefficient is considered in the same manner as described in (21) in [5]. Fig. 2 presents a comparison of the theoretical correlation coefficient curves obtained using a numerical integration of (14) in [5] and the approximated expression given by (6)-(8). Correlation coefficient curves are plotted as a function of the rotation angle, which is defined as the difference between θ1 and θ2. We use the following parameter values for the calculations: window length L = 3 mm, transducer aperture D = 3 cm, center frequency fc = 5 MHz with a 50% bandwidth, and z01 = 6 cm. The lateral PSF was approximated using a value of σx = 0.2 mm. The correlation coefficient is calculated for the two different values of the applied percent strain, namely s = 0.5% and 3%. Note that for both applied strain values the approximated curves (dashed lines) are very close to the numerical results (solid lines) at small beam angles (< 10°) as illustrated in Fig. 2. However, the deviation between the exact numerical solution and the closed form solution obtained using the simplifying assumption becomes larger as the insonification angle increases. This result demonstrates that the approximation is accurate only when the beam angle is small, and therefore, it is not applicable for larger insonification angles.
Fig. 2.

Comparison between numerical and approximated results of correlation coefficient curves versus rotation angle at different percent strain compressions of s = 0.5 and 3%, respectively. Depth = 6 cm, L = 3 mm, D = 3 cm, fc = 5 MHz. The transmit focusisat a depth of 6 cm.
| (5) |
III. Experimental Results
To verify the accuracy of the proposed theoretical results, we used experimental RF data to compute the normalized correlation coefficient and compare these results to the theoretical prediction. The experimental setup and parameters are similar to that discussed in our previous work [5], and it is described below. Pre- and postcompression RF data were obtained using a uniformly elastic tissuemimicking (TM) phantom of size 10 × 10 × 10 cm3, manufactured in our laboratory [8]. The phantom was scanned using an Ultrasonix 500RP (Ultrasonix Medical Corporation, Bothell, WA, and Vancouver, BC, Canada) real-time scanner equipped with a 5 MHz linear-array transducer with an approximate 60% bandwidth. Echo signals were acquired, from a 40 × 40 mm2 region of interest (ROI) (starting at a depth of 1 cm under the transducer) for applied strains of 1%. The transducer aperture size is 8 mm, and the transmit focus is at the 3-cm depth. A central location of interest was selected within the scanning plane of the TM phantom, 3-cm away from the transducer face and along the central beam line for the precompression signal at a 0 degree insonification angle. The postcompression echo signal then was selected for each subsequent insonification angle, to lie on the beam line that was closest to the location or point selected on the precompression data segment. A finite-duration rectangular RF data segment of 3 mm (about 10 wavelengths) centered at that point was selected for the postcompression signal. The resultant correlation coefficient curves were averaged and plotted as a function of rotation angle in Fig. 3. The error bars denote the standard deviation of the mean estimates over 10 independent data sets. The theoretical prediction, obtained by calculating (6), is plotted as a dashed line. A good agreement is found between the numerical calculation of the theoretical expression and the experimental result for rotation angles smaller than 6 degrees. The discrepancy between the theoretical prediction and the experimental results for rotation angles larger than 6 degrees is primarily due to the residual correlation present in finite-duration, digitized experimental signals. Here the correlation coefficient is always around 0.4 and does not decrease any further for rotation angles larger than 6 degrees.
Fig. 3.
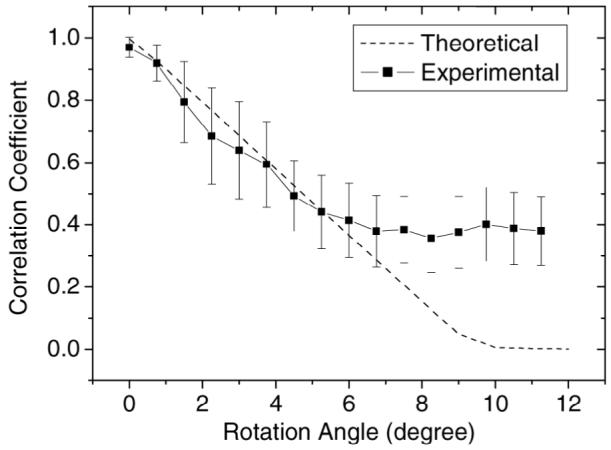
Comparison between theoretical prediction and experimental results of the correlation coefficient between precompression RF segments acquired at 0 degree and postcompression RF segments acquired at different beam angles. L = 3 mm, D = 8 mm.
IV. Discussion
Spatial-angular compounding can significantly reduce noise artifacts in the compounded elastograms, but at the expense of additional processing time required for displacement and strain estimations along the different angular directions. The most efficient compounding approach would be to average independent, uncorrelated angular strain estimates [4]. A clear understanding of the correlation between angular strain estimates, therefore, is essential in finding an optimum angular increment to perform efficient spatial angular compounding. However, it is complicated to estimate the correlation coefficient between the angular strain estimates because they are obtained as the gradient of local displacement estimates. The local displacement estimates are computed using cross-correlation analysis of pre- and postcompression RF signals. Here we use the correlation coefficient between precompression RF signal at the zero degree angle and postcompression RF signal at the different specified angles, to assess the correlation between the angular strain estimates obtained. In this case, the rotation angle is equal to the beam angle from which postcompression RF signals are acquired. In the following paragraphs we will discuss how the rotation angle and other system factors affect the correlation between preand postcompression signals obtained from different beam insonification angles. All the results presented in Figs. 4-6 are theoretical predictions of the correlation coefficient calculated using (6) (using the simplifying assumptions described in Section II).
Fig. 4.

Correlation coefficient versus rotation angle for different values of applied strain (s). Theoretical results are shown for RF segments centered at (a) 3 cm and (b) 6 cm depth with 3 mm length. Dynamic receive aperture with a F-number of 2, fc = 5 MHz.
Fig. 6.

Correlation coefficient versus rotation angle for different D transducer aperture sizes. Theoretical results are obtained using 3-mm RF segments centered at a depth of 3 cm for 1% applied strain, and the insonification frequency is 5 MHz.
Fig. 4 shows the correlation coefficient curves as a function of rotation angle using RF segments obtained at a depth of 3 cm and 6 cm, respectively. Results for applied strain values of 0, 1, 2, and 3% also are compared in Fig. 4. Here the length of RF segments was 3 mm, center frequency of ultrasound beam was 5 MHz, the receive aperture of the transducer was assumed to be dynamically adjusted with an F-number of 2, and the transmit focus was at a depth of 3 cm and 6 cm, respectively. As illustrated in Fig. 4, the decorrelation rate of the RF signal pairs increase with the applied strain. This is easily explained by the fact that, with an increased applied strain or compression, more scatterers would leave the region covered by the ultrasound beam with newer scatterers from surrounding regions entering the beam, leading to the increased decorrelation, as illustrated in Fig. 1. The effect of the depth at which the RF segments are acquired also is observed in Fig. 4. As expected, deeper segments of RF signals decorrelate more rapidly with an increase in the rotation angle. This is due to the geometric location of the scatterers and beam lines before and after compression, as illustrated in Fig. 1. Consider the scatterers that contribute to the precompression RF segment centered at point O1. After compression, these scatterers move to the locations centered at point , which lie outside the postcompression beam width, leading to the increased signal decorrelation. The distance that the scatterers move increases with depth and applied strain. Therefore, the correlation coefficient value decreases rapidly at deeper locations and for larger applied strains. This indicates that smaller angular increments should be chosen when a larger applied strain or compression is used or for angular estimates acquired at deeper locations in the sample.
Fig. 5 shows correlation coefficient versus the rotation angle for different insonification frequencies. These theoretical results are obtained using 3-mm RF segments centered at a depth of 3 cm for 1% applied strain. As illustrated in Fig. 5, the decorrelation of RF signal pairs increases with the center frequency of the transducer. In this situation, the ultrasound beam becomes narrower with an increase in the center frequency leading to an increased number of scatterers moving in and out of the beam in the cross-beam direction with the applied compression. Although an increase in the center frequency would result in more rapid phase changes with changes in rotation angle, the concomitant narrower beam would restrict the scatterers contributing to the ultrasound signal closer to the center point. These two opposite effects cancel, and the major contribution of decorrelation comes from scatterers moving out of beam after compression. Therefore, the angular increment should be smaller when higher center frequency is used during angular compounding for elastography.
Fig. 5.

Plots of the correlation coefficient versus the rotation angle for different transducer center frequencies. Theoretical results are obtained using 3-mm RF segments centered at a depth of 3 cm for 1% applied strain, and the transducer aperture is 1.5 cm.
Fig. 6 plots the theoretical correlation curves for different transducer apertures. The RF segment studied here is again centered at a 3-cm depth with 1% strain, and the segment length is 3 mm. The insonification frequency used is 5 MHz. Note from Fig. 6 that the correlation curve falls off quickly with rotation angle for smaller apertures. At a specified depth, a smaller aperture corresponds to a wider beam. Although fewer scatterers would leave the beam after compression when the beam is wider, more scatterers further away from the center point would contribute to the ultrasound signals that would lead to phase difference between pre- and postcompression RF signals. In a certain range of beam widths, the effect of phase difference between pre- and postcompression RF signals, as illustrated by the second term in (7), is the major contribution of decorrelation between RF signals.
V. Conclusions
We have derived a theoretical expression described in (6) for the decorrelation between pre- and postcompression RF echo signals acquired from different beam angles. This work is based on previous theoretical results derived by Chen et al. [6], in which the analysis of the correlation between RF signal acquired from the same location but at different angles was presented. We extended the analysis to study the combined effect of strain and rotation angle on the correlation of a finite-sized RF echo signal segment. The theoretical prediction closely matches experimental results. This theoretical formulation is useful for optimizing the use of spatial angular compounding in elastography, in which angular strains estimated from echo signals scanned at different beam angles are utilized to perform a weighted averaging to obtain axial strain estimates. These theoretical results also help in optimizing improvements in the axial strain image obtained using least square approaches, in which the axial strain estimates are obtained without assuming tissue incompressibility [9], and for methods that use angular insonifications to obtain normal and shear strain estimates [10], [11].
Acknowledgments
The authors would like to thank Dr. Laurent Pelissier for the loan of the Ultrasonix 500 RP system used on this research.
This work was supported in part by NIH grant R21 EB003853 and Komen grant BCTR0601153.
References
- [1].Techavipoo U, Varghese T. Improvements in elastographic contrast-to-noise ratio using spatial-angular compounding. Ultrasound Med. Biol. 2005;31(4):529–536. doi: 10.1016/j.ultrasmedbio.2005.01.006. [DOI] [PMC free article] [PubMed] [Google Scholar]
- [2].Techavipoo U, Chen Q, Varghese T, Zagzebski JA, Madsen EL. Noise reduction using spatial-angular compounding for elastography. IEEE Trans. Ultrason., Ferroelect., Freq. Contr. 2004;51(5):510–520. [PubMed] [Google Scholar]
- [3].Rao M, Chen Q, Shi H, Varghese T. Spatial-angular compounding for elastography using beam steering on linear array transducers. Med. Phys. 2006;33(3):618–626. doi: 10.1118/1.2168429. [DOI] [PMC free article] [PubMed] [Google Scholar]
- [4].O’Donnell M, Silverstein SD. Optimum displacement for compound image generation in medical ultrasound. IEEE Trans. Ultrason., Ferroelect., Freq. Contr. 1988;35(4):470–476. doi: 10.1109/58.4184. [DOI] [PubMed] [Google Scholar]
- [5].Rao M, Varghese T. Correlation analysis of the beam angle dependence for elastography. J. Acoust.Soc.Amer. 2006;119(6):4093–4101. doi: 10.1121/1.2195290. [DOI] [PMC free article] [PubMed] [Google Scholar]
- [6].Chen Q, Gerig AL, Techavipoo U, Zagzebski J, Varghese T. Correlation of RF signals during angular compounding. IEEE Trans. Ultrason., Ferroelect., Freq. Contr. 2005;52(6):961–970. doi: 10.1109/tuffc.2005.1504018. [DOI] [PMC free article] [PubMed] [Google Scholar]
- [7].Wagner RF, Insana MF, Smith SW. Fundamental correlation lengths of coherent speckle in medical ultrasonic images. IEEE Trans. Ultrason., Ferroelect., Freq. Contr. 1988;35(1):34–44. doi: 10.1109/58.4145. [DOI] [PMC free article] [PubMed] [Google Scholar]
- [8].Madsen EL, Frank GR, Krouskop TA, Varghese T, Kallel F, Ophir J. Tissue-mimicking oil-in-gelatin dispersions for use in heterogeneous elastography phantoms. Ultrason. Imag. 2003;25(1):17–38. doi: 10.1177/016173460302500102. [DOI] [PubMed] [Google Scholar]
- [9].Rao M, Varghese T. Spatial angular compounding for elastography without the incompressibility assumption. Ultrason. Imag. 2005;27(3):256–270. doi: 10.1177/016173460502700404. [DOI] [PMC free article] [PubMed] [Google Scholar]
- [10].Techavipoo U, Chen Q, Varghese T, Zagzebski JA. Estimation of displacement vectors and strain tensors in elastography using angular insonifications. IEEE Trans. Med. Imag. 2004;23(12):1479–1489. doi: 10.1109/TMI.2004.835604. [DOI] [PMC free article] [PubMed] [Google Scholar]
- [11].Rao M, Chen Q, Shi H, Varghese T, Madsen EL, Zagzebski J, Wilson TA. Normal and shear strain estimation using beam steering on linear-array transducers. Ultrasound Med. Biol. 2007;33(1):57–66. doi: 10.1016/j.ultrasmedbio.2006.07.027. [DOI] [PMC free article] [PubMed] [Google Scholar]