Abstract
AGPAT6 is a member of the 1-acylglycerol-3-phosphate O-acyltransferase (AGPAT) family that appears to be important in triglyceride biosynthesis in several tissues, but the precise biochemical function of the enzyme is unknown. In the current study, we show that AGPAT6 is a microsomal glycerol-3-phosphate acyltransferase (GPAT). Membranes from HEK293 cells overexpressing human AGPAT6 had higher levels of GPAT activity. Substrate specificity studies suggested that AGPAT6 was active against both saturated and unsaturated long-chain fatty acyl-CoAs. Both glycerol 3-phosphate and fatty acyl-CoA increased the GPAT activity, and the activity was sensitive to N-ethylmaleimide, a sulfhydryl-modifying reagent. Purified AGPAT6 protein possessed GPAT activity but not AGPAT activity. Using [13C7]oleic acid labeling and mass spectrometry, we found that overexpression of AGPAT6 increased both lysophosphatidic acid and phosphatidic acid levels in cells. In these studies, total triglyceride and phosphatidylcholine levels were not significantly altered, although there were significant changes in the abundance of specific phosphatidylcholine species. Human AGPAT6 is localized to endoplasmic reticulum and is broadly distributed in tissues. Membranes of mammary epithelial cells from Agpat6-deficient mice exhibited markedly reduced GPAT activity compared with membranes from wild-type mice. Reducing AGPAT6 expression in HEK293 cells through small interfering RNA knockdown suggested that AGPAT6 significantly contributed to HEK293 cellular GPAT activity. Our data indicate that AGPAT6 is a microsomal GPAT, and we propose renaming this enzyme GPAT4.
The main glycerolipid biosynthesis pathway uses glycerol 3-phosphate (G3P)2 and fatty acyl-CoA as substrates to produce lysophosphatidic acid (LPA). This reaction is catalyzed by G3P acyltransferases (GPATs). LPA is then converted to phosphatidic acid (PA), which is catalyzed by 1-acylglycerol-3-phosphate O-acyltransferase (AGPAT; also named LPAAT, for LPA acyl-CoA acyltransferase). Dephosphorylation of PA by PA phosphatase generates diacylglycerol (DG), which serves as the substrate for diacylglycerol acyltransferase in the formation of triglycerides (TGs). PA and DG can also enter the phospholipid (PL) biosynthetic pathways, leading to the formation of a variety of PL species.
GPAT is regarded as the rate-limiting enzyme for the G3P biosynthetic pathway (1). In yeast, two genes (GAT1 and GAT2) encode two separate GPAT proteins that share amino acid sequence homology with mammalian mitochondria GPAT (2). Plants have three GPATs, one membrane-bound and the other two located within cytosol and chloroplasts (3). Two GPAT activities exist in most mammalian cells and tissues. One resides in the microsomal fraction, and the other is located within mitochondria (4). The enzyme responsible for mitochondrial GPAT activity was purified, and the cDNA was cloned (5, 6). Mitochondria GPAT (named GPAT1) contains two transmembrane helices and is located in the outer membrane of mitochondria (7). GPAT1 appears to prefer saturated fatty acyl-CoAs as substrates, and its enzymatic activity is resistant to sulfhydryl-modifying agents, such as N-ethylmaleimide (NEM) (4). Overexpression of GPAT1 in primary hepatocytes or in the liver leads to increased TG synthesis and reduced fatty acid oxidation (8, 9). Conversely, mice deficient in GPAT1 exhibit reduced fat mass, lower body weight, reduced hepatic TG content, and improved insulin sensitivity (10, 11). Because residual GPAT activities were observed in mitochondria of Gpat1-deficient mice, it was hypothesized that a second mitochondrial GPAT enzyme must exist (12). That enzyme was recently identified and designated GPAT2 (13).
Mitochondria GPAT activity comprises only 30-50% of total GPAT activity in the liver and about 10% of GPAT activity in most other tissues, suggesting that microsomal GPAT is a major contributor to total GPAT activity (4). The identity of the microsomal GPAT has been elusive, primarily due to the difficulty in purifying the enzyme. Recently, Cao et al. (14) reported the cloning of a microsomal GPAT (named GPAT3) that is induced during adipocyte differentiation. The expression of GPAT3, although high in adipose tissue, is fairly low in other tissues, suggesting the existence of other GPATs (14).
Two AGPAT enzymes have been identified in recent years, followed by the identification of an entire family of putative AGPAT proteins that share amino acid sequence similarities (15, 16). The biochemical roles for most of these proteins, however, are not clear. AGPAT8 was recently identified as GPAT3 (14). Several recent reports indicated that AGPAT9 was a lysophosphatidylcholine acyltransferase (LPCAT1) (17, 18). AGPAT6 is one member of this “AGPAT family,” and its potential physiological role was recently studied using Agpat6-deficient mice (19-21). AGPAT6 is expressed in brown adipose tissue and mammary epithelium as well as many other tissues. A deficiency of AGPAT6 in mice results in resistance to dietinduced and genetic forms of obesity. Brown fat mass was significantly reduced, and DG and TG levels in milk and subdermal fat were reduced by nearly 90% (20, 21). These studies suggest that AGPAT6 has a significant role in lipid biosynthesis. However, the precise biochemical function of AGPAT6 remains unknown. In this study, we identified AGPAT6 as a novel microsomal GPAT and renamed it GPAT4.
EXPERIMENTAL PROCEDURES
Cloning and Expression of AGPAT6—Full-length human AGPAT6 coding sequence (NCBI accession number NM_178819) was amplified by PCR amplification from human Ovary Marathon Ready cDNA (BD Bioscience and Clontech, Palo Alto, CA), and the sequence was subsequently confirmed. A FLAG epitope was inserted in frame at the carboxyl terminus of the protein by PCR-based cloning. The cDNA was digested at HindIII and XbaI sites and subcloned into the mammalian expression vector p3xFLAG-CMV-14 (Sigma). The human GPAT1 cDNA was obtained by PCR amplification from a human full-length cDNA clone TC106982 (Origene Technologies, Rockville, MD). A FLAG epitope was inserted in frame at the carboxyl terminus of the protein by PCR-based cloning. The PCR-amplified segment was digested with EcoRI and BamHI sites and subcloned into the mammalian expression vector p3xFLAG-CMV-14. The human GPAT3 was obtained similarly by PCR amplification of a human Heart Marathon Ready cDNA library (Clontech) followed by restriction digestion with HindIII and BamHI sites and subcloning into the mammalian expression vector p3xFLAG-CMV-14. A FLAG epitope was inserted in-frame at the carboxyl terminus of the protein by PCR-based cloning. The human DGAT1 clone was generated as described (22). HEK293 cells were transiently transfected by using Fugene6 (Roche Applied Science). The cells were washed with PBS and homogenized with three short 10-s pulses from a Brinkmann Polytron homogenizer in 20 mm Tris-HCl, pH 7.4, 250 mm sucrose, 1 mm EDTA and a Protease inhibitor mixture (Roche Applied Science). Total membrane fractions (100,000 × g pellet) were resuspended in a homogenization buffer and frozen at -80 °C until use. Protein concentrations were determined with a Protein Assay Kit (Pierce) with BSA as a standard. Expression of FLAG-tagged AGPAT6, GPAT1, and GPAT3 was verified by immunoblot analysis with anti-FLAG M2 antibody (Sigma).
Purification of AGPAT6—Two liters of HEK293E suspension cells were transfected with plasmids encoding a FLAG-tagged human AGPAT6. The cells were harvested at 42 h post-transfection and homogenized with five short 30-s pulses from a Brinkmann Polytron homogenizer in 30 ml of buffer A (20 mm Tris-HCl, pH 7.5, 1 mm EDTA, 250 mm sucrose) containing a protease inhibitor mixture (Roche Applied Science) and centrifuged at 600 × g for 5 min to remove large debris and nuclei. Mitochondria fraction was removed by centrifuging the supernatant at 10,300 × g for 10 min. The microsomal fraction was acquired by centrifuging the supernatant for 1 h at 100,000 × g and solubilized in buffer B (20 mm Tris-HCl, pH 7.5, 1 mm EDTA, 250 mm sucrose, 150 mm NaCl, 0.2% Tween 20) on ice for 1 h. AGPAT6 in the soluble fraction was purified by anti-FLAG M2 affinity chromatography and eluted with buffer B containing 0.3 mg/ml 3× FLAG peptide according to the manufacturer's instructions (Sigma). The identity of the purified protein was confirmed by anti-FLAG M2 immunoblot analysis and peptide sequencing.
siRNA Transfection—200 pmol of human GPAM siRNA (siRNA ID number 112114; Ambion, Austin, TX), human GPAT4 siRNA (siRNA ID number J-010300-11; Dharmacon, Lafayette, CO), and control siRNA (silencer negative control 1; Ambion) were transfected using Lipofectamine 2000 (Invitrogen) according to the manufacturer's protocol. The RNAs of the transfected cells were prepared for reverse transcription and real time PCR 2 days after the siRNA transfection. 5 μg of membrane proteins from the transfected cells were used for the in vitro GPAT activity assay.
In Vitro Acyltransferase Assay—GPAT activity was determined in a final volume of 100 μl as previously described with some modifications (12, 14). The assay was conducted in 75 mm Tris-HCl, pH 7.5, 4 mm MgCl2, 1 mm dithiothreitol, 4 mm NaF, 1 mg/ml fatty acid-free BSA with 80 μm [14C]G3P (55 mCi/mmol) (American Radiolabeled Chemicals, St. Louis, MO) and 20 μm fatty acyl-CoA (lauroyl-CoA (C12:0), palmitoyl-CoA (C16:0), stearoyl-CoA (C18:0), oleoyl-CoA (C18:1), linoleoyl-CoA (C18:2), and arachidonoyl-CoA (C20:4) (Sigma)) or 20 μm [14C]fatty acyl-CoA ([14C]lauroyl-CoA (55 mCi/mmol) or [14C]palmitoyl-CoA (50 mCi/mmol)) and 200 μm G3P as substrates. The reaction was initiated by adding 5 μg of membrane proteins. All assays were performed for 20 min at room temperature unless indicated. Lipids were extracted with chloroform/methanol (2:1, v/v), dried, and separated by TLC with chloroform/methanol/water (65:25:4) followed by exposure to a PhosphorImager screen. Where indicated, membrane proteins were incubated with or without 0.1, 0.5, or 50 μm NEM for 15 min on ice before the initiation of the reaction. Acyltransferase activity with LPA, lysophosphatidylcholine, lysophosphatidylserine, lysophosphatidylglycerol, lysophosphatidylethanolamine, and DAG substrates was assayed with 20 μm [14C]oleoyl-CoA (55 mCi/mmol) and 200 μm acyl acceptors as described (14). All experiments were performed at least three times.
Metabolic Labeling Studies—HEK293 cells (40 h after transfection) were incubated with 2 μm [14C]oleic acid (54 mCi/mmol) in medium supplemented with 0.2% fatty acid-free BSA for 6 or 20 h. Cells were washed twice with cold PBS, and total lipids were extracted with chloroform/methanol (2:1). Lipids were resolved by TLC with chloroform/methanol/water (65: 25:4, polar lipids) or hexane/ethyl ethanol/acetic acid (80:20:1, neutral lipids) and visualized with a PhosphorImager. For metabolic labeling followed by LC/MS studies, 40 h after transfection, HEK293 cells were incubated with 30 μm [1,2,3,7,8,9,10-13C7]oleic acid (Sigma) in medium supplemented with 1% fatty acid-free BSA for 3 or 6 h. Cells were then washed twice with cold PBS, and total lipids were extracted and analyzed by TLC.
LPA and PA Measurement by LC/MS—LPAs (LPA C14:0, LPA C16:0, LPA C17:0, LPA C18:1, and LPA C18:0) and diacylphosphatidic acids (PA C16:0, C16:0, PA C17:0, C17:0, PA C18:0, C18:0, PA C16:0, C18:1, PA C18:0, C18:1, and PA C18:1, C18:1) were purchased from Avanti Polar Lipids (Alabaster, AL). Stock standard solutions of each of the LPAs, PAs, and internal standards (LPA C17:0 and PA C17:0, C17:0, 50 ng/ml) were prepared in MeOH/water (80:20) containing 0.1% diethyl amine. Calibration standard solutions were prepared at concentrations ranging from 5 to 250 ng/ml. The high performance liquid chromatography (HPLC) system consisted of an Agilent 1100 binary pump (Palo Alto, CA), a CTC Leap Technologies HTS PAL Autosampler (Carrboro, NC) equipped with a 100-μl syringe, a Valco C6WK injector (Houston, TX), and a 10-μl sample loop. The analytical column was an Xbridge C8 (2.1 × 30 mm, 3.5 μm; Waters). The injection volume was 10 μl. The HPLC mobile phases consisted of methanol/chloroform/water (55:5:40) with 0.1% diethyl amine (A) and methanol/chloroform (50:50) with 0.1% diethyl amine (B). A gradient program was set for the separation at a flow rate of 1 ml/min. The initial mobile phase was 100% and then linearly changed to 80% B at 0.5 min and then slowly changed to 100% of B at 0.2 min and maintained for 0.8 min, followed by re-equilibration to initial conditions for 0.5 min. Each run time was 2 min. The HPLC system was coupled on-line to a TSQ Quantum triple quadrupole mass spectrometer (Waters). Electrospray ionization (ESI) was performed in the negative mode with an ion spray voltage of 3.3 kV. Cone gas flow and desolvation gas flow were 37 and 697 liters/h, respectively. The heated nebulizer temperature was set at 300 °C, and the source temperature was 130 °C. The mass spectrometer operated with LM1, HM1, LM2, and HM2 resolution at 13.5. Multiple reaction monitoring detection for LPA and PA was used for quantitation with a dwell time of 20 ms for each transition.
PC Measurement by LC/MS—Cell pellets were suspended in 1 ml of methanol, and 200 μl was removed for ceramide analysis. The remaining 800 μl was added to 5 nmol of C14:0, C14:0PC, 5 nmol of C21:0, C21:0PC, 5 nmol of C17:0SM, 10 nmol of d5-tripalmitin, and 10 nmol of d5-tristearin internal standards prior to extraction. 1.0 ml of chloroform was added to the 800-μl aliquot of cell pellets, and the sample was vortexed prior to transferring to a 4-ml screw cap vial. Water (400 μl) was added to the extract, and the sample was vortexed and centrifuged for 10 min at 4000 rpm. The lower layer was carefully removed. 50 μl of 5 n HCl and 1 ml of chloroform were added to the remaining aqueous layer, and the extraction process was repeated. The lower chloroform layers from both extractions were combined and evaporated in a second 4-ml vial. The lipids were reconstituted in 1.0 ml of methanol/chloroform (1:1). A 500-μl aliquot was evaporated and reconstituted in 500 μl of methanol/chloroform (3:1) with 10 mm ammonium acetate. 10 μl of the sample was analyzed in duplicate for PC/SM. After the PC/SM analysis, the sample was evaporated and reconstituted in 200 μl of methanol/chloroform (3:1) with 10 mm ammonium acetate for TG analysis. PC levels were measured via a flow injection ESI-MS/MS method, adapted from the method of Schmitz and co-workers (23), suitable for rapid monitoring of PC and SM at μmol/liter to mmol/liter levels. Protonated molecular ions of PC/SM species were selected by precursor ion scans of m/z 184, the fragment ion containing the charged phosphatidylcholine head group. The ion intensities across the flow injection profile were summed, and after isotope correction, the quantities of each PC/SM species were calculated relative to PC and SM internal standards.
TG Analysis by LC/MS—TG species containing C18:0, C18:1, and 13C7-C18:1 fatty acids were identified by flow injection ESI and MS/MS scans for ions as results of neutral loss of fatty acid and ammonia from the (M + NH4)+ molecular ions (24, 25). The amount of each TG was calculated from analyte to internal standard ratios and the concentration of d5-(C18:0)3 TG internal standard (Avanti Polar Lipids). For TG analysis, aliquots of the various cell extracts were diluted into the spray solvent (5 μm ammonium acetate in isopropyl alcohol/methanol/chloroform: 4:2:1). The sample was vortexed and centrifuged and then transferred to the nanoinfusion device. Cells were extracted in the presence of isotopically labeled internal standards of TG. Data were acquired on an LTQ FT equipped with a 7-tesla magnet (Thermo Electron Corp., San Jose, CA). ESI was accomplished with the Advion (Ithaca, NY) Triversa Nanomate nanoinfusion device. The 4.2-μm chip was held at 1.3 kV with 0.2 p.s.i. back-pressure of nitrogen. Product ion scans were acquired with a collision value of 28% with no ramping of the values. The heated capillary was held at about 150 °C. Xcalibur version 2.0 for the LTQ FT was used to generate the scan functions in these experiments. Data were acquired with the LTQ portion of the hybrid. The scan function was accomplished with the inclusion list feature, which commanded the mass spectrometer to generate product ions in a sequential fashion, starting at m/z 250 through m/z 1000. Each product ion event consists of two scans, each scan consisting of two separate scan events. Thus, in the roughly 1.2 s of acquisition, four scans were acquired for each precursor mass. A single acquisition results in 750 individual product ion events. This approach allowed the use of native quantitation software to produce ratios with the internal standards. This was accomplished using peak heights. Thus, for this study, the product ion of d5 C16 TG internal standard was chosen as the reference peak (m/z 556.7). This ion was used to normalize the TG product ions that contained either the [13C7]oleic acid side chain or the normal unlabeled product ions.
Human AGPAT6 Subcellular Localization—COS-7 cells were grown and transfected with FLAG-tagged human AGPAT6 on glass bottom culture dishes (P35GC; MetTek Corp., Ashland, MA). To achieve mitochondrial staining, cells were incubated with 100 nm MitoTracker Orange CMTMRos (Invitrogen) for 10 min at 37 °C. The cells were then washed twice with PBS and fixed with 4.0% paraformaldehyde prewarmed for 20 min at 37 °C. The samples were rinsed twice with PBS and permeabilized with 0.2% Triton X-100 in PBS. The samples were then incubated for 2 h at room temperature with mouse monoclonal anti-FLAG M2 antibody (5.0 μg/ml; Sigma) or rabbit anti-calnexin N-terminal polyclonal antibody (1.0 μg/ml; StressGen Biotechnologies Corp., Victoria, Canada) in PBS with 1% BSA. After briefly washing with PBS, the samples were incubated for 1 h at room temperature with Alexa Fluor 488 goat anti-mouse SFX or Alexa Fluor 555 goat anti-rabbit SFX (Invitrogen). The cells were counterstained with propidium iodide nucleic acid stain (Invitrogen) in PBS. The samples were analyzed with a confocal fluorescence microscope (Olympus BX61; Nashua, NH).
Quantitative PCR Analysis of Human AGPAT6—Human normal tissue cDNA panels were obtained from BioChain (Hayward, CA) and PrimGen (Bothell, WA). TaqMan real time quantitative PCR was performed with an ABI Prism 7900 sequence detector (Applied Biosystems, Foster City, CA) with glyceraldehyde-3-phosphate dehydrogenase as an internal control. Gene-specific primers and probes were obtained from Applied Biosystems. The relative expression of the genes was determined by the Ct method (Applied Biosystems).
Analysis of Tissue GPAT Activity—Total membranes from mammary epithelial cells were prepared as follows. The mammary glands were dissected from 2-day lactating female mice under ketamine/xylazine anesthesia. Mammary glands were pooled, minced with a razor blade, and digested in 0.2% trypsin/collagenase for 30 min in a 37 °C shaker. Adipocytes were eliminated by two rounds of low speed centrifugation (1500 rpm for 10 min), and the remaining pellet containing epithelial cells was treated with AKC buffer (8.3 mg/ml NH4Cl, 1 mg/ml KHCO3, 36 μg/ml EDTA, pH 7.4) to lyse red blood cells. The cell suspension was then filtered through a 250-μm nylon mesh. Epithelial cells were pelleted by centrifugation at 1500 rpm and resuspended in homogenization buffer (10 mm Tris, pH 7.4, 1 mm EDTA, 250 mm sucrose, 50 mm NaF, 30 mm Na4P2O7, 100 μm Na3VO4, 1 mm dithiothreitol). Cells were disrupted by sonication, and the cell lysate was cleared by low speed centrifugation (500 × g for 10 min at 4 °C). Total membrane fractions were obtained by ultracentrifugation (90,000 rpm for 1 h at 4°C) and then resuspended in 10 mm Tris, pH 7.4, 1 mm EDTA, 250 mm sucrose, and 1 mm dithiothreitol. 5 μg of membrane proteins from wild-type or Agpat6-deficient mice were used for GPAT activity analyses as described above.
RESULTS
Identification of GPAT Activity for AGPAT6—To identify potential microsomal GPATs, we searched the data bases for proteins containing acyl-CoA glycerolipid acyltransferase motifs. Candidate clones were overexpressed in human embryonic kidney 293 (HEK293) cells. After transfection, membranes were prepared, and GPAT activity was assessed with TLC. Membranes from AGPAT6-expressing cells yielded substantial GPAT activity, and this enzyme was chosen for further analysis.
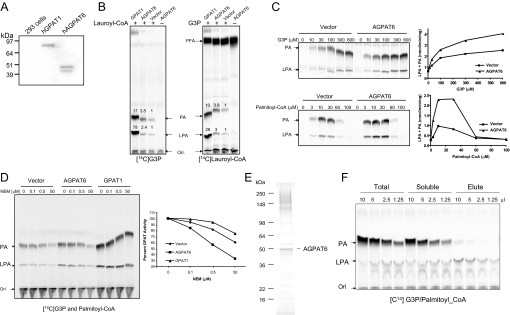
Human AGPAT6 is 456 amino acids in length and is predicted to contain multiple transmembrane helices (19). Western blots of HEK293 cells transfected with a tagged AGPAT6 expressed a 48-kDa AGPAT protein (Fig. 1A), consistent with the size of mouse AGPAT6 (20). Aside from the 48-kDa protein, a smaller protein was visible in transfected cells, presumably a breakdown product. In labeling experiments involving membranes from transfected cells and either radiolabeled lauroyl-CoA or G3P, we found that AGPAT6 expression yielded GPAT activity (Fig. 1B), as judged by higher levels of LPA and PA (Fig. 1B). The increase of PA levels probably results from endogenous AGPAT activities in HEK293 cells, since no increase in AGPAT activity was conferred by AGPAT6 overexpression (see Figs. 1, E and F, and 2B). Omitting fatty acyl-CoA from the reaction eliminated LPA and PA synthesis. Increasing either fatty acyl-CoA or G3P substrate concentrations resulted in a concentration-dependent increase in LPA and PA products (except with high concentrations of palmitoyl-CoA (>30 μm), where low levels of activity could have been due to a detergent effect) (Fig. 1C). Microsomal GPAT activity is sensitive to inhibition by sulfhydryl-modifying agents (4), such as NEM. As shown in Fig. 1D, the GPAT activity from AGPAT6-expressing cells was inhibited by NEM, whereas mitochondrial GPAT1 activity was minimally affected. To pinpoint the GPAT activity of AGPAT6, we expressed the FLAG-tagged human AGPAT6 in HEK293 cells and affinity-purified the protein (Fig. 1E). The identity of the purified enzyme was confirmed with Western blot analysis and peptide sequencing (data not shown). Assessment of the GPAT activity of this purified fraction in comparison with total and soluble fractions before the purification indicated that purified AGPAT6 protein had only GPAT activity and no AGPAT activity (Fig. 1F). Based on these experiments, we propose that AGPAT6 be renamed GPAT4 (after mitochondrial GPAT1, mitochondrial GPAT2, and microsomal GPAT3) (26).
FIGURE 1.
Identification and characterization of GPAT activity. A, expression of human AGPAT6 (GPAT4) and GPAT1 expression in HEK293 cells. GPAT4 or GPAT1 was expressed with a C-terminal FLAG tag in HEK293 cells. Cell extracts were resolved in SDS-PAGE followed by Western blot analysis with anti-FLAG antibody. B, GPAT activity analyzed by TLC with either [14C]G3P (left) or [14C]lauroyl-CoA (right). Membranes were prepared from control HEK293 cells or cells overexpressing AGPAT6 (GPAT4), and the GPAT assay was carried out as described under “Experimental Procedures.” The numbers represent the relative levels of radiolabeled LPA and PA products. Ori, origin of migration; FFA, free fatty acid. C, dependence of GPAT activity on substrate concentration. GPAT assays were conducted with HEK293 cell membranes at the indicated concentrations of G3P or palmitoyl-CoA in the presence of 20 μm [14C]palmitoyl-CoA or [14C]G3P, respectively. Representative TLC images indicating the formation of LPA and PA are shown on the left, and the quantitative assessment of relative GPAT activities is shown on the right. D, GPAT activity conferred by GPAT4 is sensitive to NEM. Enzymatic activity was analyzed with the membrane proteins from HEK293 cells transfected with vector, GPAT4 (AGPAT6), or GPAT1 with increasing concentrations of NEM. A representative TLC image indicating the formation of LPA/PA is shown on the left, and the quantitative assessment of GPAT activity sensitivity to NEM inhibition is shown on the right. E, FLAG tag affinity-purified human AGPAT6. Human AGPAT6 was expressed in HEK293 cells and purified as described under “Experimental Procedures.” Purified FLAG-tagged AGPAT6 was analyzed by SDS-PAGE and stained with SimplyBlue SafeStain. F, purified AGPAT6 has GPAT activity but no AGPAT activity. GPAT activity was assessed using different volumes of proteins from total microsomal, soluble, and elute fractions as described under “Experimental Procedures.” The respective protein concentrations of total, soluble, and elute fractions were 3.6, 2.9, and 0.5 mg/ml.
FIGURE 2.
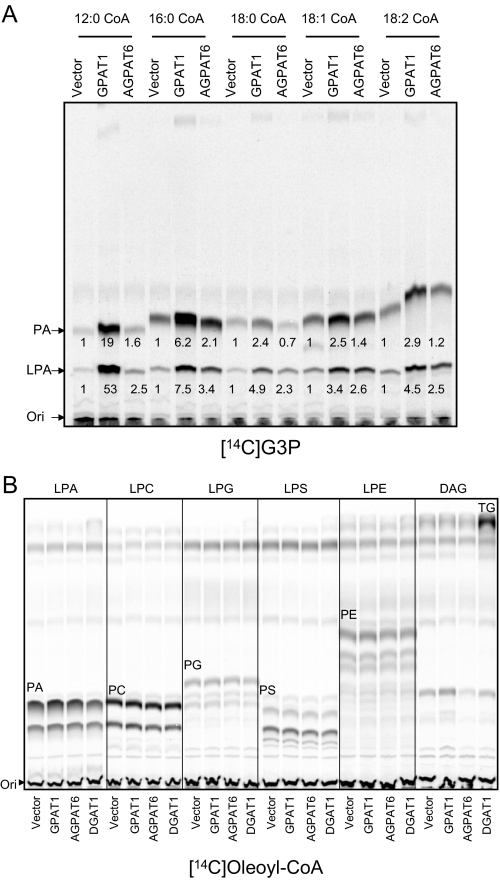
Substrate specificity of GPAT4. A, GPAT activity with different fatty acyl-CoA species as substrates. Lauroyl-CoA (C12:0), palmitoyl-CoA (C16: 0), stearoyl-CoA (C18:0), oleoyl-CoA (C18:1), linoleoyl-CoA (C18:2), and arachidonoyl-CoA (C20:4) were used as acyl-donors, and the GPAT assay was performed as in Fig. 1B. Data are representative of two independent experiments. B, GPAT4 did not have enzymatic activities of other glycerolipid acyltransferases. Different glycerolipids were used as acyl acceptors to examine any other potential glycerolipid acyltransferase activities for AGPAT6. PG, phosphatidylglycerol; PS, phosphatidylserine. Data are representative of two independent experiments.
To characterize the fatty acyl-CoA substrate specificity, we incubated membranes with different fatty acyl-CoAs (Fig. 2A). GPAT1, as expected, showed activity with C12:0, C16:0, and C18:0 as well as C18:1 and C18:2, with some preference for shorter saturated fatty acyl-CoAs. AGPAT6 (GPAT4) was active toward C12:0, C16:0, C18:1, and C18:2, but the activity toward C18:0 was low. To determine if GPAT4 had any additional glycerolipid acyltransferase activities, we used LPA, LPC, LPE, LPS, LPG, or DG as substrates and assessed potential activities by TLC. No other enzymatic activity was observed, suggesting that its GPAT activity was specific (Fig. 2B).
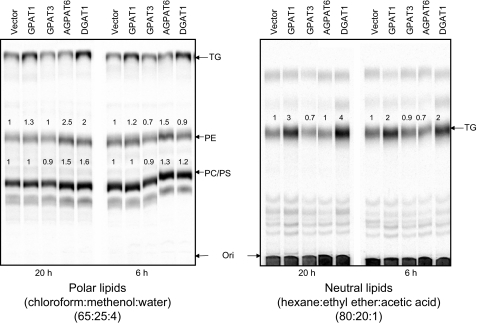
Effects on TG and PC Synthesis When GPAT4 Is Overexpressed in HEK293 Cells—To assess the impact of GPAT4 on TG and PL biosynthetic pathways, we overexpressed GPAT4 in HEK293 cells and then labeled the cells with [14C]oleic acid. After incubation, the lipids were extracted and subjected to TLC analysis (Fig. 3). Surprisingly, GPAT4 failed to increase TG synthesis at either the 6 or 20 h time points, whereas both GPAT1 and DGAT1 increased TG synthesis. In these assays, GPAT3 also did not increase TG production (Fig. 3). GPAT4 overexpression did not appear to induce higher levels of PC synthesis, although there appeared to be higher levels of phosphatidylethanolamine (PE) (Fig. 3).
FIGURE 3.
Overexpression of GPAT4 in mammalian cells did not lead to increased incorporation of [14C]oleic acid into TG. Metabolic labeling studies were performed in HEK293 cells overexpressing human GPAT4, human GPAT3, human DGAT1, or human GPAT1 as described under “Experimental Procedures.” Left, TLC analysis of polar lipids; right, TLC analysis of neutral lipids. The number below each band represents band intensity relative to vector control (which was arbitrarily assigned a value of 1). Data were representative of two independent experiments. PE, phosphatidylethanolamine; PS, phosphatidylserine.
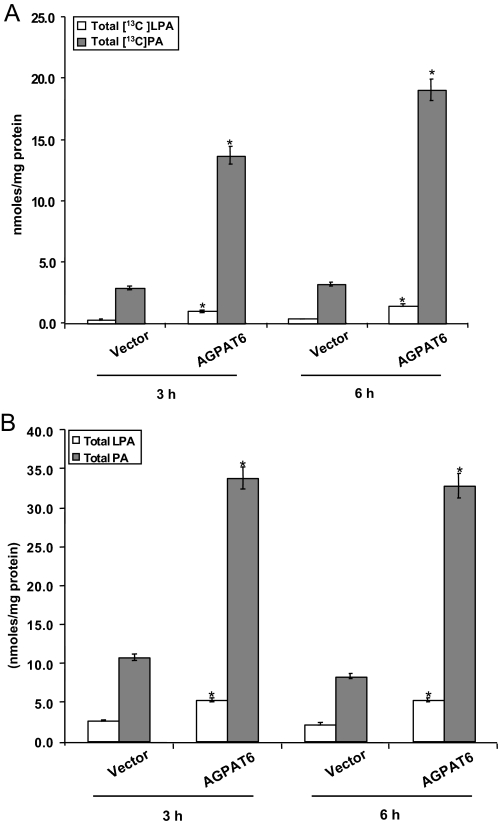
To further assess GPAT4 activity in live cells, we overexpressed GPAT4 in HEK293 cells and labeled the cells with [13C7]oleic acid. At 3 or 6 h time points, 13C7-labeled cellular LPA, PA, TG, and PC were analyzed by LC/MS. Total LPA, PA, and PC were also examined. Fig. 4A shows that 13C7-labeled LPA was increased at the 3 and 6 h time points by 3.5- and 4.1-fold, respectively, whereas total labeled PA was increased by 4.8- and 6.0-fold, respectively. Measurements of total LPA and PA indicated significant increases in both LPA (1.9- and 2.4-fold) and PA (3.2- and 4.0-fold) at the two time points (Fig. 4B). These data confirm the studies with membrane fractions and indicate that AGPAT6 possesses GPAT activity. Differences in 13C7-labeled LPA and PA species are shown in Table 1; differences in total LPA and PA are shown in Tables 2 and 3, respectively.
FIGURE 4.
GPAT activity for AGPAT6 (GPAT4). Lipids from either control HEK293 cells or cells expressing AGPAT6 (GPAT4) (in triplicate) were extracted 3 or 6 h after incubation with a 13C7-labeled oleic acid. LPA and PA levels were analyzed by LC/MS as described under “Experimental Procedures.” A, levels of LPA and PA containing the 13C7-labeled oleic acid. B, total LPA and PA levels. *, p < 0.05.
TABLE 1.
Differences in 13C7-labeled LPA and PA species between AGPAT6 (GPAT4)-transfected and vector-transfected cells 3 and 6 h after incubating cells with 13C7-labeled oleic acid
| Time | Sample | [13C7]LPA (C18:1) | [13C7]PA (C16:0, C18:1) | [13C7]PA (C18:0, C18:1) | [13C7]PA (C18:1, C18:1) | [13C14]PA (C18:1, C18:1) | Total [13C]LPA | Total [13C]PA |
|---|---|---|---|---|---|---|---|---|
| nmol/mg | nmol/mg | nmol/mg | nmol/mg | nmol/mg | nmol/mg | nmol/mg | ||
| 3 h | Vector | 0.27 ± 0.03 | 1.12 ± 0.08 | 0.26 ± 0.02 | 0.06 ± 0.05 | 0.87 ± 0.06 | 0.27 ± 0.03 | 2.87 ± 0.12 |
| AGPAT6 | 0.97 ± 0.07 | 7.95 ± 0.60 | 0.76 ± 0.05 | 1.33 ± 0.09 | 3.65 ± 0.30 | 0.97 ± 0.07 | 13.7 ± 0.68 | |
| 6 h | Vector | 0.35 ± 0.02 | 1.26 ± 0.09 | 0.31 ± 0.02 | 0.78 ± 0.06 | 0.80 ± 0.06 | 0.35 ± 0.02 | 3.17 ± 0.13 |
| AGPAT6 | 1.44 ± 0.10 | 11.7 ± 0.82 | 0.84 ± 0.06 | 2.66 ± 0.19 | 3.77 ± 0.26 | 1.44 ± 0.10 | 19.0 ± 0.89 |
TABLE 2.
Differences in total LPA species between AGPAT6 (GPAT4)-transfected and vector-transfected cells 3 and 6 h after incubating cells with 13C7-labeled oleic acid
| Time | Sample | LPA (C14:0) | LPA (C16:0) | LPA (C18:1) | LPA (C18:0) | Total LPA |
|---|---|---|---|---|---|---|
| nmol/mg | nmol/mg | nmol/mg | nmol/mg | nmol/mg | ||
| 3 h | Vector | 0.144 ± 0.012 | 0.79 ± 0.06 | 1.22 ± 0.09 | 0.437 ± 0.036 | 2.59 ± 0.12 |
| AGPAT6 | 0.295 ± 0.021 | 2.86 ± 0.20 | 1.30 ± 0.10 | 0.838 ± 0.070 | 5.30 ± 0.24 | |
| 6 h | Vector | 0.161 ± 0.013 | 0.64 ± 0.06 | 0.97 ± 0.09 | 0.392 ± 0.029 | 2.16 ± 0.11 |
| AGPAT6 | 0.313 ± 0.022 | 2.70 ± 0.19 | 1.42 ± 0.12 | 0.855 ± 0.068 | 5.29 ± 0.24 |
TABLE 3.
Differences in total PA species between AGPAT6 (GPAT4)-transfected and vector-transfected cells 3 and 6 h after incubating cells with 13C7-labeled oleic acid
| Time | Sample | PA (C16:0, C16:0) | PA (C18:0, C18:0) | PA (C16:0, C18:1) | PA (C18:0, C18:1) | PA (C18:1, C18:1) | Total PA |
|---|---|---|---|---|---|---|---|
| nmol/mg | nmol/mg | nmol/mg | nmol/mg | nmol/mg | nmol/mg | ||
| 3 h | Vector | 0.90 ± 0.06 | 0.128 ± 0.009 | 4.21 ± 0.29 | 3.48 ± 0.27 | 1.99 ± 0.15 | 10.7 ± 0.43 |
| AGPAT6 | 17.4 ± 1.21 | 0.324 ± 0.025 | 8.78 ± 0.67 | 4.51 ± 0.33 | 2.80 ± 0.23 | 33.8 ± 1.44 | |
| 6 h | Vector | 0.89 ± 0.06 | 0.107 ± 0.010 | 2.94 ± 0.28 | 2.30 ± 0.16 | 2.05 ± 0.14 | 8.30 ± 0.36 |
| AGPAT6 | 14.3 ± 1.19 | 0.414 ± 0.033 | 8.59 ± 0.77 | 5.67 ± 0.41 | 3.75 ± 0.30 | 32.8 ± 1.51 |
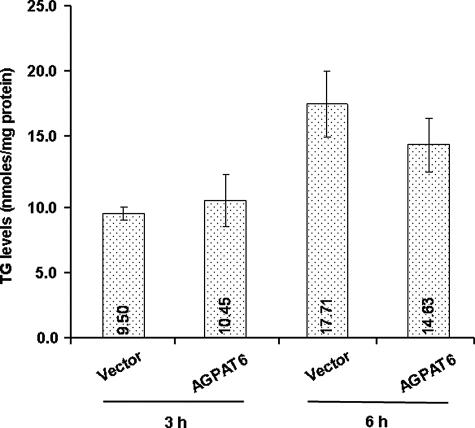
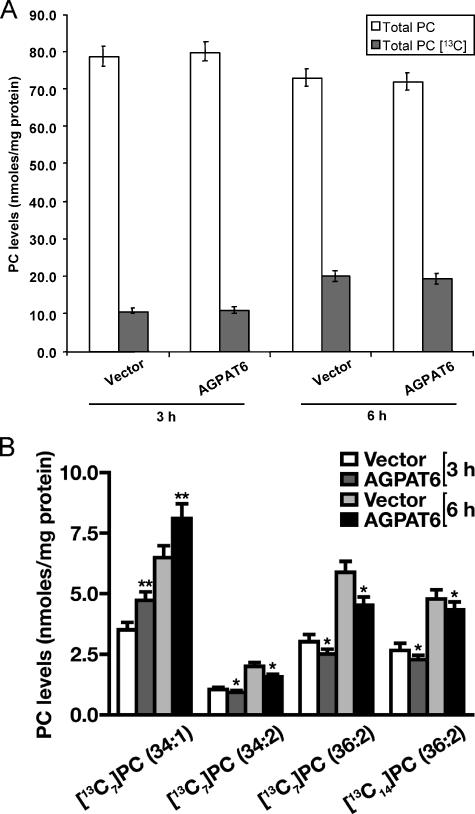
The 13C7-labeled and total TG and PC levels were analyzed by mass spectrometry. Total labeled TG did not appear to be changed by AGPAT6 (GPAT4) expression (Fig. 5), but there was a slight increase in C50 TGs and a slight reduction in C54 TGs (not shown). The total PC level also did not change (Fig. 6A). However, when PC species were analyzed in detail, we found increases in 13C7-labeled PC 34:1 at 3 and 6 h (p < 0.0001), whereas levels of labeled PC 34:2 and 36:2 PC were reduced (p < 0.05) (Fig. 6B). Thus, AGPAT6 (GPAT4) overexpression in HEK293 cells appeared to alter the relative abundance of certain PC species.
FIGURE 5.
Cellular TG synthesis. 13C7-Labeled TG levels were analyzed with LC/MS. TGs containing the 13C7-labeled oleic acid label were measured after 3 and 6 h, as described under “Experimental Procedures.”
FIGURE 6.
Cellular PC synthesis. Total PC was analyzed with the LC/MS method as described. A,[13C7]oleic acid-labeled PC and total PC was measured after 3 or 6 h. B,[13C7]oleic acid incorporation into specific PC species. *, p < 0.05; **, p < 0.0001.
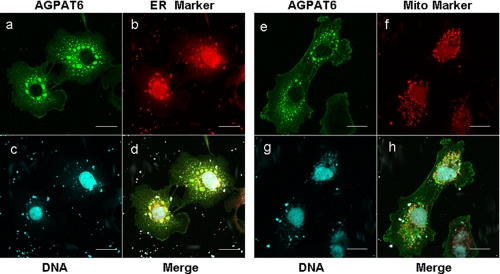
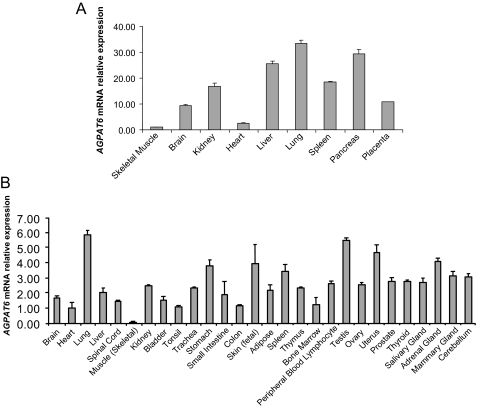
Subcellular Localization and the Tissue Distribution of Human GPAT4—Mouse AGPAT6 was shown to be located within the endoplasmic reticulum (20), but differences between mouse and human glycerolipid acyltransferases have been reported (17, 18, 27). Thus, we performed experiments to define the location of human AGPAT6 (GPAT4). Fig. 7 shows that human AGPAT6 (GPAT4) colocalized with calnexin (an endoplasmic reticulum marker), whereas there was no overlapping staining with a mitochondria marker. The tissue distribution of human AGPAT6 (GPAT4) was analyzed by quantitative real time PCR (Fig. 8, A and B). AGPAT6 (GPAT4) was ubiquitously expressed, but there were low expression levels in skeletal muscle.
FIGURE 7.
Human AGPAT6 is located in the endoplasmic reticulum. COS-7 cells overexpressing FLAG-tagged hGPAT4 was visualized by immunofluorescence microscopy with anti-FLAG antibody (a and e). Endoplasmic reticulum and mitochondria were visualized by staining with Alexa Fluor 555 goat anti-rabbit SFX antibody specific for calnexin (b) and MitoTracker Orange CMTMRos (f), respectively. d and h represent the merged images of a with b and e with f, respectively. c and g show nuclear staining. Scale bar, 20 μm.
FIGURE 8.
Tissue distribution of human GPAT4. Quantitative PCR analysis was performed as described under “Experimental Procedures” using human normal tissue cDNA panel obtained from BioChain (A) or PrimGen (B). Data were expressed as mean ± S.D. (n = 3).
Reduced GPAT Activity in Mammary Epithelial Membranes from Agpat6 Knock-out Mice—The alveoli and ducts of mammary glands of Agpat6 knock-out mice had reduced amounts of fat droplets. We compared GPAT activity in membranes from mammary epithelial cells of lactating Agpat6 knock-out mice and lactating littermate wild-type mice. As shown in Fig. 9, LPA and PA were decreased by 88 and 64%, respectively, in the Agpat6 knock-out mouse mammary gland membranes.
FIGURE 9.

Membranes of mammary epithelial cells from AGPAT6-deficient mice exhibit reduced GPAT activity. Membranes from wild-type or AGPAT6-deficient mice were prepared as described under “Experimental Procedures.” GPAT activity was assessed by TLC for both wild-type and AGPAT6-deficient membranes. The amount of LPA and PA with AGPAT6-deficient membranes was quantified and expressed as a percentage of the activity observed with wild-type membranes.
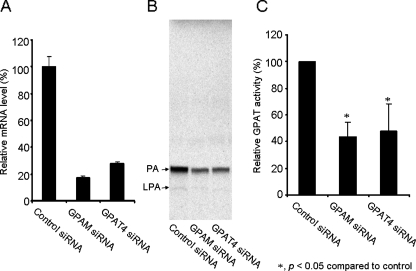
AGPAT6/GPAT4 Contributes to HEK293 Cellular GPAT Activity—To further evaluate the relative contributions to the cellular GPAT activity from AGPAT6/GPAT4, we conducted the siRNA knockdown experiments in HEK293 cells. Membranes from HEK293 cells have considerable GPAT activity. siRNA knockdown of either GPAT4 or mitochondria GPAT1 (GPAM) led to a significant reduction of 72 and 87% in mRNA levels, respectively (Fig. 10A). These were associated with a significant 52 and 54% reduction in GPAT activity, respectively (Fig. 10, B and C). These data indicate that AGPAT6/GPAT4 along with mitochondria GPAT are both significant contributors of cellular GPAT activity in HEK293 cells.
FIGURE 10.
Mitochondria GPAT (GPAM) and AGPAT6/GPAT4 both contribute to GPAT activities in HEK293 cells. The control siRNA, human GPAM siRNA and human GPAT4 siRNA were transfected into 293 cells. After 48 h, mRNA levels (A) and GPAT activities were measured (B) and quantified (C) as described under “Experimental Procedures.” A representative TLC is shown in B. The data in A and C represent the mean ± S.E. of three triplicate measurements. *, p < 0.05.
DISCUSSION
Our studies identified AGPAT6 as a microsomal GPAT. This GPAT, now designated GPAT4, has broad tissue expression patterns and high levels of expression in adipose tissue and mammary tissue. Membranes from HEK293 cells overexpressing GPAT4 exhibited significantly higher GPAT activity levels with both saturated and unsaturated fatty acid substrates. Moreover, the membranes of Agpat6-deficient mammary epithelial cells exhibited markedly reduced GPAT activity levels. Human GPAT4 is located exclusively in the endoplasmic reticulum. AGPAT6 (GPAT4) activity was sensitive to a sulfhydryl-modifying reagent, consistent with known properties of microsomal GPAT (4). Interestingly, GPAT4 contains a cysteine (Cys-325) within a highly conserved domain thought to be important for G3P binding (20).
The mouse orthologue of human GPAT4 (initially designated AGPAT6) was first identified in a gene trap screen in mouse embryonic stem cells (20). Embryonic stem cells containing an insertional mutation in Agpat6 were used to create Agpat6-deficient mice. β-Galactosidase staining studies revealed that the gene was expressed highly in subcutaneous tissue, brown adipose tissue, and mammary epithelium (20). Histological and biochemical studies revealed that Agpat6-deficient mice had lower amounts of subcutaneous adipose tissue, reduced triglyceride levels in mammary epithelial cells and maternal milk, and reduced triglyceride levels in brown adipose tissue. In those earlier studies (20), biochemical experiments failed to identify any AGPAT enzymatic activity for AGPAT6, consistent with our current findings. The identification of AGPAT6 in the mouse gene trap screen prompted efforts to identify additional members of the AGPAT family and to define evolutionary relationships between different AGPAT enzymes. These studies uncovered a number of new “AGPAT” family members, including one, initially designated AGPAT8, that was very closely related to AGPAT6 (66% identical at the amino acid level) (20). AGPAT8 was recently shown to have GPAT activity and was renamed GPAT3 (14). In addition to the identification of AGPAT6 as a GPAT, we also convincingly ruled out any AGPAT activities through two experiments. First, using membranes from HEK293 cells overexpressing GPAT4/AGPAT6, the addition of LPA and fatty acyl-CoA did not lead to increased PA formation compared with the vector transfection control. Second, using affinity-purified AGPAT6/GPAT4 proteins, we found no AGPAT activity, whereas GPAT activity was demonstrated. These data are consistent with the original report that no AGPAT activity could be detected when AGPAT6 was overexpressed (20).
Although expression of GPAT4 in cultured cells increased the amount of LPA and PA, it did not increase total TG biosynthesis. This result was surprising for several reasons. First, expression of mitochondrial GPAT1 or the newly identified mitochondrial GPAT2 increases TG synthesis in cultured cells (14, 28). Second, GPAT3 has been reported by others to increase triglyceride synthesis (14). Third, the reduced amounts of triglyceride in certain tissues of Agpat6-deficient mice (e.g. mammary epithelium) suggest that AGPAT6 could be important for TG production. At this point, we do not understand why GPAT4 overexpression did not yield a clear increase in TG synthesis.
Our studies involved traditional biochemical experiments with radiolabeled substrates, followed by the identification of reaction products by thin layer chromatography. These studies showed that GPAT4 overexpression yields higher levels of LPA and PA. In addition, we incubated cells with an oleic acid substrate containing 13C and took advantage of mass spectrometry to measure reaction products. Once again, we found higher levels of LPA and PA but not TGs or PLs. The mass spectrometry studies did uncover increased levels of 13C7-labeled 34:1 phospholipids and reduced levels of 34:2 and 36:2 phospholipids as well as minor changes in the incorporation of 13C-labeled oleic acid into certain triglyceride species. Although these compositional differences were significant and reproducible, their significance is not clear. We do not know whether these changes are the direct result of increases in GPAT4 reaction products (i.e. the direct result of GPAT4 substrate preferences and subsequent channeling of GPAT4 reaction products) or a very indirect consequence of changes in GPAT4 substrate and product concentrations within the cell. In any case, the mass spectroscopy experiments produced unequivocal evidence to show that AGPAT6 is a bona fide GPAT enzyme.
In summary, metabolic labeling and mass spectrometry showed that overexpression of AGPAT6 (GPAT4) results in higher levels of LPA and PA production, and the absence of AGPAT6 (GPAT4) results in lower levels of LPA and PA production. AGPAT6 (GPAT4) is located in the endoplasmic reticulum and is sensitive to NEM. Our studies identify AGPAT6 as a microsomal GPAT, and we propose renaming this enzyme GPAT4.
Acknowledgments
We thank John Lockwood and Dr. Craig Hammond for help in metabolic labeling studies. We thank Patricia Solenberg, Eric Su, Timothy Ryan, and Jude Onyia for insightful discussions. We are indebted to Richard Higgs for help with statistical analyses.
This work was supported by BayGenomics, a Program for Genomics Applications from NHLBI, National Institutes of Health, Grant UO1 HL66621. The costs of publication of this article were defrayed in part by the payment of page charges. This article must therefore be hereby marked “advertisement” in accordance with 18 U.S.C. Section 1734 solely to indicate this fact.
Footnotes
The abbreviations used are: G3P, glycerol-3-phosphate; AGPAT, 1-acylglycerol-3-phosphate O-acyltransferase; GPAT, glycerol-3-phosphate acyltransferase; PA, phosphatidic acid; LPA, lysophosphatidic acid; TG, triglyceride; PC, phosphatidylcholine; PL, phospholipid; LC/MS, liquid chromatography/mass spectroscopy; DG, diacylglycerol; NEM, N-ethylmaleimide; PBS, phosphate-buffered saline; BSA, bovine serum albumin; siRNA, small interfering RNA; HPLC, high performance liquid chromatography; ESI, electrospray ionization; SM, sphingomyelin.
References
- 1.Coleman, R. A., Reed, B. C., Mackall, J. C., Student, A. K., Lane, M. D., and Bell, R. M. (1978) J. Biol. Chem. 253 7256-7261 [PubMed] [Google Scholar]
- 2.Zheng, Z., and Zou, J. (2001) J. Biol. Chem. 276 41710-41716 [DOI] [PubMed] [Google Scholar]
- 3.Murata, N., and Tasaka, Y. (1997) Biochim. Biophys. Acta 1348 10-16 [DOI] [PubMed] [Google Scholar]
- 4.Coleman, R. A., and Lee, D. P. (2004) Prog. Lipid Res. 43 134-176 [DOI] [PubMed] [Google Scholar]
- 5.Shin, D. H., Paulauskis, J. D., Moustaid, N., and Sul, H. S. (1991) J. Biol. Chem. 266 23834-23839 [PubMed] [Google Scholar]
- 6.Yet, S. F., Lee, S., Hahm, Y. T., and Sul, H. S. (1993) Biochemistry 32 9486-9491 [DOI] [PubMed] [Google Scholar]
- 7.Gonzalez-Baro, M. R., Granger, D. A., and Coleman, R. A. (2001) J. Biol. Chem. 276 43182-43188 [DOI] [PubMed] [Google Scholar]
- 8.Linden, D., William-Olsson, L., Ahnmark, A., Ekroos, K., Hallberg, C., Sjogren, H. P., Becker, B., Svensson, L., Clapham, J. C., Oscarsson, J., and Schreyer, S. (2006) FASEB J. 20 434-443 [DOI] [PubMed] [Google Scholar]
- 9.Linden, D., William-Olsson, L., Rhedin, M., Asztely, A. K., Clapham, J. C., and Schreyer, S. (2004) J. Lipid Res. 45 1279-1288 [DOI] [PubMed] [Google Scholar]
- 10.Hammond, L. E., Gallagher, P. A., Wang, S., Hiller, S., Kluckman, K. D., Posey-Marcos, E. L., Maeda, N., and Coleman, R. A. (2002) Mol. Cell. Biol. 22 8204-8214 [DOI] [PMC free article] [PubMed] [Google Scholar]
- 11.Neschen, S., Morino, K., Hammond, L. E., Zhang, D., Liu, Z. X., Romanelli, A. J., Cline, G. W., Pongratz, R. L., Zhang, X. M., Choi, C. S., Coleman, R. A., and Shulman, G. I. (2005) Cell Metab. 2 55-65 [DOI] [PubMed] [Google Scholar]
- 12.Lewin, T. M., Schwerbrock, N. M., Lee, D. P., and Coleman, R. A. (2004) J. Biol. Chem. 279 13488-13495 [DOI] [PubMed] [Google Scholar]
- 13.Wang, S., Lee, D. P., Gong, N., Schwerbrock, N. M., Mashek, D. G., Gonzalez-Baro, M. R., Stapleton, C., Li, L. O., Lewin, T. M., and Coleman, R. A. (2007) Arch. Biochem. Biophys. 465 347-358 [DOI] [PMC free article] [PubMed] [Google Scholar]
- 14.Cao, J., Li, J. L., Li, D., Tobin, J. F., and Gimeno, R. E. (2006) Proc. Natl. Acad. Sci. U. S. A. 103 19695-19700 [DOI] [PMC free article] [PubMed] [Google Scholar]
- 15.Eberhardt, C., Gray, P. W., and Tjoelker, L. W. (1997) J. Biol. Chem. 272 20299-20305 [DOI] [PubMed] [Google Scholar]
- 16.Aguado, B., and Campbell, R. D. (1998) J. Biol. Chem. 273 4096-4105 [DOI] [PubMed] [Google Scholar]
- 17.Nakanishi, H., Shindou, H., Hishikawa, D., Harayama, T., Ogasawara, R., Suwabe, A., Taguchi, R., and Shimizu, T. (2006) J. Biol. Chem. 281 20140-20147 [DOI] [PubMed] [Google Scholar]
- 18.Chen, X., Hyatt, B. A., Mucenski, M. L., Mason, R. J., and Shannon, J. M. (2006) Proc. Natl. Acad. Sci. U. S. A. 103 11724-11729 [DOI] [PMC free article] [PubMed] [Google Scholar]
- 19.Li, D., Yu, L., Wu, H., Shan, Y., Guo, J., Dang, Y., Wei, Y., and Zhao, S. (2003) J. Hum. Genet. 48 438-442 [DOI] [PubMed] [Google Scholar]
- 20.Beigneux, A. P., Vergnes, L., Qiao, X., Quatela, S., Davis, R., Watkins, S. M., Coleman, R. A., Walzem, R. L., Philips, M., Reue, K., and Young, S. G. (2006) J. Lipid Res. 47 734-744 [DOI] [PMC free article] [PubMed] [Google Scholar]
- 21.Vergnes, L., Beigneux, A. P., Davis, R., Watkins, S. M., Young, S. G., and Reue, K. (2006) J. Lipid Res. 47 745-754 [DOI] [PMC free article] [PubMed] [Google Scholar]
- 22.Cao, J., Liu, Y., Lockwood, J., Burn, P., and Shi, Y. (2004) J. Biol. Chem. 279 31727-31734 [DOI] [PubMed] [Google Scholar]
- 23.Liebisch, G., Lieser, B., Rathenberg, J., Drobnik, W., and Schmitz, G. (2004) Biochim. Biophys. Acta 1686 108-117 [DOI] [PubMed] [Google Scholar]
- 24.Han, X., and Gross, R. W. (2001) Anal. Biochem. 295 88-100 [DOI] [PubMed] [Google Scholar]
- 25.Murphy, R. C., James, P. F., McAnoy, A. M., Krank, J., Duchoslav, E., and Barkley, R. M. (2007) Anal. Biochem. 366 59-70 [DOI] [PMC free article] [PubMed] [Google Scholar]
- 26.Gonzalez-Baro, M. R., Lewin, T. M., and Coleman, R. A. (2007) Am. J. Physiol. 292 G1195-G1199 [DOI] [PMC free article] [PubMed] [Google Scholar]
- 27.Agarwal, A. K., Sukumaran, S., Bartz, R., Barnes, R. I., and Garg, A. (2007) J. Endocrinol. 193 445-457 [DOI] [PubMed] [Google Scholar]
- 28.Igal, R. A., Wang, S., Gonzalez-Baro, M., and Coleman, R. A. (2001) J. Biol. Chem. 276 42205-42212 [DOI] [PubMed] [Google Scholar]


