Abstract
The building of minimal self-reproducing systems with a physical embodiment (generically called protocells) is a great challenge, with implications for both theory and applied sciences. Although the classical view of a living protocell assumes that it includes information-carrying molecules as an essential ingredient, a dividing cell-like structure can be built from a metabolism–container coupled system only. An example of such a system, modelled with dissipative particle dynamics, is presented here. This article demonstrates how a simple coupling between a precursor molecule and surfactant molecules forming micelles can experience a growth-division cycle in a predictable manner, and analyses the influence of crucial parameters on this replication cycle. Implications of these results for origins of cellular life and living technology are outlined.
Keywords: artificial cells, self-replication, micelles, cell division, synthetic biology
1. Introduction
The transition from non-living to living systems covers a broad spectrum of increasingly complex organization (Smith & Szathmary 1995). One of such first steps in this transition leads from ordinary chemical auto-catalysis to self-replication. The latter can be distinguished from the former by the existence of self-bounded entities which produce copies of themselves, rather than a mere increase in chemical concentration. Therefore, self-replication relies on organization principles unlikely to be found in homogeneous solutions. Within the last few years, increasing attention has been paid to the possibility of building small-scale protocells, in particular using a bottom-up approach (Szostack et al. 2001) where the building blocks (not necessarily from biotic origin) would assemble spontaneously and, under appropriate conditions, develop a growth–fission cycle. While extensive research has been performed on the self-reproducing capabilities of biopolymers (Kiedrowski 1986; Tjivikua et al. 1990), even much simpler systems can be driven into dynamics that we identify as self-replication. In this context, micelles have been proposed to serve as life-like structures able to undergo self-reproduction (Bachmann et al. 1992).
These micellar systems can be considered to be simpler in organization than biopolymers because they lack any genetic information that could be passed from one generation to the next. In this context, protocellular entities lacking information would be under the umbrella of Oparin's views of life origins (Oparin 1936), who suggested that primitive self-replicating vesicles would have predated information-based cells. Similarly, other authors have advocated for this scenario under a computational perspective. Under this view, Dyson (1999) indicated that current cells involve both software (DNA and RNA) and hardware (protein machinery). Although hardware can exist under the absence of software, the opposite is not allowed to occur. We can add the picture of cells to this, in that the presence of a container is a very important piece for the hardware to properly work: only when the pieces are close together can we expect the machinery to operate.
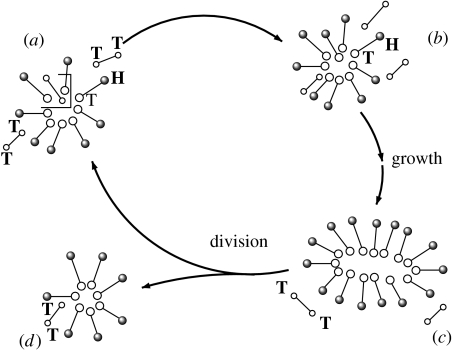
The nanocellular system discussed here is based on a micelle that is coupled to a minimal metabolism (figure 1). The system is constantly driven away from equilibrium by the supply of precursors, which are supposed to have higher internal energy than the surfactants that build up the micelles. The metabolism transforms precursor molecules into new building blocks of the nanocell. The metabolic turnover is thereby enhanced by its own outcome or—in other words—the metabolism is an auto-catalytic turnover of precursors into new surfactants. This system resembles the one studied experimentally by Bachmann et al. (1992). However, in their work the catalytic effect is a feature of the micelles (probably due to milieu effects), while in our system it is a feature of the molecules themselves.
Figure 1.
The basic model of nanocell replication explored in this paper. Here small-sized micelles are formed by amphiphiles (indicated as H–T connected pairs of balls). These amphiphiles have a hydrophilic head (H) and a hydrophobic tail (T). Precursor molecules are also shown as two connected, smaller open balls, both of hydrophobic character. Under the presence of catalytically active amphiphiles, precursors are transformed into additional amphiphiles. Incorporation of many such building blocks allows the nanocell to grow in size. When a critical size has been reached, the nanocell looses its stability and divides into two smaller aggregates thereby closing the replication cycle.
Either way, the replication mechanism of micelles envisioned both in Bachmann's as well as our system is the following: micelles incorporate hydrophobic precursor molecules where they are afterwards transformed into new surfactants. Owing to this process, the number of surfactants increases while, at the same time, the volume of the hydrophobic core becomes smaller. It is assumed that when a critical ratio of surfactants versus core volume is passed, the aggregates become unstable and will divide into two daughter cells. Whether or not the experimental system follows this pathway has, to our knowledge, never be clarified. However, once such a replication mechanism is considered the basis for a more complicated protocell design, knowledge of the exact replication kinetics becomes crucial.
Together with experimental approaches aimed to find the conditions for protocell replication to occur, there is an increasing need of appropriate, well-grounded theoretical and computational models. Such models can help in understanding the constraints that might operate in the self-assembly of micelles and other molecules, and how they can properly trigger growth and splitting. Our work is a first step in this direction.
2. Dissipative particle dynamics nanocell model
In this paper, we consider a dissipative particle dynamics (DPD) approach to modelling embodied protocells employing a physically and chemically simplified formalism. This is one possible approach that can be used in order to tackle the complexities of molecular aggregates. Other approaches include molecular dynamics (MD), Brownian dynamics (BD) and Monte Carlo algorithms. Each of these methods has its own advantages and drawbacks (Heermann 1990; Binder & Heermann 1997) and a compared analysis has been presented elsewhere (Chen & Szostak 2004).
Previous work done by Ono & Ikegami (1999) involved lattice-based, protocell dynamics. These structures display a special type of cell-like replication. While they are remarkable in their self-organizing behaviour, the underlying rules of interaction and the special properties of the membrane-like structures restrict their relevance to the arena of artificial life. By using more appropriate molecular interactions within a three-dimensional, water-filled environment (see for example Rasmussen and Nilsson's cellular automata approach to self-assembly; Rasmussen et al. 2003), we seek to provide the (as far as we know) first computational evidence that such a simple protocellular cycle is feasible.
(a) Dissipative particle dynamics
DPD is a coarse-grained, particle-based simulation technique comparable to BD. It was proposed by Hoogerbrugge & Koelman (1992) and gained significant theoretical support in the late 1990s (Español & Warren 1995; Groot & Warren 1997; Marsh 1998). In the context of biological systems, DPD models have been successfully used to capture the dynamics of membranes (Venturoli & Smit 1999), vesicles (Yamamoto et al. 2002; Yamamoto & Hyodo 2003) and micelles (Groot 2000; Yuan et al. 2002).
A DPD simulation consists of a set of N particles that are described by their type, mass mi, position ri and momentum qi=mivi. These particles—usually called ‘beads’ throughout the literature—are not meant to represent individual atoms. Instead, they represent groups of atoms within a molecule (like several CH2 groups within a hydrocarbon chain) or even a group of small molecules such as water.
Newton's law of motion is used to determine the trajectory of each individual bead:
| (2.1) |
The force Fi that acts on particle i is expressed as the superposition of pairwise interactions
| (2.2) |
In Newtonian dynamics, the (central) force can be expressed as the negative gradient of a potential ϕij, namely
| (2.3) |
The resulting dynamics are conservative and obey the Hamiltonian
| (2.4) |
While this approach is undertaken in MD simulations, coarse-grained simulation techniques try to aggregate some of the molecular degrees of freedom by the use of the so-called Langevin formalism: additional forces and are added to the conservative force to express friction and thermal motion. They introduce energy flows between the explicitly modelled mesoscale and the underlying microscale. Together, they act as a thermostat to regulate the effective temperature, i.e. mean velocity, of the system.
The thermostat used in the DPD formalism is given by the equation
| (2.5) |
where rij=|ri−rj| is the distance; nij=(ri−rj)/rij the (unit) direction; and vij=vi−vj the relative velocity between beads i and j. η Is the friction coefficient of the fluid and σ the amplitude of thermal motion. ξij Is a random variable with ξij=ξji, and otherwise Gaussian statistics. ω Is a distance weighing function usually defined as
| (2.6) |
where rc is a cut-off range used to limit the maximal range of all interactions for performance reasons. It can be shown that the equilibrium temperature of the system tends towards kbT=σ2/2η (Español & Warren 1995).
While there is a variety of other thermostats used in coarse-grained particle simulations, the above mechanism is unique in that it conserves both linear and angular momenta and fulfills the fluctuation–dissipation theorem. As a consequence of the former, the resulting dynamics are consistent with the Navier–Stokes equations and hence preserve laminar flow properties of the system. The latter property ensures an energy distribution in the system following Maxwell–Boltzmann statistics. The overall dynamics, therefore, capture both hydrodynamic and thermodynamic traits of the systems.
In almost all DPD studies, the conservative force is derived from a soft-core potential of the shape
| (2.7) |
The potential energy expressed by ϕij should not be understood as the mechanical energy, i.e. enthalpy, of the system, but rather as its free energy contribution (Pagonabarraga & Frenkel 2001). Following this rationale, the interaction parameters aij are used to express dissimilarities of substances due to high enthalpy as well as entropy contributions, respectively. Therefore, they can be related to Flory–Huggins coefficients known from polymer theory.
For the study of lipids and surfactants, covalent bonds between beads are commonly introduced as harmonic spring forces: on top of the above interactions, bonded beads interact according to the potential
| (2.8) |
where b is the strength and rb the optimal distance of covalent bonds. As usual, we use rc, m and kbT as units of space, mass and energy, respectively. The time unit follows from equation (2.1) as .
To model the system under consideration, we define beads of type W (water), H (hydrophilic ‘heads’) and T (hydrophobic ‘tails’ of amphiphiles) with interaction parameters taken from Groot (2000), unless otherwise specified.
All beads have mass 1m. Precursor molecules are modelled as dimers of bonded T beads, surfactants as dimers of one T and one H bead. Here we have b=125kbT and rb=0.5rc for all covalent bonds.
The objective behind this parameter set is to model surfactants that form spherical micelles. To achieve this, the effective head area must be large compared with the volume of the hydrophobic core (packing parameter 1/3). This is expressed by aTT<aWW<aHH. Furthermore, surfactant heads have a high affinity to water (aHW<aWW), which is usually due to charges in the hydrophilic groups of the molecules. This assumption ensures that aggregates with high surface area (spherical micelles) are preferred over aggregates with less surface area (rod-like micelles) in the process of total energy minimization.
(b) Incorporation of chemistry
The metabolic reaction under consideration takes the following form
| (2.9) |
This reaction is modelled by a stochastic process that has formerly been used in BD simulations (Ono 2001). In between every two steps of the numerical integrator for the DPD equation of motion, each precursor dimer can be transformed into a surfactant molecule with a spontaneous reaction rate kb. The spontaneous reaction can be catalytically enhanced by nearby surfactants whose catalytic influence decreases linear with the distance to the reactant up to a certain threshold rcat. For simplicity, the effect of several catalysts is modelled as a superposition
| (2.10) |
where rC is the distance of the catalyst and ks the maximal catalytic rate per catalyst. For clarity of the results, we set the spontaneous reaction rate in our simulations to 0τ−1. In the upcoming simulations, kcat is set to 1.0τ−1, rcat to 1rc. If a reaction occurs, the type of one random T bead is changed to H, but positions and momenta are preserved.
We also introduce particle exchange into the model to mimic the support of new precursors into the system: During the simulation, two water beads can be exchanged by precursor dimers with the probability 2.5×10⁻⁵τ−1 per water bead within a region of radius 2rc. Again, bead positions and momenta are preserved.
3. Results
We implemented the DPD method using a velocity Verlet integrator (λ=0.5) with a step width of 0.04τ. The spatial domain is three-dimensional, with periodic boundary conditions and size (10rc)3. In all the following simulations, the system is initialized with one surfactant dimer and 2998 water molecules adding up to a mean particle density of . Unless otherwise specified, simulations have been run for 0τ≤t≤1000τ (25 000 iterations).
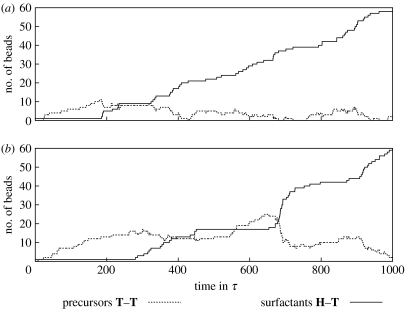
For simulation runs with the parameter set given in §2, we typically get the following behaviour: water beads are successively exchanged by precursors in the exchange region of the system. When diffusing through the system, the precursors form droplets due to their hydrophobic trait. Once such a droplet reaches the initial surfactant, the precursors are turned into surfactants. The turnover happens fast when compared with supply and diffusion of the precursor. New surfactants quickly arrange into a micellar shape with hydrophobic beads in the interior and hydrophilic beads towards the surface of the assembly. With the parameters introduced before, this rearrangement takes only few time-steps and is thus fast compared with the metabolic turnover. Such spontaneously formed nanocells diffuse through the system space as aggregates and eventually incorporate additional precursor droplets in their interior, where the metabolic process is repeated. The evolution of the overall system composition (number of beads per type) traces the different processes on their respective time-scales (figure 2 for aHT=aWT=80kbT (a) and aHT=aWT=120kbT (b)). As one can see, the overall production of surfactants is limited by a linear growth that results from the constant supply of precursors. Locally, however, when a single droplet is consumed by a nanocell, the metabolic turnover exhibits a logistic growth, which is suspected from resource limited auto-catalysis. The logistic growth can be best seen in figure 2b around t=700τ.
Figure 2.
Evolution of bead numbers with time for hydrophobicity values (a) 80 kbT and (b) 120 kbT (aHT and aWT). The constant supply of precursors is counteracted by their transformation into surfactants. This transformation happens in spurts rather than continuously, as the precursor forms droplets in the aqueous solution. Size and frequency of these spurts depend on the hydrophobicity of the tail beads.
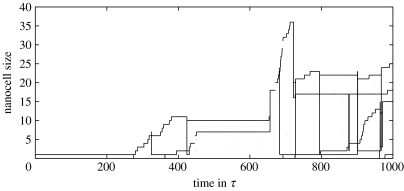
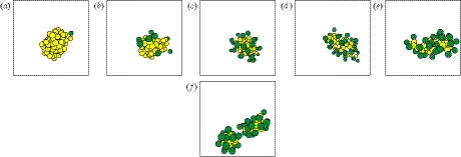
On the level of individual micelles, the metabolic process increases the aggregate number, i.e. the number of surfactants per micelle. In a pure water–surfactant system, micelles would reject the surplus of surfactants into the bulk phase. In an oil–surfactant–water system, such as the one under consideration, the hydrophobic core formed by the precursors stabilizes the assembly far beyond its original aggregate number. As a consequence, we could observe that nanocells increase in aggregate number when new surfactants are synthesized. While the precursor:surfactant ratio shifts, the nanocell changes its shape from a spherical to a rod-like micelle. When all or nearly all of the precursor is turned into surfactant, the nanocell finally becomes unstable and divides into two smaller aggregates (figures 3 and 4). The nanocell division occurs in the cylindrical middle part of the rod-like aggregate by indentation of surfactant heads. It induces vibrating modes into the daughter aggregates as they rearrange back to a spherical shape. Although this vibration is successively dissipated into undirected motion, it sometimes leads back to short series of temporary fusion and fission of the daughter cells.
Figure 3.
Here, the size evolution of figure 2b is tracked for individual nanocells: each line designates the size evolution of a single aggregate. Horizontal lines result from fission (or dissociation) events, after which two lines indicate the fate of the daughter cells. Isolated dots denote short-term vibrations during which nanocells divide and fuse within less than 1τ. For clarity, such horizontal lines have been suppressed for such vibrations. As one can see, only two daughter cells result from a true fission event (at t=722τ). The other two result from dissociation of single surfactants that start to turn over precursor droplets found in bulk phase. These surfactant dissociations happen at t=324τ and t=684τ. Furthermore, two nanocells fuse at t=655τ.
Figure 4.
Metabolism and fission of a nanocell (T beads are shown in light grey, H beads in dark grey, water not shown): the initial surfactant metabolizes a precursor droplet and turns it into a functioning nanocell (panels a–c). While the precursor is consumed, the nanocell elongates to account for the changing precursor surfactant ratio (panel d–e). Such elongated structures can be stable for several time units, until—when all precursors are turned into surfactants—the nanocell divides into two daughter cells (f).
Elongated micellar structures are well known from worm-like micelles, which usually consist of two surfactants with different curvature. Such worm-like micelles are stable equilibrium aggregates and exhibit an exponential size distribution (Kröger & Makhloufi 1996). In the system studied in this work, however, the elongated aggregate is not stabilized by different curvature values of the components, but by the hydrophobic core. Accordingly, once the precursor is turned over into new surfactant molecules, the elongated structure looses its stability.
There is a second pathway, however, that might jeopardize the above scenario: once in a while throughout our simulations, nanocells loose individual surfactants into the bulk phase. If this relaxation process happens fast compared with the metabolic turnover, the nanocells might not be able to reach the division size. Surfactants in the bulk phase may however metabolize precursor droplets and spontaneously form nanocells on their own.
Formally, fission events can be written in the form of a chemical reaction
| (3.1) |
where Sn, Sm and Sn+m are aggregates of size n, m and n+m, respectively; and is the fission rate. For m=1, one obtains dissociations as a special case. Analogously, association and fusion events take the form
| (3.2) |
In order to quantify micellar fission and surfactant dissociations, nanocells have been identified by a variant of the flood fill algorithm: every two T beads within a distance of 1rc or less have been considered to belong to the same aggregate. The aggregate number is defined as the number of participating surfactants. This allows for tracking individual aggregate sizes and their transitions through time. Each of the above reaction schemes results in two transitions, given by
| (3.3) |
and
| (3.4) |
Furthermore, the turnover of precursors results in the transition
| (3.5) |
Not all transitions can be expressed by the chemical reaction scheme given by equations (3.1) and (3.2). Those transitions are of the type
as well as fissions into and fusions from more than two aggregates. For all the simulations performed, such outliers amount to less than 0.3% of the total transitions. They have been neglected for further analysis.
In the remainder of this work, we will analyse two key parameters of the model and their influence on the dynamics of the system. Thereby, we will put our attention on the fission pathways discussed above. The first parameter we analyse is the hydrophobicity, i.e. the values aTW and aTH. This parameter is related to the dissimilarity between surfactant tails and water. For most surfactants the hydrophobicity is solely a function of the length of the hydrocarbon chains (Evans & Wennerström 1999). The value is thus easily adjustable in experimental set-ups.
Second, we analyse the influence of the catalytic rate kc—hence, the speed of metabolic turnover—on the division pathway of the nanocell. As we did not specify the molecular implementation of precursor and surfactant, it is conceivable that in an experimental set-up, one can choose from a wide range of catalytic efficiencies.
(a) Influence of hydrophobicity on nanocell dynamics
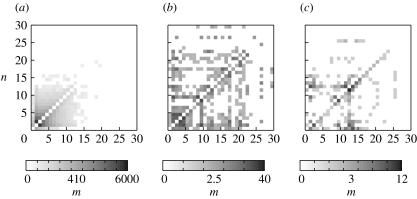
For three hydrophobicities, 40, 90 and 120kbT, histograms of such transitions are shown in figure 5. The figures reveal a clear trend both in aggregate numbers as well as transition types. For hydrophobicity 40kbT, the system is almost entirely composed of single surfactants and small aggregates in bulk phase. Of the transitions, 33.4% are dissociations and associations of two single surfactants. For the few bigger aggregates, transitions are distributed more or less homogeneously, i.e. surfactant dissociation is as likely as proper aggregate fission. Thus, for weak hydrophobicities, the system resembles a homogeneous solution without significant formation of structures. For 120kbT, on the other hand, the transition histogram looks completely different. Associations or dissociations of two isolated surfactants make only 3.7% of the transitions for this parameter. The most prominent transition type is the turnover of a precursors within nanocells that range in size from 1 to 25 surfactants (20.6% of all transitions), represented by high values in the lower secondary diagonal. The absence of an upper secondary diagonal reveals that there are no surfactant dissociations except some between aggregate numbers 8 and 16. Owing to the higher stability of aggregates, there are far less overall transitions than in the previous case (321 compared with 24 743), which poses a problem when trying to obtain smooth histograms. Although there are distinct cases of proper fission events (e.g. S25→S14+S11, S20→S11+S9), it is hard to tell from the histograms whether such fission is more probable than single surfactant dissociation. Varying the hydrophobicity between these two extrema yields traits of both other histograms. One example is given in figure 5 for 90kbT.
Figure 5.
Histograms of nanocell size transitions for different hydrophobicities (a) 40kbT, (b) 90kbT and (c) 120kbT (see text on how transitions are defined). For a transition Sn→Sm, n is ordered along the vertical axis, m along the horizontal axis. Scales indicate the number of occurrences (scaled by root functions to emphasize seldom events).
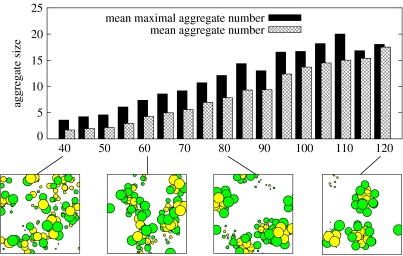
As new precursors are constantly supplied and nanocells grow and divide over time, it is somewhat difficult to capture mean aggregate numbers of the assemblies. Nevertheless, these values are prominent characteristics in the study of micellar systems and their knowledge can help to get insight into the system under consideration. To gain aggregate numbers, we compute the average value m+n for all transitions of the form Sm+n→Sn+Sm, i.e. we average aggregate numbers only in moments of fission or dissociation. The results can be regarded as the mean maximal aggregation number of nanocells. Figure 6 shows results for hydrophobicity values from 40kbT to 120kbT together with a simple average of all aggregate sizes in the system. Both maximal and average values increase constantly from 1.68 (3.59) for 40kbT to 18.04 (17.51) for 120kbT. It becomes apparent that for very weak hydrophobicities, most of the surfactants are either isolated in bulk phase or in very small assemblies. For strong hydrophobicities, aggregates are very distinct and single surfactants in bulk phase are rare. There is, however, no sharp boundary or phase transition between small sub-micellar assemblies and proper micelles, but rather a continuous transition.
Figure 6.
Mean aggregate and mean maximal aggregate numbers for hydrophobicity values between 40 and 120kbT. The latter averages only the size of nanocells that are actually going to divide, while the former averages all aggregates. System states have been averaged for 500τ≤t≤1000τ. Earlier states have been considered as transient. Below, parts of the final simulation states are shown for selected parameters.
Going back to the issue of nanocell division, we want to distinguish proper fission into nanocells of approximately equal size from dissociation of sub-micellar aggregates. The previous analysis revealed that one cannot use absolute aggregate numbers, as they exhibit a trend for stronger hydrophobicity. Therefore, we characterized each event of the form of equation (3.1) by the function
| (3.6) |
which denotes the relative fission quality. Q(m, n)=1 for m=n, i.e. when the resulting nanocells are equal in size. Q becomes smaller as daughter cells become less alike. We have averaged Q as a function of the hydrophobicity over all fission events in the simulation runs discussed before. Mean and standard deviation are shown in figure 7. 〈Q〉 varies between 0.41 and 0.65 with no significant trend for weak or strong hydrophobicities. Moreover, standard deviation is very high. This reveals that fission into any two daughter cells is equally probable, no matter the ratio of their sizes. In terms of fission rates this finding can be written as
| (3.7) |
for the system under consideration.
Figure 7.
Mean quality of nanocell divisions. A value of 1 signifies division into daughter cells of equal size, while a value close to 0 results from single surfactant dissociation. Error bars denote standard deviations.
(b) Influence of the catalytic rate on nanocell dynamics
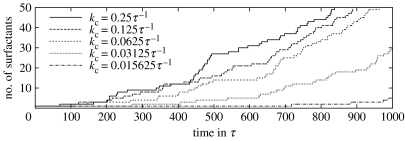
The catalytic rate has been varied from 2−6τ−1 to 4.0τ−1 in exponential steps. Hydrophobicity has been set to 80kbT. Global surfactant dynamics are shown in figure 8. For slow metabolic turnover (<0.125τ−1), the exponential shape of surfactant production becomes apparent, i.e. the constant precursor supply of precursors does not limit surfactant production over the simulated time span. This is tantamount to saying that unmetabolized precursor droplets are present throughout the whole simulation. Deceleration of the global dynamics is reflected in slower fission rates of individual nanocells. For example, we observed that the first fission event is retarded by 180τ on average when catalytic rates are halved. For kc<0.03125τ−1, no fission occurs during the simulated time span.
Figure 8.
Number of surfactants as a function of time for different catalytic rates kc. For slow metabolic turnover, the exponential shape of the auto-catalysis becomes apparent.
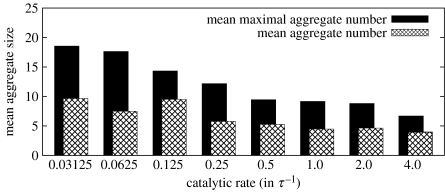
Figure 9 shows mean aggregation numbers as a function of the catalytic rate. As one can see, slow metabolic turnover increases both maximal and average aggregation numbers (from 9.45 (5.27) for 0.5τ−1 to 18.55 (9.66) for 0.03125τ−1). The trend becomes less apparent for faster metabolic turnover (1.0τ−1 to 4.0τ−1). For kc=0.125τ−1, the maximal aggregation number is slightly higher than a monotonic trend would imply—a fact that we relate to statistical deviations, as fission events are considerably rare for small catalytic rates. The increase in both aggregation numbers is a natural consequence of the decelerated metabolism: when the precursor is metabolized slowly while its supply is held constant, the size of the hydrophobic core increases and offers a bigger area for surfactants to attach. Hence, the maximal aggregate numbers increase.
Figure 9.
Mean aggregate and mean maximal aggregate numbers for catalytic rates between 0.03125 and 4.0τ−1. Consult the caption of figure 6 on how aggregation numbers have been obtained.
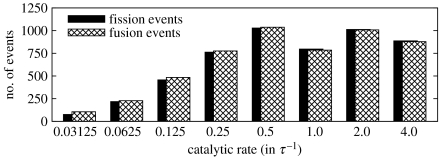
For the above runs, the number of fission and fusion events has been measured (figure 10). For all simulation runs, fusion and fission events are more or less balanced. This reveals that most of these events result from surfactant exchange with the bulk phase or from series of temporary fission and fusion during a single division process rather than from proper nanocell divisions. For low catalytic rates (0.03125τ−1≤kc≤0.25τ−1), the number of such balanced transitions falls significantly from 1028 for kc=0.5τ−1 to only 8 for kc=0.03125τ−1. As in the case of aggregation numbers, the trend in transition numbers can be related to the hydrophobic core: the more hydrophobic particles in the interior of a nanocell, the less dissociations occur on its surface. A strong anti-correlation between aggregation numbers and the number of fission/fusion events (with a correlation coefficient of −0.917) justifies this hypothesis.
Figure 10.
Number of overall fission and fusion events (transitions of the form of equations (3.3) and (3.4)) as a function of the catalytic rate kc.
It has to be pointed out, however, that the catalytic rate might affect nanocellular dynamics only during a certain transient time. It has been shown how the nanocellular dynamics depend on the ratio between metabolic turnover and precursor supply. Precursors are supplied by diffusion. Therefore, the rate of their incorporation into an individual cell depends on the overall concentration of nanocells. Once a critical cell concentration is reached, precursor incorporation might be slower than its metabolic turnover, which would undermine the above discussed effect. While the duration of such transient will depend on the ratio of precursor supply and turnover, dynamics after the transient might be little affected again. Ideally, simulations would be performed in a homeostatic system, with an influx of precursor solution at one side and an outflux of reaction products at the opposite site of the system. Up to now, however, little is known about the performance of DPD in such open systems.
4. Discussion
In this paper, we have presented an information-free nanocell based on a micellar system and a single auto-catalytic reaction that serves as metabolism. This simple system can be understood as a minimal self-replicating chemical system. As such, it denotes the boundary between pure auto-catalysis and a more complicated self-reproducing system that would also include inheritable information. We analysed the dynamics of this nanocell using a DPD approach. This simulation technique can cover the relevant time-scale, while it has been shown to be still physically accurate compared with other simulation techniques. As a consequence, we have been able to perform analyses of the system in a level of detail that has—as far as we know—not been reached before in the study of self-replicating entities.
The general replication cycle of micellar nanocells by metabolic turnover and division is very robust against changes in hydrophobicity and catalytic rates. It has been shown that the mean aggregation number of nanocells depends on the hydrophobicity of the surfactant (and precursor) as well as on the catalytic rate of the metabolism. For increasing hydrophobicity, a monotonic change in aggregation number with no sudden phase transition has been observed, ranging from a nearly homogeneous solution with only sub-micellar aggregates for weak hydrophobicities to the formation of distinct micelles in surfactant-free water for a very high hydrophobicity. The same monotonic increase in aggregation number could be observed for increasing catalytic rates, i.e. fast metabolic turnover.
It has been found that the rate of nanocell fission and surfactant dissociation depends on the size of the hydrophobic core of the nanocells, and is more likely to occur for small values in hydrophobicity and slow metabolic turnover. Daughter cells resulting from a fission event have been shown to vary significantly in size. There is neither a trend in the average size ratio of fission products nor in its variance.
Our work shows that the envisioned replication cycle of nanocells—namely incorporation and turnover of precursor droplets followed by eventual aggregate division—is achievable over a wide range of parameters. In fact, there is no parameter combination for which the general replication cycle has been rendered impossible: although we have been able to decrease mean aggregation numbers and increase dissociation rates up to a point where the system obeys no clear structures, we could not observe that dissociation of single surfactants jeopardizes the growth of an otherwise stable nanocell.
We have demonstrated the feasibility of a self-replicating system in the absence of genetic information. Although such a system is not able to evolve towards higher complexity, it could have served as a functioning sub-system providing metabolism and embodiment for subsequent protocells of higher evolutionary complexity. It is conceivable that independently evolved information systems like RNA might have become incorporated into such functioning replicators. When the two formerly independent replication cycles of container and genome are orchestrated by coupling, such that each daughter cell of the dividing container is loaded with exactly one copy of the genomic information, one would obtain a true self-reproducing protocell with the ability to metabolize, divide and evolve.
Apart from prebiotic scenarios in which micelles are considered as possible ancestors of subsequent vesicle-based organisms, such systems are explored in the context of so-called living technology, i.e. artificial systems that mimic life-like behaviour. Our results suggest that the generic replication cycle of micellar nanocells is a robust basis for artificial life forms. We are currently exploring one design of such an artificial protocell in which genomic information is coupled to a micellar self-replicating system similar to the one presented here.
Acknowledgments
The authors would like to thank the members of the Complex Systems Lab for useful discussions. This work has been supported by grants FIS2004-0542, IST-FET PACE project of the European Community funded under EU R&D contract FP6002035 and by the Santa Fe Institute.
Footnotes
One contribution of 13 to a Theme Issue ‘Towards the artificial cell’.
References
- Bachmann P.A, Luisi P.L, Lang J. Autocatalytic self-replicating micelles as models for prebiotic structures. Nature. 1992;357:57–59. doi:10.1038/357057a0 [Google Scholar]
- Binder K, Heermann D.W. 3rd edn. Springer; Berlin, Germany: 1997. Monte Carlo simulation in statistical physics. [Google Scholar]
- Chen I.A, Szostak J.W. A kinetic study of the growth of fatty acid vesicles. Biophys. J. 2004;87:988–998. doi: 10.1529/biophysj.104.039875. doi:10.1529/biophysj.104.039875 [DOI] [PMC free article] [PubMed] [Google Scholar]
- Dyson F.J. Cambridge University Press; Cambridge, UK: 1999. Origins of life. [Google Scholar]
- Español P, Warren P. Statistical mechanics of dissipative particle dynamics. Europhys. Lett. 1995;30:191–196. [Google Scholar]
- Evans D.F, Wennerström H. Wiley-VCH; New York, NY: 1999. The colloidal domain—where physics, chemistry, biology, and technology meet. [Google Scholar]
- Groot R.D. Mesoscopic simulation of polymer-surfactant aggregation. Langmuir. 2000;16:7493–7502. doi:10.1021/la000010d [Google Scholar]
- Groot R.D, Warren P.B. Dissipative particle dynamics: bridging the gap between atomistic and mesoscale simulation. J. Chem. Phys. 1997;107:4423–4435. doi:10.1063/1.474784 [Google Scholar]
- Heermann D.W. 2nd edn. Springer; Berlin, Germany: 1990. Computer simulation methods in theoretical physics. [Google Scholar]
- Hoogerbrugge P.J, Koelman J.M.V.A. Simulating microscopic hydrodynamic phenomena with dissipative particle dynamics. Europhys. Lett. 1992;19:155–160. [Google Scholar]
- Kiedrowski G. A self-replicating hexadeoxynucleotide. Angew. Chem. 1986;25:932–935. [Google Scholar]
- Kröger M, Makhloufi R. Wormlike micelles under shear flow: a microscopic model studied by nonequilibrium-molecular-dynamics computer simulations. Phys. Rev. E. 1996;53:2531–2536. doi: 10.1103/physreve.53.2531. doi:10.1103/PhysRevE.53.2531 [DOI] [PubMed] [Google Scholar]
- Marsh, C. 1998 Theoretical aspects of dissipative particle dynamics PhD thesis, University of Oxford.
- Ono, N. 2001 Artificial chemistry: computational studies on the emergence of self-reproducing units PhD thesis, University of Tokyo.
- Ono N, Ikegami T. Model of self-replicating cell capable of self-maintenance. Lect. Notes Comp. Sci. 1999;1674:399–406. [Google Scholar]
- Oparin A.I. Macmillan; New York, NY: 1936. The origin of life. [Google Scholar]
- Pagonabarraga I, Frenkel D. Dissipative particle dynamics for interacting systems. J. Chem. Phys. 2001;115:5015–5026. doi:10.1063/1.1396848 [Google Scholar]
- Rasmussen S, Chen L, Nilsson M, Abe S. Bridging nonliving and living matter. Artif. Life. 2003;9:269–316. doi: 10.1162/106454603322392479. doi:10.1162/106454603322392479 [DOI] [PubMed] [Google Scholar]
- Smith J.M, Szathmary E. W. H. Freeman Press; New York, NY: 1995. The major transitions in evolution. [Google Scholar]
- Szostack J.W, Bartel D.P, Luisi P.L. Synthesizing life. Nature. 2001;409:387–390. doi: 10.1038/35053176. doi:10.1038/35053176 [DOI] [PubMed] [Google Scholar]
- Tjivikua T, Ballester P, Rebek J. A self-replicating system. J. Am. Chem. Soc. 1990;112:1249–1250. doi:10.1021/ja00159a057 [Google Scholar]
- Venturoli M, Smit B. Simulating the self-assembly of model membranes. Phys. Chem. Commun. 1999:10. [Google Scholar]
- Yamamoto S, Hyodo S.-a. Budding and fission dynamics of two-component vesicles. J. Chem. Phys. 2003;118:7937–7943. doi:10.1063/1.1563613 [Google Scholar]
- Yamamoto S, Maruyama Y, Hyodo S.-a. Dissipative particle dynamics study of spontaneous vesicle formation of amphiphilic molecules. J. Chem. Phys. 2002;116:5842–5849. doi:10.1063/1.1456031 [Google Scholar]
- Yuan S.-L, Cai Z.-T, Xu G.-Y. Dynamic simulation of aggregation in surfactant solution. A. Chim. Sin. 2002;60:241–245. [Google Scholar]


