Abstract
A self-consistent minimal cell model with a physically motivated schema for molecular interaction is introduced and described. The genetic and metabolic reaction network of the cell is modelled by multidimensional nonlinear ordinary differential equations, which are derived from biochemical kinetics. The strategy behind this modelling approach is to keep the model sufficiently simple in order to be able to perform studies on evolutionary optimization in populations of cells. At the same time, the model should be complex enough to handle the basic features of genetic control of metabolism and coupling to environmental factors. Thereby, the model system will provide insight into the mechanisms leading to important biological phenomena, such as homeostasis, (circadian) rhythms, robustness and adaptation to a changing environment. One example of modelling a molecular regulatory mechanism, cooperative binding of transcription factors, is discussed in detail.
Keywords: biochemical ordinary differential equation solver, cooperativity, genetic regulatory network, metabolic network, systems biology markup language
1. Introduction
One of the great unsolved problems of biology is the intricate procedure that transforms heritable genetic information into the observable physical, chemical and biological characteristics of an organism subsumed in the phenotype. Unfolding a genotype in order to yield the corresponding phenotype is commonly a complex process that involves a great variety of molecular players. In the case of multicellular organisms, this process involves not only the formation of new cells by division but also cell differentiation and development, the next higher hierarchical level. Understanding the unfolding of a genotype, often subsumed under the notion of a ‘genotype–phenotype map’, is further complicated by the fact that the ‘interpretation’ of the genotype by the molecular machinery of the cell is strongly influenced by environmental and epigenetic factors. At the present state of knowledge, a theoretical model that adequately describes the genotype–phenotype map at the molecular level for a whole organism seems to be a hopeless task.
The simplest evolving entity one can think of, comprises heritable information in a nucleotide sequence and a phenotype derived from it in one and the same object. The information stored in the sequence materializes as a self-replicating molecular species in the form of an RNA molecule. The structure of the RNA molecule is established by the interactions of individual nucleotides joined by the polymer chain, which determines the function of the molecule. In that sense, the sequence carries the ‘heritable’ information for the formation of the phenotype, which in turn is the molecular structure upon which selection acts in the evolution experiment (Biebricher 1983; Biebricher & Gardiner 1997). The folding process of RNA at the secondary structure level is also accessible to mathematical analysis and computer simulation; therefore, it can be viewed as an abstract model of a genotype–phenotype map (the ‘RNA model’ is described in Schuster et al. (1994) and Schuster (2002)).
Intensive studies of the RNA sequence to structure a map during the last decade revealed how the properties of this map influence the dynamics of evolutionary optimization. While being tremendously successful in elucidating the mechanisms governing molecular evolution (Fontana & Schuster 1998a; Schuster 2001, 2003), many concepts of biological genotype–phenotype maps, such as signal transduction or developmental processes, have no concrete analogue (Fontana 2002) within the RNA model. The restriction of the phenotype to the structure of a single molecule makes it impossible to discuss aspects of organization, since ‘division of labour’ is one of the key issues in biology that determines the properties of genotype–phenotype maps. In particular, the most striking deficiency is the absence of any form of control and regulation in the RNA model. It is indeed the regulatory network that builds the link between the genotype and the observable features of the phenotype (Davidson 2001; Banzhaf & Miller 2004).
In this paper, we describe a model that comes a step closer to biological genotype–phenotype maps while remaining sufficiently simple to allow for large-scale evolutionary studies on the system.
The basic idea is to build a deterministic hierarchical mapping, which in a sense encrypts a dynamical system representing the phenotype within a string (being the genotype). This approach separates the genotype, upon which the genetic variation operators act, from the phenotype that is under selection pressure. The dynamical system itself is a minimal version of a gene regulatory and metabolic network1 represented by a system of ordinary differential equations (ODEs).
2. Related work
Our model follows the spirit of related work in the area of artificial regulatory network (ARN) models. Kauffman (1993) used random Boolean networks (RBNs) to model gene regulatory networks. RBNs show a broad range of dynamical behaviour from cyclic and multiple attractors to chaos. However, most of these interesting dynamical features vanish if the updating rule for the temporal evolution of the network's state is changed from a synchronous to a biologically more realistic, asynchronous one. Moreover, RBNs show only a limited ability to structurally represent genes and genomes.
Reil (1999) introduced the concept of an artificial genome to overcome this structural weakness of RBNs. The artificial genome is essentially a biologically inspired representation of genes and their interactions. The model allows manipulation of the topology of the gene regulatory network at the level of the genome (implemented as string of digits) by a set of genetic variation operators that closely resemble their natural counterparts. This permits study of questions regarding the evolution of the ARN and its quantized Boolean dynamics from the point of view of the changing genome.
Dellaert & Beer (1996), Eggenberg (1997) and, later, Bongard (2002) embedded an ARN, analogously to Reil's approach, into a hand-coded morphogenetic system to evolve ‘multicellular’ objects capable of performing some predefined tasks. Bongard showed that within this framework, commonly termed artificial embryogeny (see Stanley & Miikkulainen (2003) for a recent review), gene reuse and modularity in terms of regulatory circuits can arise.
Banzhaf (2003a) refrained from the Boolean paradigm and expressed the dynamics of his ARN model in ODEs. Many dynamical phenomena of natural gene regulatory networks, i.e. point attractors, damped oscillations and heterochronic control (Banzhaf 2003b), are reproduced by the ARN model. By introducing an arbitrary ‘virtual’ binding site for a desired output function, networks could be evolved where the activation pattern of the virtual binding site follows a predefined mathematical function (Kuo et al. 2004). The model we propose differs from prior work with respect to the following points.
First, the competition of molecular species that bind to regulatory regions of genes is modelled explicitly in mass-action-governed elementary reactions. The reason for this decision lies in the facts that (i) competition for a common resource is obviously one of the core reactions in gene regulatory networks, which warrants an accurate mechanistic description, and (ii) mechanistic details can have unexpected consequences (Kholodenko & Westerhoff 1995) in terms of dynamic phenomena, especially if coarse-grained approximations, i.e. Michaelis–Menten type kinetics or concentration-weighted mean values, are used.
Second, the genome and the gene products are modelled entirely in RNA molecules. At the level of RNA secondary structure, efficient, well-established algorithms exist to compute nearly any desired molecular property. In particular, the statistical properties of the sequence to structure a map and its implications for the evolutionary process have been profoundly enlightened. Therefore, operations on RNA molecules, as used in the presented model, possess a certain degree of physical realism, which is lacking if binary- or real-valued vectors are used.
Third, molecular interactions, another key feature of gene regulatory networks, are modelled within the framework of RNA secondary structures. This approach provides us with a physically meaningful temperature-dependent energy function, which is not given for Hamming-distance-based approaches for bit strings.
Finally, the model is equipped with a minimal version of a metabolism and a simple membrane similar to that presented by Kennedy et al. (2001).
3. Model description
A basic requirement for a model to be suitable for studying evolution is to be self-contained in the sense that it does not require input of parameters on the fly. This has been achieved in the RNA model by defining rules that provide the frame for the computation of the required parameters. The development of our model pursues the same strategy. In particular, the decoding step is done in such a way that all the relevant parameters required to compute the time evolution of the dynamical system are calculated from within the model. This enables the individual system to freely explore genotype space2 by increasing its complexity without imposing limitations from the exterior. In molecular terms, the genotype is thought to be a DNA or an RNA molecule that is transcribed in pieces to yield RNA, which in turn is the source of various other molecules in the system. Two different scenarios are conceivable: (i) RNA is translated to yield protein molecules or processed to yield regulatory RNA molecules of the small interfering RNA type (McManus & Sharp 2002) or (ii) all molecular species of the gene regulatory and metabolic network are entirely represented as RNA molecules. There are no proteins involved in the second model and all regulatory and housekeeping functions are executed by ribozymes. Here, model (ii) is introduced. It is based on the empirical evidence that naturally occurring RNAs can fulfil a wide scope of different functions.
(a) The genotype–phenotype map
The genotype is represented by an RNA string of appropriate length. The genes that may overlap along the genome are structured as follows. The starting point of a gene is marked by a short sequence pattern that is reminiscent of the TATA box of eukaryotic genes. Upstream of this sequence pattern, two regulatory sites are located and in a downstream direction a fixed-length coding region follows (figure 1).
Figure 1.
Gene control structure of a typical gene in the proposed model. Upstream of the coding sequence (green) lies the promotor region or TATA box (red) and an upstream regulatory region (URR; blue), consisting of two transcription factor binding sites. The function of the gene transcript is determined by folding into secondary structures representing the different classes of functional RNAs.
Gene products fall into two major classes: (i) transcription factors (TFs) and (ii) structural RNAs. While the former constitute the gene regulatory network, the latter fulfil metabolic tasks. The function of a given RNA molecule is determined by means of an energy-based comparison with classes of target structures. The sequence is folded into all target structures yielding a series of free energy values, and the lowest free energy value determines the function of the molecule. Since the probabilities of the predefined target structures obtained by folding random sequences are easily computable, the distribution of functions in the ensemble of gene products can be influenced by choosing target structures of different probabilities. This approach is supported by the fact that the function of naturally occurring RNAs is commonly determined by the structure and not by the sequence. A point mutation in a gene may or may not alter the function of the transcript, depending on the degree of neutrality of the structure formed by the gene product. This procedure ensures a unique mapping (with the exception of a rare event that two folds of the sequence yield identical minimum free energies) and a tunable degree of redundancy. Thereby, the problems arising from direct encoding of the phenotype by the genotype (Bentley & Kumar 1999) are avoided. Both unique assignment and high degree of redundancy increase the accessibility of phenotypes, leading to an increased evolvability of the population (Ebner et al. 2001). The latter effect is well known from simulation of RNA optimization, where GC-only sequences are much harder to optimize by evolution than AUGC sequences because they have a lower degree of neutrality (Schuster & Stadler 2006; for a discussion on the parallels of the evolutionary search on neutral networks between RNA and genetic programming, we refer the reader to Banzhaf & Leier 2006).
(b) The gene regulation
TFs are grouped further into two types: activators and repressors. These molecules bind to one of the two binding sites in the upstream regulatory region (URR) of the gene. The activity of the gene is regulated by the fraction of repressors or activators bound to the URR. For modelling the transcriptional activity, we apply the common three-state-‘regulated recruitment mechanism’ observed with bacterial genes (Ptashne & Gann 2002): (i) free genes are transcribed at a low basal rate, (ii) genes with activators bound to the regulatory region are transcribed at high rate, and (iii) genes with bound repressors are silenced. The transcription rate itself also depends on the concentration of active nucleotides; the analytic expression of the dependence was adopted from the mechanism of RNA replication by the replicase of the phage Qβ (Biebricher et al. 1983).
In order to regulate transcription, the binding affinities of the whole ensemble of TFs have to be transformed into a gene activity signal that falls into one of the three transcription states: basal, active, and silenced. Since the structure of the regulatory network itself should be a target of evolution, a model based on molecular interactions is required that decides upon two questions: (i) which TF binds to the distinct URR of the gene and (ii) to what extend is the URR bound by the different TFs? Heteroduplex formation or RNA–RNA hybridization (Dimitrov & Zuker 2004; Bernhart et al. 2006) is used to quantify the binding strength of a given TF to a given regulatory site. The free binding energies computed in this way can be used directly to calculate dissociation constants and, under the assumption that association of the TF–URR complex is limited by diffusion, rate constants for complex formation and dissociation. Since computation of binding constants is straightforward, the topology of the genabolic network is readily recalculated if some of the genes in the network changed sequence upon action of the genetic variation operators on the genome.
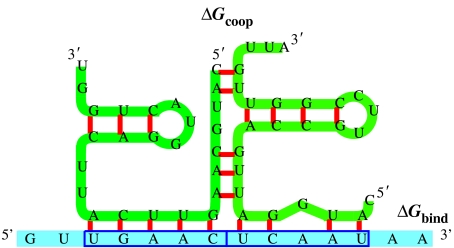
The definition of the model parameters provides an opportunity to design more complex regulatory mechanisms. As an example, we present the consideration of cooperativity in TF binding. There are several possibilities to introduce cooperativity: (i) the effector molecule itself is a dimer, tetramer or even higher aggregate, and oligomer formation is a cooperative process or (ii), alternatively, two molecules bind to the binding sites within the URR and a stabilizing interaction between the two ligands leads to cooperative binding as sketched in figure 2. Whereas the first phenomenon leading to cooperativity is well known in biophysics, the direct cooperative interaction between two bound molecules has been studied much less frequently. For this reason, we performed a large-scale investigation with random RNA sequences. Two molecules were bound to the two URR binding sites and they are cofolded under the constraint in such a way that their structures bound to the URR sites are preserved. A negative free energy leads to an additional stabilization of the TF–URR complexes and results in cooperative binding (table 1). The results in the table present a ‘proof of concept’ of our model for cooperative interactions. A reasonable fraction of random sequences with sufficient GC content are suitable as regulators with cooperative interactions since they form stable aggregates. The fraction of stable complexes with only AU base pairs is very low. Pure AU sequences are characterized by relatively high free energies of cooperative binding but very low energies of interaction with the URR. In pure GC sequences, we find reasonably strong binding to the URR and cooperativity of the same order of magnitude. Mixed sequences may be preferable since they have acceptable binding strength with still dominating cooperativity. The energetic differences between heterodimers and homodimers (self-cooperativity in table 1) are negligibly small.
Figure 2.
Cooperativity as modelled in the presented framework. Two TFs bind to the URR. The stabilizing free energy between the two functional structures enters additively into the regulatory mechanism. ΔGcoop and ΔGbind, see table 1 legend.
Table 1.
Binding energies of random RNA pairs of length 25 to 2 URR RNAs of length 5. (Different base compositions in the short RNA sequences from pure AU to pure GC were studied. The free energies for cooperative interaction (ΔGcoop) are calculated for the conformations of lowest free binding energies (ΔGbind) as indicated in figure 2 and given with the standard deviation.)
| sequence (%AU) | sample (no. of URR) | sample size: sequence pairs | heterocooperativity | self-cooperativity | ||||
|---|---|---|---|---|---|---|---|---|
| stable (%) | −ΔGcoop (kcal mol−1) | −ΔGbind (kcal mol−1) | stable (%) | −ΔGcoop (kcal mol−1) | −ΔGbind (kcal mol−1) | |||
| 100 | 11 | 1 000 000 | 0.1±0.1 | 3.13±2.26 | 0.32±0.22 | 0.2±0.3 | 4.00±2.77 | 0.32±0.21 |
| 90 | 56 | 824 301 | 1.0±1.2 | 3.02±2.21 | 0.58±0.55 | 0.9±1.1 | 3.71±2.65 | 0.72±0.68 |
| 80 | 223 | 364 473 | 8.8±9.2 | 2.90±2.15 | 0.87±0.76 | 7.5±8.5 | 3.53±2.57 | 0.92±0.78 |
| 70 | 557 | 163 760 | 18.4±12.7 | 2.85±2.12 | 1.14±0.98 | 14.2±10.1 | 3.35±2.46 | 1.17±0.99 |
| 60 | 1021 | 62 027 | 31.6±14.3 | 2.80±2.10 | 1.45±1.17 | 23.9±11.7 | 3.24±2.39 | 1.47±1.18 |
| 50 | 1265 | 28 598 | 42.7±13.3 | 2.78±2.08 | 1.74±1.35 | 32.2±11.8 | 3.20±2.35 | 1.74±1.32 |
| 40 | 1007 | 16 860 | 53.8±11.0 | 2.75±2.07 | 2.09±1.50 | 41.6±10.9 | 3.17±2.33 | 2.03±1.45 |
| 30 | 574 | 14 305 | 60.9±9.6 | 2.75±2.07 | 2.43±1.66 | 48.4±10.2 | 3.21±2.34 | 2.33±1.59 |
| 20 | 238 | 13 105 | 65.7±8.6 | 2.75±2.06 | 2.69±1.76 | 54.0±9.6 | 3.27±2.37 | 2.55±1.67 |
| 10 | 35 | 12 054 | 70.9±7.0 | 2.76±2.07 | 3.07±1.91 | 58.9±9.1 | 3.31±2.39 | 2.85±1.80 |
| 0 | 8 | 11 860 | 73.3±8.4 | 2.85±2.11 | 3.51±2.07 | 66.0±4.1 | 3.67±2.63 | 3.29±1.98 |
(c) The metabolism
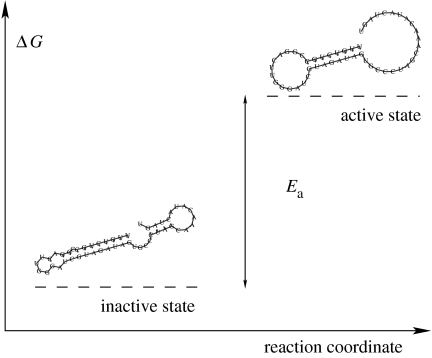
The metabolic RNAs are ribozymes that are capable of catalysing either a chemical reaction that activates a mediator molecule or a reaction that transforms membrane precursor molecules into membrane building molecules (figure 3). The active mediator, in turn, transfers energy to monomeric building blocks and converts it into active species, which can be directly used for transcription (or transcription and translation in case we use a model with mRNAs and proteins). Eventually we end up with biopolymers, RNAs (or RNAs and proteins), which may enhance their own production by producing more ribozymes in the manner of an auto-catalytic cycle. Catalysts are assumed to require specific predefined structural elements. The catalytic efficiency of a molecule in the catalysis of a metabolic reaction is derived from the activating energy Ea=ϵn−ϵ0 that is required for the transition from the minimum free energy structure into the (lowest) suboptimal state, Sn, which carries the required element and constitutes the active form of the ribozyme (figure 4). This concept for the evaluation of catalytic efficiency can also be interpreted as a distance measure between structures on an energy scale. It is preferred here over simpler distance measures like the Hamming-distance-based string comparison methods, because it retains the useful and realistic statistical properties of the RNA sequence to the secondary structure map, as exemplified by the evolutionary fitness landscape (Fontana & Schuster 1998a,b). Moreover, the activation concept allows for an optimization of the catalytic efficiencies of ribozymes through accumulation of mutations that reduce Ea by stabilizing the suboptimal structure Sn relative to the minimum free energy conformation S0. Ideally, if their minimum free energy structure S0 is identical to the target structure Sn, then exp(Ea/RT)=1, and the ribozyme catalyses mediator activation at maximum velocity.
Figure 3.
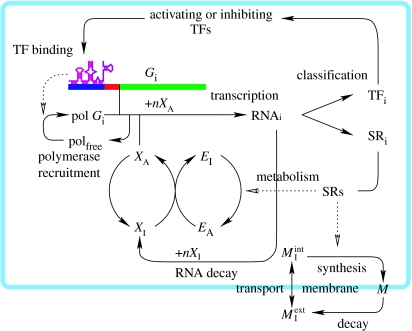
A sketch of the chemical reaction network of the presented model. The RNA polymerase is assumed to be available in a fixed amount and recruited to the gene (green) promoter region (red) at a rate determined by the TFs bound to the URR (blue). The RNA transcription rate depends on the concentration of activated RNA building blocks (XA) and consumes nXA per RNA. The RNAs decay to inactivated components (XI), which are reactivated via consumption of activated, energy-rich metabolites (EA). The gene products are categorized into structural (SR) and gene regulatory (TF) RNAs. The SRs catalyse the activation of metabolites (EI) and the incorporation of membrane building blocks into the membrane (M). The internal pool of is coupled with the exterior pool via diffusion through the membrane. All the parameters for transcription factor binding to regulatory regions and the catalytic efficiencies of structural proteins are obtained by a mapping process (see text for details), and are therefore targets of evolution.
Figure 4.
Activation of the ribozyme. The active structure catalyses the metabolic reactions. The catalytic efficiency of the ribozyme is derived from the free energy that is required to form the secondary structure of the active ribozyme from the minimal free energy secondary structure of the RNA.
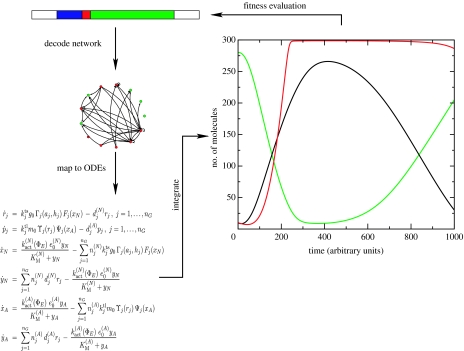
After the determination of the parameters by the respective mapping, the genabolic network is translated into a set of ODEs. In order to describe the system in a general and easily accessible format, it is implemented in the widely used systems biology markup language (SBML; Hucka et al. 2003). From the concentration time course, fitness values can be deduced to drive an evolutionary optimization procedure (figure 5). The integrator front-end currently used is the SBML–ODE Solver, a versatile integrator for continuous ODE systems (Machné et al. 2006). Owing to the use of SBML a variety of integrators and analysis software can easily be adopted and a flexible handling is facilitated.
Figure 5.
Schematic of an evolutionary cycle. The topology of the genabolic network together with the reaction parameters is ‘decoded’ from the genotype. This information is translated into an ODE system, which after numeric integration provides the concentration time course of the individual chemical species (the phenotype) that in turn modulates via a fitness function the reproductive efficiency of the genome.
4. Results
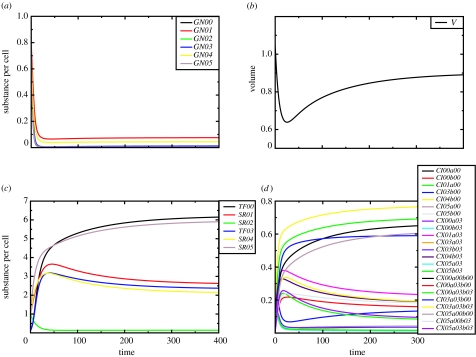
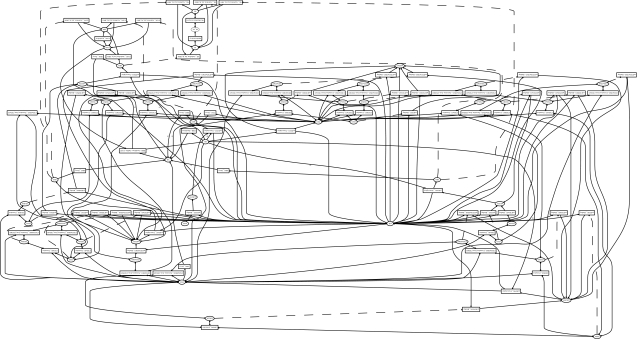
Mutation studies without selection have already been performed, and they show that a sufficiently high fraction of mutations gives rise to viable regulatory networks. To test the capabilities of the model, we designed the following experiment. We ask the question, is a cell with an initial random genome capable of adapting its cell volume to a predefined target volume during a mutational adaptive walk? Figure 6 shows the dynamical behaviour of the final cell of the adaptive walk. The balance between regulatory and metabolic dynamics indeed adjusts the cell's volume exactly to the target volume. Figure 7 shows the respective gene regulatory and metabolic reaction network.
Figure 6.
Integrated time course of a cell evolved via an adaptive walk targeting a cell volume of 1. (a) Free genes, (b) volume, (c) RNAs and (d) gene–TF complexes. A genome of length 100 and a gene length of 20 nucleotides were chosen. URR length was 5 per site and the promoter sequence motif was CC. Genes, transcription factors and ribozymes are labelled GN, TF and SR. The TF–gene complexes are labelled either CX or CI for activating or inhibiting complexes, respectively. The first index denotes the gene, and letters a and b indicate the sites the transcription factors bind to.
Figure 7.
Reaction network of the cell in figure 6. The actual hyper graph is displayed in the König representation as a bipartite graph. Rectangular nodes indicate reactions and circular nodes represent chemical species.
There is also a substantial fraction of neutral mutations, which was found to be a conditio sine qua non for efficient evolutionary optimization (Huynen et al. 1996; Fontana & Schuster 1998a,b). In order to study evolutionary phenomena, we also have to consider genome replication and variation (mutation and/or recombination). The secondary structure computations can be readily extended to DNA–DNA and DNA–RNA interactions since the same folding routines can be used with other sets of empirical parameters (SantaLucia et al. 1996; SantaLucia 1998). The evolutionary evaluation of different genabolic networks is based on their fitness that results from a sophisticated interplay of replication rate and metabolic efficiency.
5. Conclusions and outlook
With the presented model at hand, several pending problems can be approached. The encryption of all relevant system information within a string genome allows the description and evolution of genabolic networks in an entirely independent fashion. No external sources of additive information are necessary; the system is self-determined and closed as far as rules and system-sustaining model functions are concerned. In contrast to prior exclusively RNA-based auto-catalytic systems, the genotype and the phenotype in the presented model constitute separate objects. This allows an unhindered evolvability of the minimal cell on the way from a random dynamical network to an adapted functional system.
Owing to the regulatory mechanisms implemented, in particular the direct interaction of the TFs in a cooperative manner, the model allows for studies of the evolution of a great variety of regulatory networks. Experiments regarding an optimization of certain qualities or functions, for example high adaptability, high robustness, insensitivity to environmental stress, are conceivable.
The natural selection criterion is a short time of self-reproduction for the individual system. This reproduction efficiency will be a function of the cell's replication machinery and the cellular metabolism. Our model encodes all these features in the genome and the system itself unfolds the phenotype. One way is the use of a growing cell membrane as an indicator for cell growth and replication. This approach includes an explicitly modelled membrane as described, for example, in the chemoton systems (Gantí 1975). At a certain size and concentration of the cell components, the individual is ready for cell division, giving an additional input to the fitness measure for selection.
Further extensions of the system are easily implemented by the modular SBML format. Several aspects are of special interest. The extension of the system to a second class of biomolecules and, for this goal, lattice proteins with monomer sequences encoded in the transcribed structural molecules would be an excellent candidate. The introduction of membrane-bound transporter molecules that are responsible for the exchange of high- and low-energy compounds fuelling the minimal cell would allow a direct interaction with the environment. A further evolutionary step, the adaptation of the transporter to operate on a larger variety of molecules, is likely to enable cell–cell communication. SBML, on the other hand, also supports the idea of a compartmentalization of this model. This would enable a spatial separation of different metabolic processes in a manner that is closer to physiology.
Acknowledgments
This work was supported in part by the Wiener Wissenschafts-, Forschungs- und Technologiefonds (WWTF) project number MA05.
One contribution of 13 to a Theme Issue ‘Towards the artificial cell’.
Endnotes
Since gene regulation and metabolic control is intimately coupled in cellular dynamics, we suggest to use the term genabolic network for the functional combination of genetics and metabolism.
Depending on the question to be addressed by the simulation, the genotype space can be restricted to all (4n) polynucleotide sequences of constant chain lengths n or the length may vary with insertion and deletion operators acting on genotypes.
References
- Banzhaf, W. 2003a On the dynamics of an artificial regulatory network. In Advances in Artificial Life—Proc. 7th Eur. Conf. Artificial Life (ECAL'03), Dortmund, Germany, September 14–17 (eds W. Banzhaf, T. Christaller, P. Dittrich, J. T. Kim & J. Ziegler), pp. 217–227. Berlin, Germany: Springer.
- Banzhaf W. Kluwer Academic Publishers; Dordrecht, The Netherlands: 2003b. Artificial regulatory networks and genetic programming. ch. 4. [Google Scholar]
- Banzhaf W, Leier A. Kluwer Academic Publishers; Dordrecht, The Netherlands: 2006. Evolution on neutral networks in genetic programming. ch. 14. [Google Scholar]
- Banzhaf W, Miller J. Kluwer Academic Publishers; Dordrecht, The Netherlands: 2004. The challenge of complexity. ch. 1. [Google Scholar]
- Bentley, P. & Kumar, S. 1999 Three ways to grow designs: a comparison of embryogenies for an evolutionary design problem. In Genetic and Evolutionary Computation Conf. (GECCO'99) Orlando, Florida USA, July 14–17 (ed. W. Banzhaf), pp. 35–43.
- Bernhart S.H, Tafer H, Mückstein U, Flamm C, Stadler P.F, Hofacker I.L. Partition function and base pair probabilities of RNA heterodimers. Algo. Mol. Biol. 2006;1:3. doi: 10.1186/1748-7188-1-3. doi:10.1186/1748-7188-1-3 [DOI] [PMC free article] [PubMed] [Google Scholar]
- Biebricher C.K. In: Darwinian selection of self-replicating RNA molecules. Evolutionary biology. Hecht M.K, Wallace B, Prance G.T, editors. vol. 16. Plenum Publishing Corporation; New York, NY: 1983. pp. 1–52. [Google Scholar]
- Biebricher C.K, Gardiner W.C. Molecular evolution of RNA in vitro. Biophys. Chem. 1997;66:179–192. doi: 10.1016/s0301-4622(97)00059-8. doi:10.1016/S0301-4622(97)00059-8 [DOI] [PubMed] [Google Scholar]
- Biebricher C.K, Eigen M, Gardiner W.C. Kinetics of RNA replication. Biochemistry. 1983;22:2544–2559. doi: 10.1021/bi00279a036. doi:10.1021/bi00279a036 [DOI] [PubMed] [Google Scholar]
- Bongard, J. 2002 Evolving modular genetic regulatory networks. In Proc. IEEE 2002 Congress on Evolutionary Computation (CEC'02), Honolulu, HI USA, May 12–17, vol. 2, pp. 1872–1877. New York, NY: IEEE Press.
- Davidson E.H. Academic Press; London, UK: 2001. Genomic regulatory networks. [Google Scholar]
- Dellaert, F. & Beer, R. D. 1996 A developmental model for the evolution of complete autonomous agents. In From Animals to Animates 4: Proc. 4th Conf. Simulation of Adaptive Behavior, Cape Cod, Massachusetts USA, September 9–13 (eds P. Maes, M. J. Mataric, J.-A. Meyer, J. Pollack & S. W. Wilson). Cambridge, MA: MIT Press.
- Dimitrov R.A, Zuker M. Prediction of hybridization and melting for double-stranded nucleic acids. Biophys. J. 2004;87:215–226. doi: 10.1529/biophysj.103.020743. doi:10.1529/biophysj.103.020743 [DOI] [PMC free article] [PubMed] [Google Scholar]
- Ebner M, Shackleton M, Shipman R. How neutral networks influence evolvability. Complexity. 2001;7:19–33. doi:10.1002/cplx.10021 [Google Scholar]
- Eggenberg, P. 1997 Evolving morphologies of simulated 3d organisms based on differential gene expression. In Proc. 4th Eur. Conf. Artificial Life (ECAL'97)London, UK, September 9–13 (eds P. Husbands & I. Harvey). Cambridge, MA: MIT Press.
- Fontana W. Modelling ‘Evo-Devo’ with RNA. BioEssays. 2002;24:1164–1177. doi: 10.1002/bies.10190. doi:10.1002/bies.10190 [DOI] [PubMed] [Google Scholar]
- Fontana W, Schuster P. Continuity in evolution: on the nature of transitions. Science. 1998a;280:145–165. doi: 10.1126/science.280.5368.1451. doi:10.1126/science.280.5368.1451 [DOI] [PubMed] [Google Scholar]
- Fontana W, Schuster P. Shaping space. The possible and the attainable in RNA genotype–phenotype mapping. J. Theor. Biol. 1998b;194:491–515. doi: 10.1006/jtbi.1998.0771. doi:10.1006/jtbi.1998.0771 [DOI] [PubMed] [Google Scholar]
- Gantí T. Organization of chemical reactions into dividing and metabolizing units: the chemotons. Biosystems. 1975;7:15–21. doi: 10.1016/0303-2647(75)90038-6. doi:10.1016/0303-2647(75)90038-6 [DOI] [PubMed] [Google Scholar]
- Hucka M, et al. The systems biology markup language (SBML): a medium for representation and exchange of biochemical network models. Bioinformatics. 2003;19:524–531. doi: 10.1093/bioinformatics/btg015. doi:10.1093/bioinformatics/btg015 [DOI] [PubMed] [Google Scholar]
- Huynen M.A, Stadler P.F, Fontana W. Smoothness within ruggedness: the role of neutrality in adaptation. Proc. Natl Acad. Sci. USA. 1996;93:397–401. doi: 10.1073/pnas.93.1.397. doi:10.1073/pnas.93.1.397 [DOI] [PMC free article] [PubMed] [Google Scholar]
- Kauffman S.A. Oxford University Press; Oxford, UK: 1993. The origin of order. [Google Scholar]
- Kennedy P.J, Osborn T.R, model A. A model of gene expression and regulation in an artificial cellular organism. Complex Syst. 2001;13:33–59. [Google Scholar]
- Kholodenko B.N, Westerhoff H.V. The macroworld versus the microworld of biochemical regulation and control. Trends Biochem. Sci. 1995;20:52–54. doi: 10.1016/s0968-0004(00)88955-0. doi:10.1016/S0968-0004(00)88955-0 [DOI] [PubMed] [Google Scholar]
- Kuo, D. P., Leier, A. & Banzhaf, W. 2004 Evolving dynamics in an artificial regulatory network model. In Proc. Paralell Problem Solving from Nature Conf vol. LNCS 3242, pp. 571–580. Berlin, Germany: Springer.
- Machné R, Finney A, Müller S, Lu J, Widder S, Flamm C. The SBML ODE Solver library: a native API for symbolic and fast numerical analysis of reaction networks. Bioinformatics. 2006;22:1406–1407. doi: 10.1093/bioinformatics/btl086. doi:10.1093/bioinformatics/btl086 [DOI] [PubMed] [Google Scholar]
- McManus M.T, Sharp P.A. Gene silencing in mammals by small interfering RNAs. Nat. Rev. Genet. 2002;3:737–747. doi: 10.1038/nrg908. doi:10.1038/nrg908 [DOI] [PubMed] [Google Scholar]
- Ptashne M, Gann A. Cold Spring Harbor Laboratory Press; Cold Spring Harbor, NY: 2002. Genes & signals. [Google Scholar]
- Reil, T. 1999 Dynamics of gene expression in an artificial genome-implications for biological and artificial ontogeny. Advances in Artificial Life—Proc. 5th Eur. Conf. Artificial Life (ECAL'99), 1674, pp. 457–466.
- SantaLucia J., Jr A unified view of polymer, dumbbell, and oligonucleotide DNA nearest-neighbor thermodynamics. Proc. Natl Acad. Sci. USA. 1998;95:1460–1465. doi: 10.1073/pnas.95.4.1460. doi:10.1073/pnas.95.4.1460 [DOI] [PMC free article] [PubMed] [Google Scholar]
- SantaLucia J, Jr, Allawi H.L, Seneviratne P. Improved nearest-neighbor parameters for predicting DNA duplex stability. Biochemistry. 1996;35:3555–3562. doi: 10.1021/bi951907q. doi:10.1021/bi951907q [DOI] [PubMed] [Google Scholar]
- Schuster P. Evolution in silico and in vitro: the RNA model. Biol. Chem. 2001;382:1301–1314. doi: 10.1515/BC.2001.162. doi:10.1515/BC.2001.162 [DOI] [PubMed] [Google Scholar]
- Schuster P. A testable genotype–phenotype map: modeling evolution of RNA molecules. In: Lässig M, Valleriani A, editors. Biological evolution and statistical physics. Springer; Berlin, Germany: 2002. pp. 56–83. [Google Scholar]
- Schuster P. Molecular insight into the evolution of phenotypes. In: Crutchfield J.P, Schuster P, editors. Evolutionary dynamics—exploring the interplay of accident, selection, neutrality, and function. Oxford University Press; New York, NY: 2003. pp. 163–215. [Google Scholar]
- Schuster P, Stadler P.F. Modelling conformational flexibility and evolution of structure—RNA as an example. In: Blastolla U, Porto M, Roman H.E, Vendruscolo M, editors. Structural approaches to sequence evolution: molecules, networks, populations. Biological and medical physics, biomedical engineering. Springer; Berlin, Germany: 2006. pp. 1–34. ch. 1. [Google Scholar]
- Schuster P, Fontana W, Stadler P.F, Hofacker I.L. From sequences to shapes and back: a case study in RNA secondary structure. Proc. R. Soc. B. 1994;255:279–284. doi: 10.1098/rspb.1994.0040. doi:10.1098/rspb.1994.0040 [DOI] [PubMed] [Google Scholar]
- Stanley K.O, Miikkulainen R. A taxonomy for artificial embryogeny. Artif. Life. 2003;9:93–130. doi: 10.1162/106454603322221487. doi:10.1162/106454603322221487 [DOI] [PubMed] [Google Scholar]


