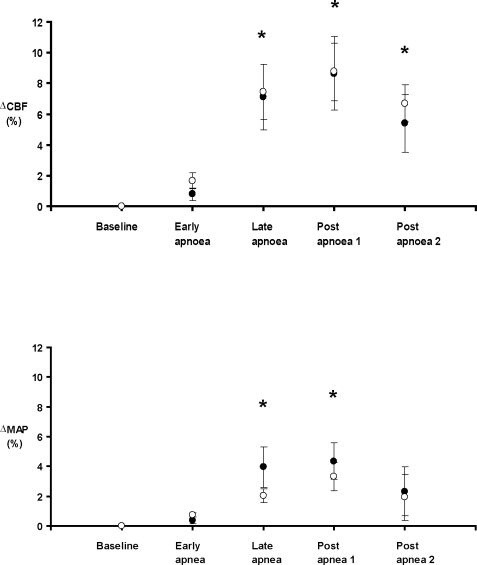
Figure 2.
Mean (± SEM) change in coronary blood flow (CBF) and mean arterial blood pressure (MAP) from baseline over the course of the apnea cycle, at baseline (•) and post treatment (○) with lipopolysaccharide (LPS). * P < 0.05 compared to baseline for each condition. No difference between pre-LPS and post-LPS (2-way repeated measures ANOVA).

