Abstract
It is unknown whether or not tight junction formation plays any role in morula to blastocyst transformation that is associated with development of polarized trophoblast cells and fluid accumulation. Tight junctions are a hallmark of polarized epithelial cells and zonula occludens-1 (ZO-1) is a known key regulator of tight junction formation. Here we show that ZO-1 protein is first expressed during compaction of 8-cell embryos. This stage-specific appearance of ZO-1 suggests its participation in morula to blastocyst transition. Consistent with this idea, we demonstrate that ZO-1 siRNA delivery inside the blastomeres of zona-weakened embryos using electroporation not only knocks down ZO-1 gene and protein expressions, but also inhibits morula to blastocyst transformation in a concentration dependent manner. In addition, ZO-1 inactivation reduced the expression of Cdx2 and Oct-4, but not ZO-2 and F-actin. These results provide the first evidence that ZO-1 is involved in blastocyst formation from the morula by regulating accumulation of fluid and differentiation of nonpolar blastomeres to polar trophoblast cells.
Keywords: Murine embryo, Morula, Blastocyst, Blastomere, Electroporation, Tight junction, Zonula occludens-1
Introduction
Normal preimplantation embryonic development to the blastocyst stage is critical to the process of initiation of implantation and pregnancy. Any defects in blastocyst formation lead to defective implantation and infertility. Considering this crucial role of the blastocyst, it is not clearly understood how a blastocyst is formed from a morula stage embryo. Following fertilization of oocytes by sperm, one-cell embryos undergo successive mitotic cell divisions that direct them to develop to 2-cell, 4-cell, 8-cell, 16-cell (morula) and 32- or more-cell (blastocyst) stages. Soon after development of the 8-cell embryo in the mouse, the blastomeres begin to form junctions with one another, leading to formation of the morula. The morula then undergoes differentiation to the blastocyst stage where a fluid-filled blastocoel appears within the embryo. The blastocyst stage is a milestone in embryonic life because it has two distinctive cell lineages and gains the ability to implant. The outer polar single-celled layer of an early blastocyst is known as the trophectoderm (TE) that surrounds the blastocoel and a small cluster of nonpolar cells called the inner cell mass (ICM). Later, the ICM gives rise to two more cell lineages, the epiblast and the primitive endoderm (PE) or hypoblast at the late blastocyst stage. Differentiation of blastomeres is important because following blastocyst implantation trophoblast cells go on to contribute the fetal components of the placenta, while cells of the ICM and hypoblast form the fetus and yolk sac (Johnson and McConnell, 2004; Yamanaka et al., 2006) respectively.
Most of our current knowledge on the mechanism of blastocyst formation has come from studies performed in mouse embryos. These studies have revealed that blastocyst formation involves a complex series of events occurring in a precise temporal sequence. Since preimplantation stage embryos grow well in defined culture media made of balanced salt solution outside the reproductive tract, factors produced by embryos at various stages of their development are considered to be important for embryos to achieve the blastocyst stage. Emerging evidence indicates that blastocyst formation occurs as a result of gradual polarization of certain blastomeres as the 8-cell stage embryo undergoes compaction and morula stages of their development (Johnson and McConnell, 2004). Polarization of some blastomeres is established by junction formation between cells at their lateral surface (Ziomek and Johnson, 1980; Fleming et al., 2001). Among these junctions, notables are adherens and tight junctions. These junctions are made of multi-protein complexes and connect cells at their lateral surfaces generating a layer of polarized cells that line cavities and tissues (Farquhr and Palade, 1963).
E-cadherin, an integral membrane component of the adherens junction, is necessary for formation of the trophectoderm epithelium since E-cadherin null embryos undergo compaction but fail to form blastocysts with trophoblast cells. Interestingly, however, E-cadherin null embryos undergo trophoblast outgrowth in vitro suggesting at least part of the differentiation program for epithelial biogenesis occurs in E-cadherin null embryos (Larue et al., 1994). The question then naturally arises as to the contribution of the tight junction in the formation of a blastocyst with trophectodermal epithelium. Previous studies have demonstrated that the tight junction is a complex seal between adjoining epithelial cells. It is considered to be at least bifunctional: it limits the diffusion of solutes through the paracellular pathway (barrier function) and maintains epithelial cell polarity building a fence between the apical and basolateral membranes (fence function). The integral membrane proteins of the tight junction are occludin and claudins. The peripheral membrane proteins of tight junctions are ZO-1, ZO-2 and ZO-3 (Tsukita et al., 2001). Among these TJ proteins, the temporal and spatial expression patterns of occludin and ZO-1 have been investigated at different stages of preimplantation development. While occludin and ZO-1α+ are first assembled at cell-cell membrane contact sites between blastomeres in the late morula stage (Sheth et al., 1997, 2000), ZO-1α− is initially noted as punctate sites at the cell-cell contacts of compacted 8-cell stage embryos (Fleming et al., 1989; Sheth et al., 1997) . The timing of occludin and ZO-1α+ expression in late morulae indicates that they are probably involved in the final events of morula to blastocyst formation (Sheth et al., 1997, 2000). Preimplantation embryos devoid of occludin, ZO-2 or ZO-3 developed normally to the blastocyst stage suggesting that this protein is dispensable for morula to blastocyst transformation (Saitou et al., 2000; Adachi et al., 2006; Xu et al., 2008). However, there is no functional study to show whether or not ZO-1 is needed for blastocyst formation.
To study the importance of ZO-1 during the time of blastocyst formation we report the knock-down of endogenous ZO-1 gene expression in late-stage mouse embryos using small interfering RNAs (siRNA) against ZO-1. When early 8-cell embryos were electroporated with ZO-1 siRNAs, these embryos developed to the morula stage with reduced or no expression of membranous ZO-1 protein but did not undergo blastocyst formation within 24 hours of culture. These results suggest that ZO-1 protein may be necessary to maintain the integrity of the trophectoderm layer that is essential for cellular and fluid compartment formation in blastocysts.
Materials and Methods
Animals
Adult male and female CD-1 mice were purchased from Charles River Laboratories (Wilmington, MA). They were kept in a light-dark cycle (14h light:10h dark) in the Laboratory Animal Facility of the Vanderbilt University (Nashville, TN) with unlimited access to water and food according to the Institutional guidelines on the care and use of laboratory animals.
Embryo collection and culture
Female mice were paired overnight with fertile males of the same strain. Finding of a copulation plug the following morning indicated the 1st day (day 1) of pregnancy. Preimplantation embryos from 2-cell to blastocyst stages [2-cell (day 2 at 0900 h from oviducts); 4-cell (day 3 at 0300 h from oviducts); 8-cell (day 3 at 1030 and 1300 h from oviducts); early morula (day 3 at 1800 from oviducts), late morula (day 4 at 0100 h from oviducts and uteri) and blastocysts (day 4 at 0900 h from uteri)] were collected by flushing oviducts and uteri (Paria et al., 1993) with potassium simplex optimized medium with amino acids (KSOMaa) (Lawitts and Biggers, 1991). All medium components were purchased from Sigma (St. Louis, MO) unless stated otherwise. Embryos were cultured in groups of 6–10 in microdrops (25 µl) of KSOMaa under silicon oil in a humidified atmosphere of 5% CO2/95% air at 37°C (Paria and Dey, 1990).
Optimization of Mouse Embryo Electroporation (EP) Parameters
We first standardized the method of electroporation using the cell fusion instrument (BTX, ECM 2001; San Diego, CA) that can effectively introduce siRNA inside a zona-encased embryo. Since the normal embryo is protected by zona pellucida, we decided to use the siPORT™ (AM8990 or AM8990G; Ambion, Austin, TX) as an electroporation buffer because this buffer is developed for transfecting siRNA into hard-to-transfect cells and has components to ensure high cell viability and enhanced delivery of siRNAs. Using this buffer, we next standardized the electroporation parameters such as voltage, number of pulses, pulse duration and repeats. The embryos were electroporated in a flat electrode chamber supplied by BTX Inc. The post electroporation embryo survival rate and developmental potentials were chosen as the end-point measurements. First, we determined the DC voltage (DCV) requirement for electroporation using 2-cell and 8-cell embryos by passing a series of DC voltage (from 20–100 DCV with 10 V intervals) while setting the 1 ms pulse length, 1 pulse number and 0 repeats. In our initial studies we used 2-cell stage embryos to test the electroporation instrument because previous reports have demonstrated that application of electric field causes blastomere fusion at the 2-cell stage (Cheong et al., 1991). Based on the over 50% embryo survival rate and blastocyst formation rate of cultured electroporated embryos, an optimized DCV was selected for testing other electroporation parameters (i.e. pulse length, pulse number and repeats). We next established other electroporation parameters keeping DCV unchanged. After repeated trials, we optimized an electroporation condition (DC 20 V; 1ms, 3 pulses, 0 repeat) that we later applied to examine the incorporation of siRNA in zona weakened 2- and early 8-cell embryos using Silencer®Cy3-labeled negative siRNA control #1 (Cat. no: 4621; Ambion). Following electroporation, the embryos were cultured in vitro in KSOMaa and checked for their survival and the presence of Cy3 florescence inside blastomeres at 24 h intervals.
Embryo electroporation with custom siRNA
Freshly collected early 8-cell stage embryos were washed thoroughly and incubated ≈10–12 seconds in prewarmed acid Tyrode’s solution (T1788, Sigma) to weaken the zona pellucida (Grabarek et al., 2002) rather than remove it. These embryos were then transferred to and kept in the pre-made KSOMaa drops in a Petri dish covered with silicon oil. At the same time, the cell fusion instrument was turned on and siRNA stocks were diluted in siPORT™ electroporation buffer (AM8990 or AM8990G; Ambion) before electroporation. While Silencer® negative control #1 (cat. no: 4611; Ambion) was used as siRNA control, the blank siPORT™ electroporation buffer was used as electroporation control. The negative control siRNA is comprised of a 19bp scrambled sequence with 3’ dt overhang. These sequences have no significant homology to any known gene sequences of mouse, rat or human and have no non-specific effects on gene expresssion (information provided by the Ambion Company).
The custom-made ZO-1 siRNA (mouse; Cat. no. sc-29832; Santa Cruz Biotechnology, Santa Cruz, CA) were first prepared as a stock solution according to the instructions provided by the manufacturer, and kept at −20°C. Right before electroporation, the ZO-1 siRNA was diluted into different concentrations in siPORT™ electroporation buffer. A suitably sized drop of the diluted siRNA solution was added between the two electrodes fixed in an electroporation chamber. The embryos were linearly arranged in the chamber so that they were equidistant between the two electrodes with about equal space interval between the two neighboring embryos. A series of direct electrical square pulses (i.e. 20 DC voltage/1ms pulse length/ 3 pulses/ 0 repeats) were given to the embryos. After electroporation, the embryos were washed and cultured in fresh KOSM-aa media. Approximately 2 h after electroporation, embryos were observed for their survival under a Nikon SMZ800 stereo microscope. All apparently non-degenerating embryos were cultured in vitro for 24 h to 48 h to study their subsequent development. Experiments were repeated several times and stages of embryonic development were checked at 24 h intervals and photographed. A group of electroporated embryos after culture for 24 h were processed for immunofluorescence staining for ZO-1 and E-cadherin protein expression.
Determination of cell number
Embryos from each treatment group were treated at the end of each experiment with DAPI (4’, 6’-diamidino-2-phenylindole; 10 µg/ml) for 30 minutes at room temperature in a humidified chamber. Following DAPI treatment, embryos were washed with phosphate-buffered saline (PBS), mounted onto glass slides and examined under a fluorescence microscope.
Immunofluorescence detection of E-cadherin, ZO-1, ZO-2, Caudal-related homeobox 2 (Cdx2), POU-family transcription factor, Oct-4, and filamentous-actin (F-actin) in embryos
The primary antisera used included a rat monoclonal E-cadherin antibody, a generous gift from Dr. Rolf Kemler, Max-Planck-Institut for Immunbiologie, Freiburg, German), a rabbit polyclonal ZO-1 antibody (cat. no: 61-7300, Zymed Laboratories Inc.) that detects ZO-1α− and ZO-1α+ isoforms, a rabbit polyclonal anti-ZO-2 (cat. no. 71-1400, Zymed Laboratories Inc.), a mouse monoclonal anti-Cdx2 (cat. no. MU-392A-UC, BioGenex), and a goat polyclonal anti-Oct-4 (cat. no. SC-8628, Santa Cruz Biotechnology). Embryos were first fixed in 4% paraformaldehyde in PBS containing 0.2% BSA for at least 30 min and washed twice in fresh PBS. Fixed embryos were then permeabilized (PBS with 0.25% Tween-20 and 0.1% BSA), washed and incubated with primary antisera (ZO-1, 1:150 dilution; ZO-2, 1:150; E-cadherin, 1:100; Cdx2, 1:60; Oct-4, 1:60 dilutions) overnight at 4°C in a humidified chamber. At the end of incubation, embryos were washed 3 times to remove excess primary antibodies and incubated again with TRITC conjugated goat anti-rabbit IgG or TRITC-conjugated goat anti-rat IgG or FITC-conjugated secondary antibodies for 1 h at room temperature. Texas red-labeled phalloidin (cat no. T-7471, Molecular Probes) was used for F-actin staining. Embryos were next washed with fresh PBS 3 times; the first wash contained DAPI for nuclear staining. Non-specific staining was determined by processing embryos as described above in the absence of primary antiserum. Embryos were mounted on a glass slide with Fluoro G to prevent photobleaching and were sealed with nail polish. The localization of all proteins was visualized under either a Nikon Eclipse TS100 microscope equipped with X-Cite 120 for fluorescence and a DigiFire camera for photography or a Zeiss Axiovert 200 microscope equipped with ApoTome optical sectioning and appropriate filters.
RNA extraction, reverse transcription (RT) and quantitative real-time polymerase chain reaction
Total RNA was extracted from pooled embryos (10 embryos/group) from each treatment group [control scramble siRNA and three dosage (400, 800 and 1200 nM) of ZO-1 siRNAs] using a previously described protocol (Paria et al., 1993). Briefly, total RNA was prepared using sodium dodecyl sulphate/phenol/chloroform buffers after addition of E. coli rRNA (20 µg) as a carrier in each tube. Total RNA equivalent to two and half embryos from each group was subjected to reverse transcription for complementary DNA synthesis with SuperScript III RT using random hexamers according to the manufacturer’s protocol (Invitrogen). The primer pairs used for PCR are as follows: 5’-TTCAAAGTCTGCAGAGACAATAGC-3’ (forward) and 5’-TCACATTGCTTAGTCCAGTTCC-3’ (reverse) for ZO-1; 5’-CCATGGGCGCGGACTATCTGA-3’ (forward) and 5’-CTGTGGCGGGGAGGTTTGACTTG-3’ (reverse) for ZO-2, and 5’-GCTTGCTGGTGAAAAGGACCTCTCGAAG-3’ (forward) and 5’-CCCTGAAGTACTCATTATAGTCAAGGGCAT-3’ (reverse) for hypoxanthine-guanine phosphoribosyl transferase 1 (hprt1), a house-keeping gene (Mamo et al., 2007). Each primer pair was validated by performing electrophoresis and melting temperature analysis of the PCR product to ensure the correct size of PCR product and the absence of primer dimers. Standard concentration curves were also done for each primer pair used. All samples were run in triplicate from at least 3 independent experiments. All PCR experiments were carried out using an iQ™5 Real-time PCR Detection System (Bio-Rad Laboratories, Hercules, CA) with SYBR Green detection. 40 cycles of a two-step PCR sequence were performed, and critical threshold values (CT) were measured for each sample (Benjamin et al., 2007). Expression levels of target genes in each sample were compared to hprt1. Differences in expression between each group were compared by one-way ANOVA and Tukeys post-hoc analysis. Fold-change for each gene was calculated using the 2−ΔΔCT method.
Statistics
Each experiment was repeated at least three times and results were reported as mean ± SEM. For each treatment within an experiment, more than 8 high quality embryos were used. The data were first tested for significant differences by ANOVA and later significant differences among multiple treatment groups were determined by Least Squares Means test. The significance level was set at p < 0.05.
Results
Expression of ZO-1 and E-cadherin proteins in 2-cell to blastocyst stages of mouse embryos
We first examined stage-specific embryonic ZO-1 protein expression by immunofluorescence staining from the 2-cell to the blastocyst stage. In a parallel set of experiments using embryos from the same batch, E-cadherin protein localization was also performed as a marker of epithelial adherens junctions. ZO-1 expression was not observed in the 2-cell (Fig. 1Aa) and 4-cell (Fig. 1Ab) stage embryos even though clear membranous localization of E-cadherin was observed at these embryonic developmental stages at their cell-cell contact sites (Fig. 2a&b). ZO-1 expression was first observed at the 8-cell stage embryos. However, not all the 8-cell stage embryos showed ZO-1 expression. While early uncompacted 8-cell embryos showed no expression (Fig. 1Ac), late compacted 8-cell embryos first exhibited punctate accumulation of ZO-1 in cell-cell contacting membranes (Fig. 1Ad). This punctate localization of ZO-1 in cell-cell contact sites between blastomeres of the 8-cell stage embryos was also confirmed by high resolution optical sections of embryos (Fig. 1Ba). Once ZO-1 started to accumulate in the cell membrane, its localization continued and strengthened in the 16-cell stage (Fig. 1Ae), late morula (Fig. 1Af) and blastocyst stages (Figs. 1Ag & 1Bb). No specific immunoreactivity was observed when blastocysts were incubated with secondary antibody in the absence of primary antibody (Fig. 1h). Similar patterns of ZO-1 localization were also previously demonstrated (Fleming et al., 1989; Sheth et al., 1997). Strong membranous E-cadherin protein localization persisted in the 8-cell stage (Fig. 2c), morula (Fig. 2d) and blastocyst (Fig. 2e) stages of the embryo. Blastocysts incubated with secondary antibody in the absence of primary antibody showed no specific immunostaining (Fig. 2f). This analysis revealed that while E-cadherin was present in all developmental stages of the preimplantation embryo, ZO-1 was expressed only during the late 8-cell stage and onwards. Based on this stage-specific ZO-1 expression pattern, the morula to blastocyst conversion event seems to be a unique model to study the role of this protein in cellular differentiation process during preimplantation embryonic development.
Figure 1.
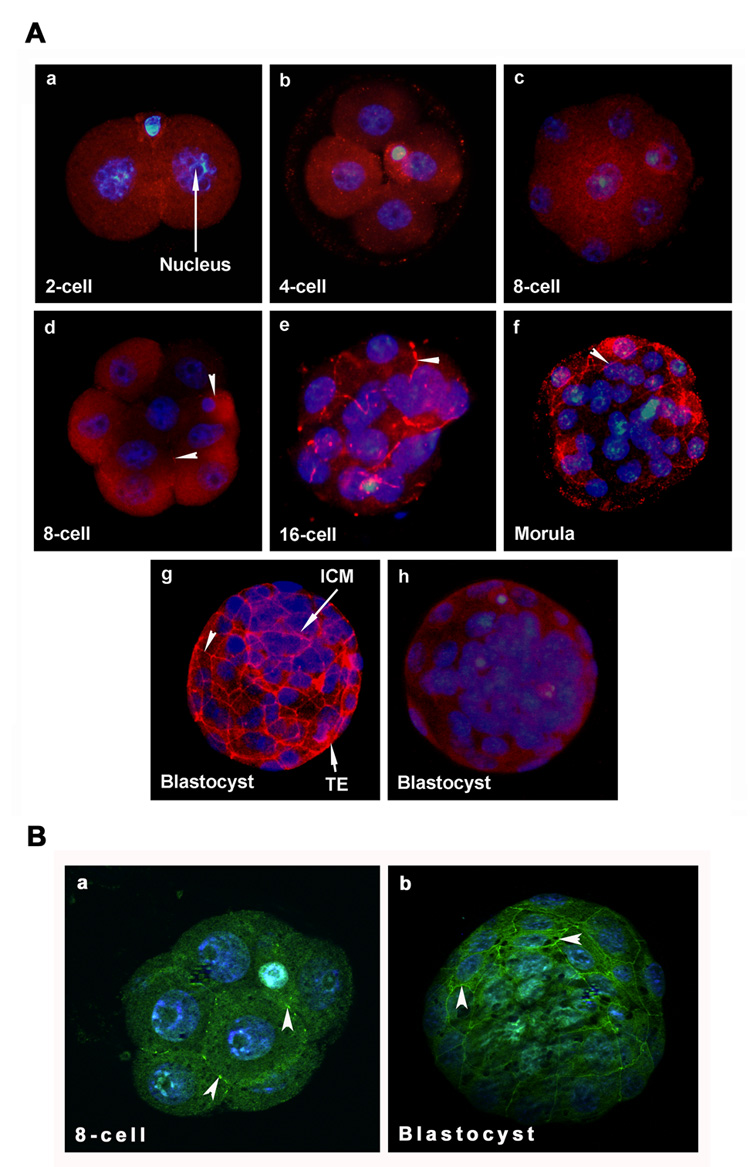
ZO-1 protein expression is stage-specific in developing mouse embryos freshly collected from the reproductive tracts during preimplantation period of pregnancy. All images (40X) are representative of at least three experiments. A) The localization of ZO-1 (TRITC-labeling) was observed in cell-cell contact sites starting from compacted 8-cell stage and onwards. Membranous localization of this protein is indicated with arrow head. The nuclei were stained with DAPI. Stages of preimplantation embryos stained for ZO-1 are: 2-cell (a), 4-cell (b), uncompacted 8-cell (c), compacted 8-cell (d), 16-cell (e), 30-cell (f), and blastocyst (g). Blastocysts stained in the absence of primary antibody are shown in picture h. B) Optical sections showed localization of ZO-1 in cell-cell contact sites of a compacted 8-cell stage embryo (a) and blastocyst (b). TE, Trophectoderm; ICM, Inner Cell Mass.
Figure 2.
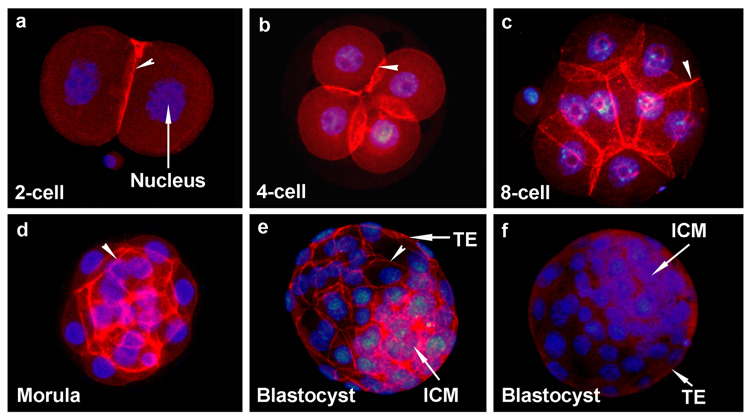
E-cadherin is localized at cell-cell contact sites in all developing stages of mouse embryos freshly collected from the reproductive tracts during preimplantation period of pregnancy. Membranous localization of this protein (TRITC-labeling) is indicated with arrow head. All images (40X) are representative of at least three experiments. The nuclei were stained with DAPI. Stages of preimplantation embryos stained for E-cadherin are: 2-cell (a), 4-cell (b), 8-cell (c), morula (d) and blastocyst (e and f). Blastocysts stained in the absence of primary antibody are shown in picture h. TE, Trophectoderm; ICM, Inner Cell Mass.
We next studied ZO-1 function by suppressing ZO-1 expression using RNA interference technology that has been widely used for the analysis of gene function in plants, invertebrates and mammalian cells (Sharp, 2001; Hannon, 2002). Recently, this technique has been applied in mouse embryos to study the role of specific gene function in preimplantation embryonic development (Wianny and Zernicka-Goetz, 2000; Grabarek et al., 2002; Haraguchi et al., 2004; Soares et al., 2005). In most of these studies, siRNAs were microinjected at the oocyte or one-cell stage. More recently, Grabarek and coworkers (Grabarek et al., 2002) demonstrated an electroporation technique to introduce siRNA in later stages of the preimplantation embryo. Based on their technique, we first attempted to establish electroporation conditions for zona-weakened 2- and 8-cell embryos using control Cy3-labeled siRNA. Use of Cy3-labeled siRNA offered the advantage that incorporation of Cy3 can be visualized under a fluorescence microscope which will confirm incorporation of siRNA inside each blastomere.
Set up of electroporation conditions for siRNA incorporation into preimplantation embryos.
In a series of trials, we determined the optimal parameters for electroporating Cy3-labeled control siRNA (10 µM) first in zona-weakened 2-cell stage embryos. The parameters for optimal electroporation were fixed at three 1ms pulses, each of DC 20 V. Following electroporation without or with control siRNA, embryos were cultured for 72 h to the blastocyst stage to monitor consequences of electroporation on embryonic development and the level of fluorescence in later stages of these developing embryos in culture. The majority of embryos in both groups [electroporation without (33/37 (89%) and with (39/46 (85%) control siRNA] undergo normal development to the blastocyst stage. The embryos that were subjected to electroporation alone exhibited low levels of autofluorescence at any stage of their subsequent development to the blastocyst stage. In Fig. 3A the level of autofluorescence in various stages of embryonic development is shown when 2-cell embryos were only electroporated and cultured for 72 h. In contrast, strong Cy3 fluorescence was detected in 2-cell stage embryos right after electroporation (Fig. 3Ba) of Cy3 labeled control siRNA. This electroporation procedure also resulted in fusion of blastomeres in some of the 2-cell stage embryos (Fig. 3Bb) showing the efficacy of application of electric field as demonstrated earlier (Cheong et al., 1991). These embryos also showed strong Cy3 fluorescence (Fig. 3Bb). However, a gradual decrease in intensity of the Cy3 fluorescence was apparent with the progression of the embryonic development [4-cell (Fig. 3Bc); 8-cell/morula (Fig. 3Bd); blastocyst (Fig. 3Be]. In subsequent experiments, these electroporation parameters when applied to the zona-weakened early 8-cell stage embryos resulted in successful incorporation of Cy3-labeled control siRNA inside embryos (Fig. 3C). The 8-cell stage embryos that were subjected to electroporation alone showed low levels of autofluorescence following the procedure (Fig. 3Ca). In contrast, Cy3 fluorescence was strong in the 8-cell stage embryos following electroporation of embryos with Cy3-labeled control siRNA (Fig. 3Cb). These embryos from both groups when cultured in vitro for 24 h developed normally to the stage of either morulae or blastocysts. These embryos still displayed Cy3 fluorescence but with reduced levels (Fig. 3Cc&d). Through these findings, we understood that siRNA concentration is not maintained at same level inside the embryo for a long period of time. However, the above described results also indicate that this control RNA is not toxic to the embryo because the majority of these embryos when cultured in vitro developed to the blastocyst stage with no visible abnormality.
Figure 3.
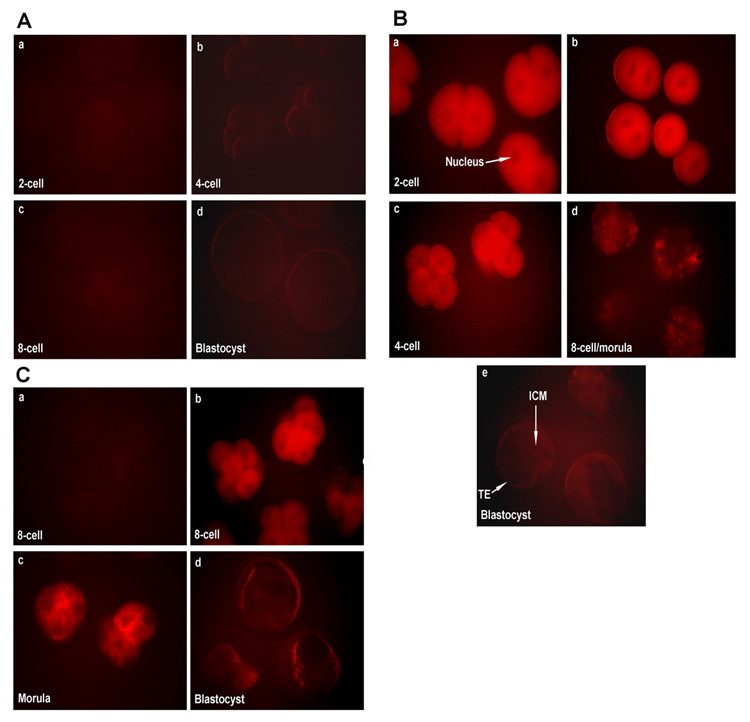
A) The level of autofluorescence in various stages of embryonic development when 2-cell embryos were only electroporated and cultured for 72 h. Autofluorescence was detected using the filter that was used to visualize Cy3-or TRITC-color. The embryonic stages (40X) are: 2-cell (a), 4-cell (b), 8-cell/morula (c), and blastocyst (d). B) Cy3 fluorescence level in various stages of embryonic development when 2-cell embryos were electroporated with Cy3-labeled control siRNA and cultured for 72 h. The embryonic stages (40X) are: 2-cell (a), fused 2-cell (b), 4-cell (c), 8-cell/morula (d), and blastocyst (e). C) Cy3 fluorescence level in the 8-cell, morula and blastocyst stages when 8-cell embryos were electroporated with Cy3-labeled control siRNA and cultured for 48 h. a, autofluorescence level in 8-cell embryos prior to electroporation; b, Cy3 fluorescence level in 8-cell stage embryos after electroporation with Cy3-labeled control siRNA; c and d, Cy-3 fluorescence level in in vitro grown morula and blastocyst stages, respectively, following electroporation of 8-cell stage embryos with Cy3-labeled control siRNA. TE, Trophectoderm; ICM, Inner Cell Mass.
Based on the preliminary success with control siRNA incorporation, we proceeded to examine efficacy of ZO-1 siRNA in suppression of ZO-1 protein expression and the process of morula to blastocyst transformation.
Deferred blastocyst formation from early 8-cell stage embryos in presence of ZO-1 siRNA
Zona-weakened early 8-cell stage embryos were electroporated with custom made ZO-1 siRNA mixture (mixture of three siRNA created against mouse ZO-1 sequences) at three concentrations (0.4, 0.8 and 1.2 µM). Following electroporation, embryos were initially cultured in vitro for 2 h to examine their survival. As expected, we observed that roughly 93% (90–95%) of these electroporated embryos in all groups showed no sign of noticeable degeneration under a stereo microscope (Fig. 4A). Morphologically normal embryos were then cultured in vitro for an additional period of 24 h and their developmental stages were recorded at the end of the culture.
Figure 4.
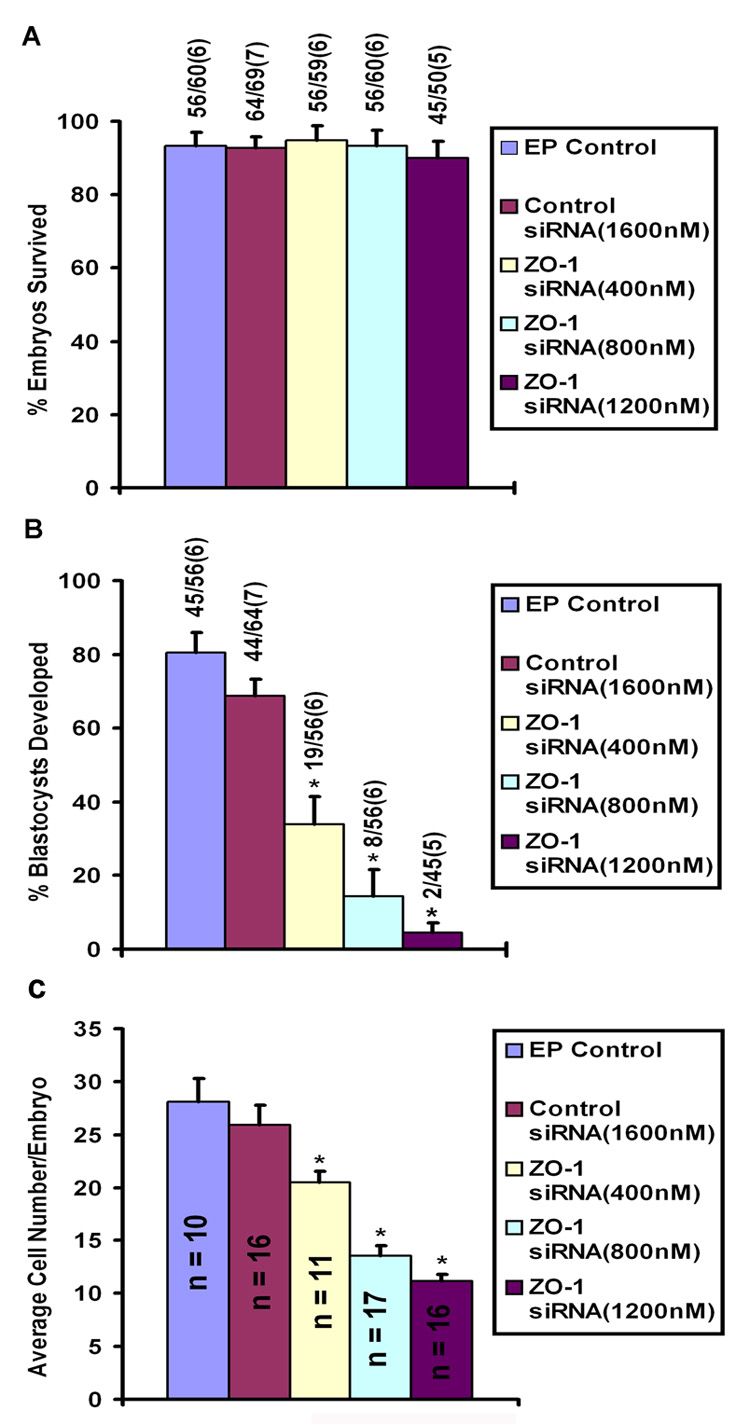
A) Embryonic survival rate following electroporation (EP) of 8-cell stage embryos in the presence or absence of control and ZO-1 siRNAs. The numbers on top of each bar indicate the number of embryos survived/number of embryos electroporated. Number within the parenthesis indicates number of experiments. Vertical bars indicate the SEM. ZO-1 siRNAs were used at three concentrations, 400 nm, 800 nM and 1200 nM. Control siRNA was used at only 1600 nM. Statistical comparisons were made by ANOVA and Least Square Means test (*p<0.05). B) Incidence of blastocyst formation after electroporation of ZO-1 siRNA into 8-cell stage embryos. The numbers on top of each bar indicate the number of blastocysts developed/number of embryos survived after electroporation. Number within the parenthesis indicates number of experiments. Vertical bars indicate the SEM. ZO-1 siRNAs were used at three concentrations, 400 nm, 800 nM and 1200 nM. Control siRNA was used at only 1600 nM. Statistical comparisons were made using ANOVA followed by Least Squares Means test (*p<0.05). C) Effects of ZO-1 siRNA on blastomere number in the morula stage embryo. After termination of culture, morulae were stained with DAPI for the purpose of counting blastomere numbers. Number within the bar indicates number of morulae used to determine blastomere number. Vertical bars indicate the SEM. Statistical comparisons were made using ANOVA followed by Least Squares Means test (*p <0.05).
As shown in Fig. 4B, ZO-1 siRNA reduced the percentage of blastocyst formation from 8-cell stage embryos after 24 h of culture in a dose-dependent manner. ZO-1 siRNA at 400–1200 nM concentrations significantly decreased the percentage of blastocyst formation compared to control groups where 8-cell embryos were electroporated with or without control siRNA. Almost 69–80% of 8-cell embryos reached the blastocyst stage in control groups in the absence or presence of high concentration (1600 nM) of control siRNA. Under our culture conditions, the percentage of 8-cell embryos that developed into blastocyst in the control siRNA group (69%, 44/64) was slightly lower, but insignificant (p>0.05), compared to the electroporation alone control group (80%, 45/56). In contrast, when 8-cell embryos were electroporated with the lowest concentration (400 nM) of ZO-1 siRNA, only 34% (19/56) of embryos developed into blastocysts. The percentage of blastocyst formation further declined with the increase in concentrations of ZO-1 siRNA for electroporation; 14% (8/56) at 800 nM and 4% (2/45) at 1200 nM (Fig. 4B). Most of the embryonic developmental arrest in ZO-1 siRNA-treated groups occurred at later than the 8-cell stage. Cell numbers of these developmentally arrested embryos were inversely linked with the increasing concentrations of the ZO-1 siRNAs (Fig. 4C). Morulae that developed from 8-cell embryos in control groups without or with control siRNAs had an average of 20–30 blastomeres (Fig. 4C). In contrast, morulae formed in ZO-1 siRNA-treated groups had decreased number of blastomeres compared to control groups (Fig. 4C). The average number of blastomeres in morulae formed in the ZO-1 siRNA electroporated groups was approximately 21, 12 and 11, respectively, at 400, 800 and 1200 nM concentrations (Fig. 4C). These defects were considered significant and reproducible. The embryonic developmental stages and their morphological appearances after 24h of culture in the presence or absence of control siRNA and various concentrations of ZO-1 siRNA are presented in Figure 5. While most of these embryos in all groups look morphologically normal under visual inspection, a few embryos from highest concentration of ZO-1 siRNA (Fig. 5) showed some sign of degeneration.
Figure 5.
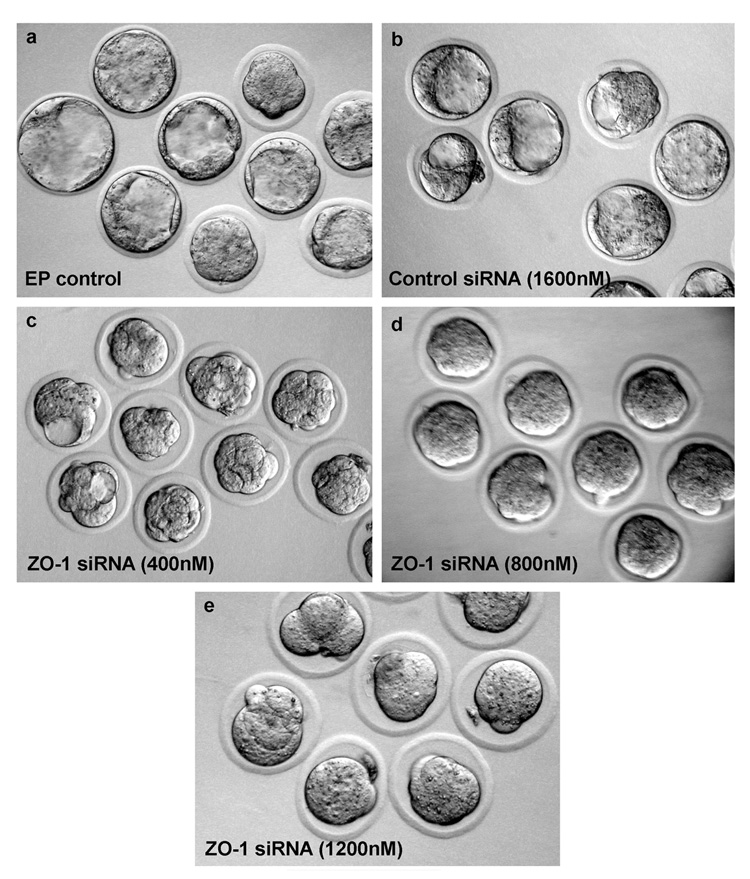
Electroporation (EP) of ZO-1 siRNA into 8-cell stage embryos perturbs the development of embryos. Photographs (20X) of representative embryos for each experimental group are presented. The 8-cell stage embryos were electroporated with buffer [EP control] (a), control siRNA (b), and ZO-1 siRNA at three concentrations, 400 nM (c), 800 nm (d) and 1200 nm (e).
ZO-1 siRNA down-regulates ZO-1, but not ZO-2, gene expression
To assess the efficiency of our approach that ZO-1 siRNA specifically down regulates ZO-1 gene expression, we performed Real-Time PCR to quantify ZO-1 and ZO-2 mRNA levels in ZO-1 siRNA-treated (400, 800 and 1200 nM) embryos. Control embryos were electroporated with a negative scrambled siRNA. As shown in Figure 6, ZO-1 siRNA decreased ZO-1, but not ZO-2, mRNA levels compared to control siRNA-treated group. The level of ZO-1 mRNA at the lowest concentration of ZO-1 siRNA (400 nM) was not significantly different from the control siRNA-treated group. However, significant (P < 0.05) reduction in ZO-1 mRNA levels was observed at 800 nM and 1200 nM concentrations of ZO-1 siRNA as compared to the control siRNA-treated group. No significant (P > 0.05) change in ZO-2 gene expression level was noticed among embryos electroporated with control or ZO-1 siRNAs. These results ensure the specific ZO-1 siRNA effects on ZO-1 gene expression in embryos.
Figure 6.
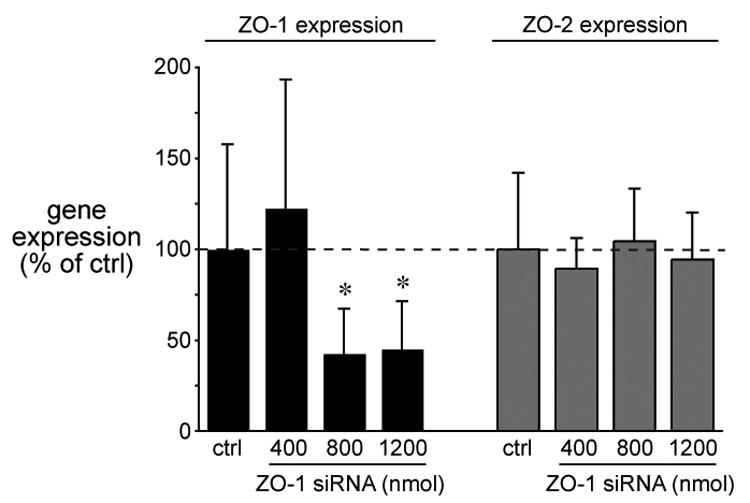
ZO1 siRNA inhibits ZO-1 gene expression but has no effect on ZO-2 expression. RNA was isolated from embryos treated with three concentrations of ZO-1 siRNA (400 nm, 800 nM and 1200 nM). Control embryos were treated with negative sequence siRNA. Gene expression was measured by Real-Time PCR, expressed as fold-change (mean ±/− SD), and normalized to control. Control siRNA (ctrl) was used at only 1600 nM. Statistical comparisons were made using ANOVA and Tukeys post hoc analysis (*p<0.05, n = 3). Dotted line indicates 100% of control.
ZO-1 siRNA specifically suppresses ZO-1 protein expression in embryos
Analysis of ZO-1 expression by immunofluorescence showed that ZO-1 is strikingly suppressed in embryos 24 h after electroporation with ZO-1 siRNA (Fig. 7A). The ZO-1 siRNA-treated embryos showed either complete or partial loss of ZO-1 immunolabeling from the cell membrane (Fig. 7A). The morula stage embryos developed from the control siRNA-treated group showed clear circumferential ZO-1 labeling (Fig. 7Aa&b). The morula stage embryos at lowest concentration (400 nM) of ZO-1 siRNA showed either partial or complete loss of ZO-1 localization from the membrane (Fig. 7Ac&d). Embryos electroporated with 800 and 1200 nM ZO-1 siRNA showed almost complete absence of ZO-1 immunolabeling from the cell surface [800 nM (Fig. 7Ae&f) and 1200 nM (Fig. 7Ag& h]. To confirm the specificity of ZO-1 knock down using these ZO-1 siRNAs, we analyzed the distribution of E-cadherin proteins in some of these ZO-1 siRNA electroporated embryos at the same time point at which we observed ZO-1 knockdown. ZO-1 knockdown apparently has no effect on E-cadherin expression (Fig. 7B). Membranous E-cadherin localization was observed in embryos obtained from all treatment groups regardless of their developmental stages (Fig. 7B). In a separate study, we performed ZO-1 and E-cadherin double immunofluorescence staining in the same embryos obtained from all treatment groups. Individual and combined images of ZO-1 (green) and E-cadherin (red) double immunofluorescence staining are shown in the Fig. 8. This analysis also revealed that while E-cadherin was present in morulae obtained from all treatment groups, ZO-1 was only expressed in morulae obtained from control siRNA group. These results are not surprising since adherens junction formation does not depend on tight junction formation (Gumbiner et al., 1988).
Figure 7.
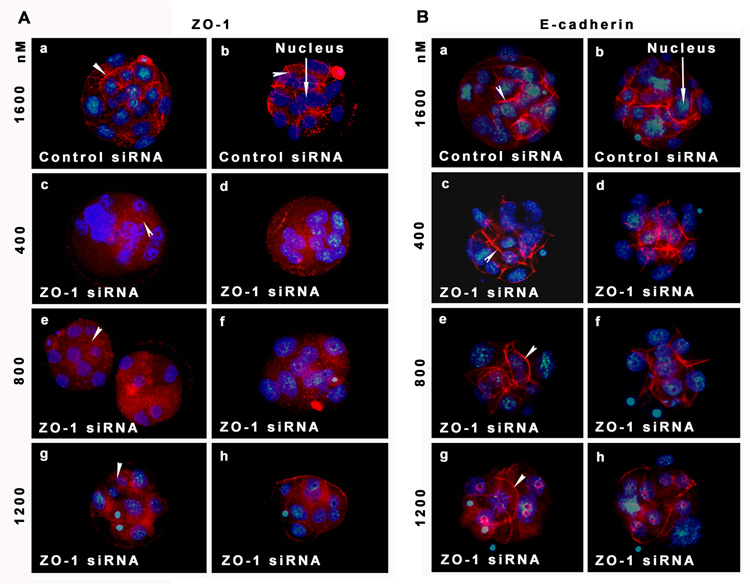
A) Electroporation of ZO-1 siRNA at the 8-cell stage embryo effectively suppresses ZO-1 expression from the morula stage embryos. Photographs (40X) of two representative embryos for each experimental group are presented. All images are representative of at least three experiments. The nuclei were stained with DAPI. a and b, morula from control siRNA group; c and d; morulae from 400 nM ZO-1 siRNA group; e and f; morulae from 800 nM ZO-1 siRNA group; g and h, morulae from 1200 nM ZO-1 siRNA group. B) Electroporation of ZO-1 siRNA at the 8-cell stage embryo did not perturb E-cadherin expression from the morula stage embryos. Photographs (40X) of two representative embryos for each experimental group are presented. All images are representative of at least three experiments. The nuclei were stained with DAPI. a and b, morula from control siRNA group; c and d; morulae from 400 nM ZO-1 siRNA group; e and f; morulae from 800 nM ZO-1 siRNA group; g and h, morulae from 1200 nM ZO-1 siRNA group.
Figure 8.
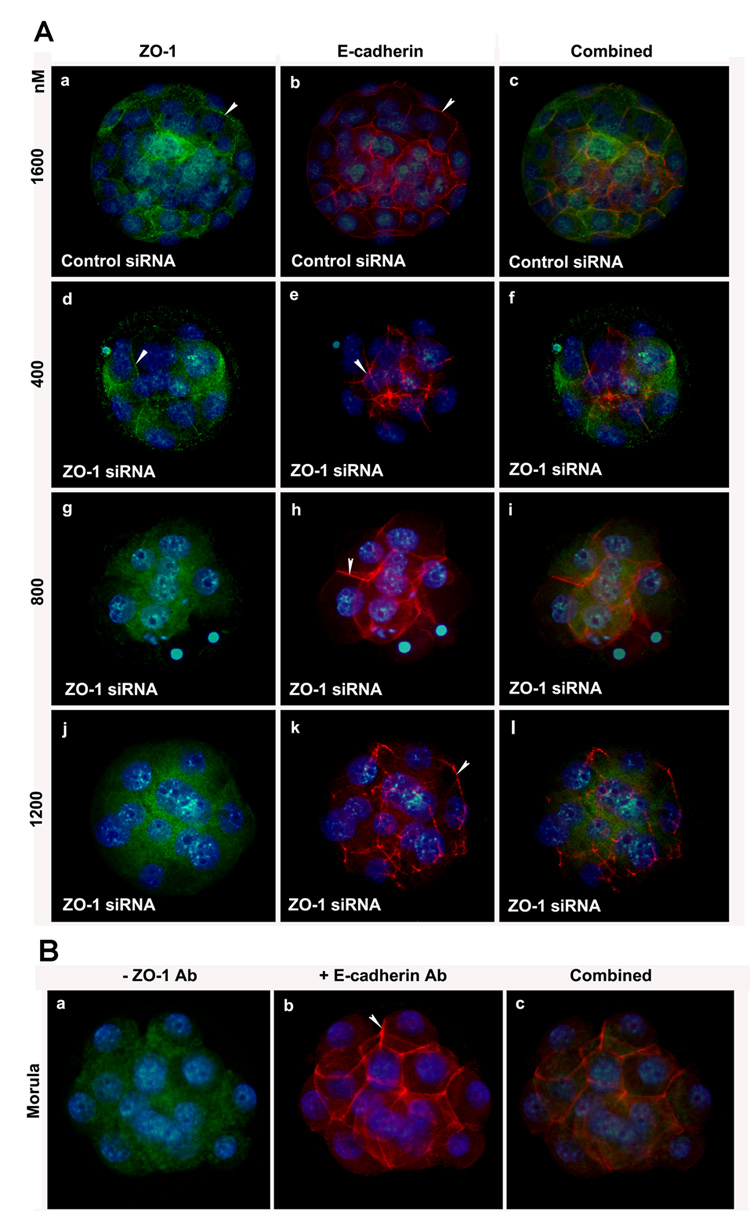
ZO-1 and E-cadherin double immunolabeling in same embryos obtained from the control and ZO-1 siRNA groups. ZO-1 (green) and E-cadherin (red) expression did not alter in the control siRNA-treated embryos. However, while E-cadherin expression remained undisturbed, ZO-1 expression did not notice in morulae obtained from ZO-1 siRNA-treated groups. Left panel shows ZO-1 expression (a, d, g, and j). Middle panel shows E-cadherin expression (b, e, h, and k). Right panel shows combined immunostaining of ZO-1 and E-cadherin (c, f, i, and l). The nuclei were stained with DAPI.
In an additional set of experiments, we attempted to determine the effects of ZO-1 downregulation on the expression and distribution of ZO-2, another tight junctional protein (Tsukita et al., 2001), F-actin, a constituent of the cytoskeleton (Claessens et al., 2006), and two known transcription factors, Cdx2 and Oct-4, involved in lineage specification in early embryos (Niwa et al., 2005). Immunolocalization of ZO-2, F-actin, Cdx2 and Oct-4 in vivo grown morulae and blastocysts were shown in Fig 9A, Fig 10A & Fig 11A, respectively. Membranous localization of ZO-2 (Fig. 9A) and F actin (Fig 9A, Fig 10A & Fig 11A) was observed in both the in vivo grown morula and blastocyst stages. The majority, but not all, blastomeres of the morula showed nuclear localization of Cdx2 (Fig. 10Aa). Unlike Cdx2, Oct-4 (Fig. 11Aa) staining was noted in nuclei of all blastomeres at the morula stage. While Cdx2 expression was largely observed in nuclei of the outside blastomeres (Fig. 10Ad), Oct-4 was mainly expressed in nuclei of blastomeres of ICM, at the blastocyst stage (Fig. 11Ad). However, a few nuclei of trophoblast cells of the blastocyst still showed the low level of Oct-4 expressions (Fig. 11Ad). These expression patterns of Cdx2 and Oct-4 are consistent with the previous argument that these two transcription factors play major role in the segregation of two cell lineages, the ICM and TE, during blastocyst formation (Niwa et al., 2005). We considered that downregulation of ZO-1 expression could effect the expression of Cdx2 and Oct-4, but not ZO-2 and F-actin. We used only the morula stage embryos from control siRNA and two dosages of ZO-1 siRNA electroporated groups since it was not possible to obtain blastocysts after electroporation of ZO-1 siRNAs. In control electroporation group, we noted normal expression of ZO-2 (Fig. 9Ba&c), F-actin (Figs. 10Bb&c, 10Bb&c & Fig 11Bb&c), Cdx2 (Fig. 10Ba&c) and Oct-4 (Fig. 11Ba&c) in morulae. Likewise, we observed no change in the pattern of ZO-2 (Fig. 9Bd&f) and F-actin (Fig. 9Be&f, Fig 10Be&f & Fig 11Be&f) localization in control siRNA electroporated group. In contrast, while ZO-2 expression (Fig. 9Bg&i) showed no change, the expression of Cdx2 (Fig. 10Bg&i) and Oct-4 (Fig.11Bg&i) was considerably reduced in morulae obtained from the lowest dose of ZO-1 siRNA electroporated group. These finding provide evidence that inhibition of ZO-1 expression does not influence ZO-2 and F-actin expression and distribution, but decreases Cdx2 and Oct-4 protein expression.
Figure 9.
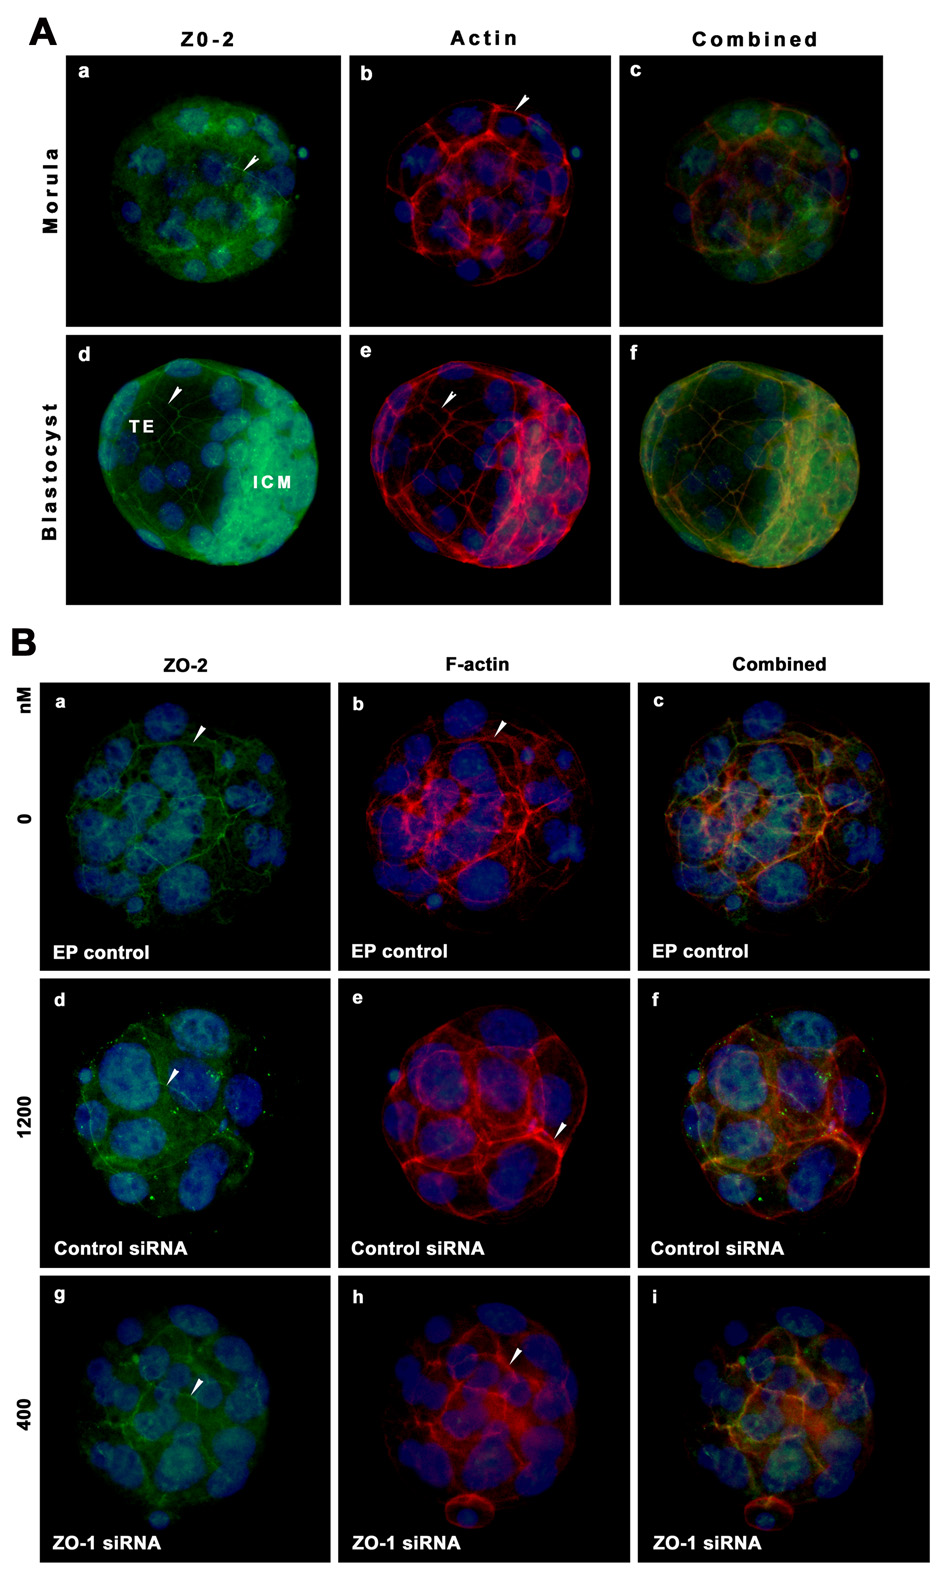
Immunolocalization of ZO-2 (green) and F-actin (red) in the same morula and blastocyst stage embryos. A) Morulae and blastocysts were freshly collected from the reproductive tracts on days 3 and 4 of pregnancy. B) Morulae were obtained after electroporation of controls and one dosage of ZO-1 siRNAs. The nuclei were stained with DAPI. Membranous localization of these proteins is indicated with arrow head. TE, Trophectoderm; ICM, Inner Cell Mass.
Figure 10.
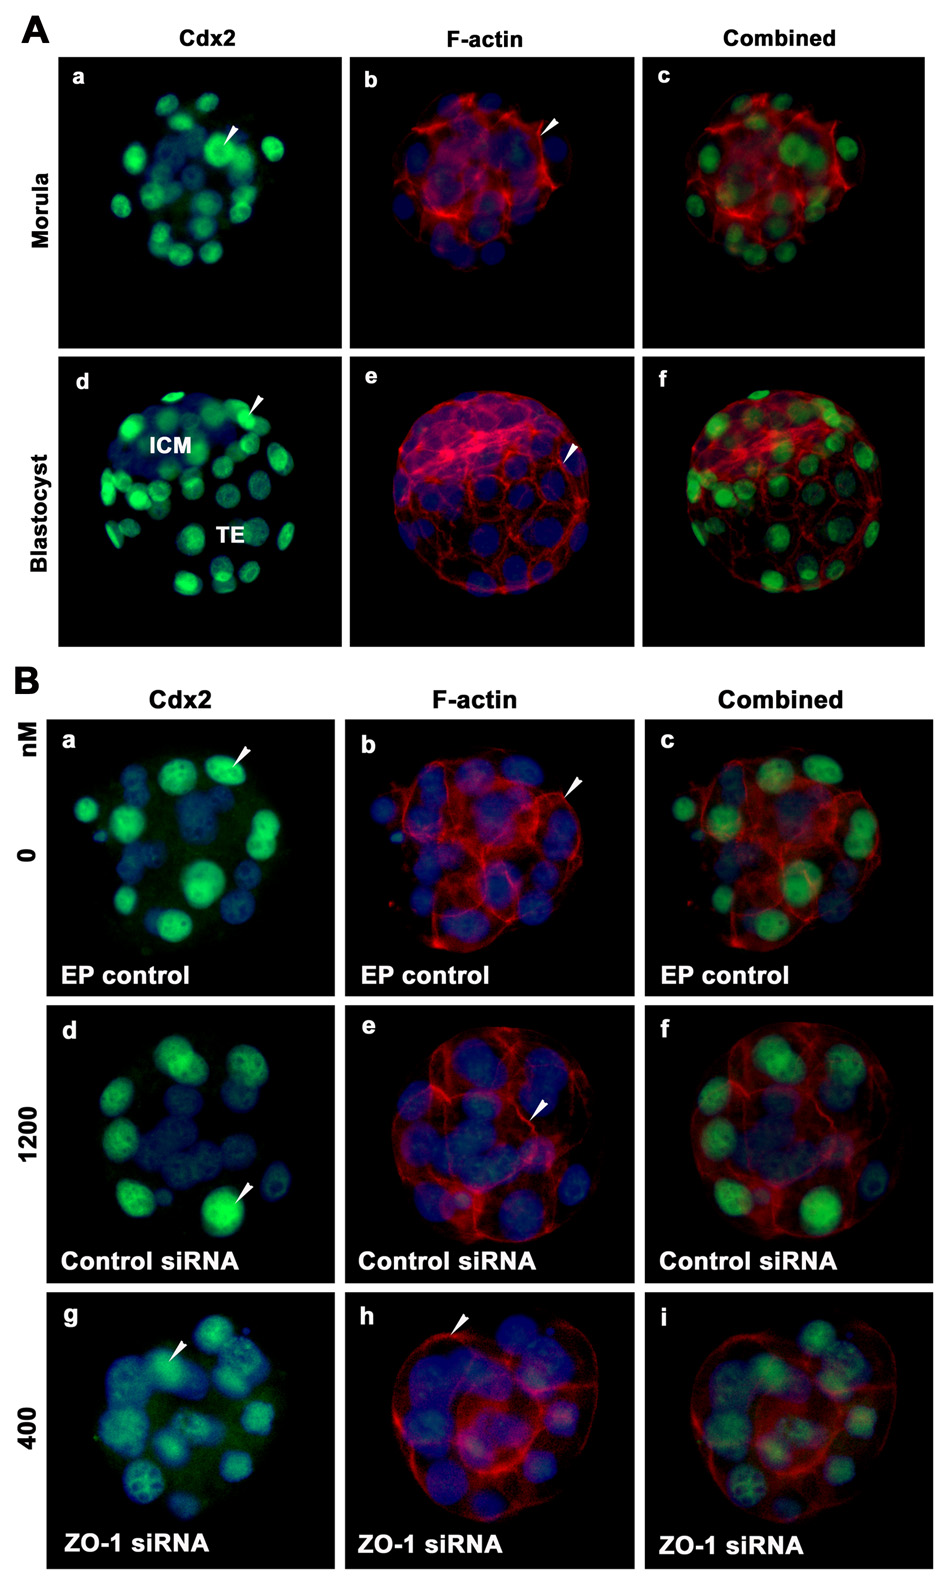
Immunolocalization of Cdx2 (green) and F-actin (red) in the same morula and blastocyst stage embryos. A) Morulae and blastocysts were freshly collected from the reproductive tracts on days 3 and 4 of pregnancy. B) Morulae were obtained after electroporation of control and two dosages of ZO-1 siRNAs. The nuclei were stained with DAPI. Membranous localization of these proteins is indicated with arrow head. TE, Trophectoderm; ICM, Inner Cell Mass.
Figure 11.

Immunolocalization of Oct-4 (green) and F-actin (red) in the same morula and blastocyst stage embryos. A) Morulae and blastocysts were freshly collected from the reproductive tracts on days 3 and 4 of pregnancy. B) Morulae were obtained after electroporation of control and two dosages of ZO-1 siRNAs. The nuclei were stained with DAPI. Localization of these proteins is indicated with arrow head. TE, Trophectoderm; ICM, Inner Cell Mass.
When a few of these morulae from all groups were cultured for an additional 24 h (a total period of 48 h), all embryos in control groups reached the blastocyst stage while a few of the morula stage embryos showed blastocoel formation in lower doses (400 nM) of ZO-1 siRNA. The embryos treated with highest concentrations underwent degeneration by 48 h (data not presented).
Discussion
The current study was initiated to investigate the presumed involvement of ZO-1 in the process of 8-cell stage to blastocyst formation. Given the first observed membranous localization of ZO-1 in the 8-cell stage embryos and onwards, ZO-1 associated tight junction formation is considered to be important for blastocyst formation. Our results of ZO-1 knockdown and reduction in blastocyst formation by ZO-1 siRNA revealed an important role of ZO-1 in initiating blastocyst formation from the morula.
Based on the information accumulated over the years, it is reasonably clear that gradual formation of first adherens and next tight junctions in the outside cells of the morula help to form the trophectoderm layer and retention of fluid inside the embryo. Thus, inhibition of one of these phenomena should inhibit blastocyst formation. Indeed, E-cadherin knockout embryos fail to develop past the morula stage (Larue et al., 1994; Ohsugi et al., 1997). However, the actual role of E-cadherin in early stages of embryonic development still remained unknown in this model because of residual maternal transcripts in embryos (Larue et al., 1994). Thus, we wondered whether tight junction formation in outside cells of the morula is important for the formation of the trophectoderm and blastocoel. To address this issue we electroporated early 8-cell stage embryos with ZO-1 siRNAs to silence ZO-1 expression in later developmental stages. We found that suppression of ZO-1 did not prevent 8-cell embryos from undergoing compaction. However, the majority of these compacted embryos did not reach to the blastocyst stage by 24h. Only a few embryos in lower dose reached to the blastocyst stage with a small blastocoel. The developmental potential of each embryo appeared to correlate with the expression pattern of ZO-1. A small percentage of embryos that had weak expression for ZO-1 may be showing retarded development and will reach to the blastocyst stage upon further culture. However, this study does not provide information how long siRNA effects can persist. In this regard, it has been demonstrated that gene silencing by this method in mouse embryos can persist for several days (Soares et al., 2005). This effect of ZO-1 siRNAs was also specific since suppression of ZO-1 did not disturb ZO-2 mRNA expression and the localization of E-cadherin, ZO-2 and F-actin proteins in these embryos. In addition, our study also indicates that in the absence of ZO-1, E-cadherin and ZO-2 might support 8-cell stage embryos to reach to the compaction stage. If this is the case, it can be speculated that ZO-1 has its own function in the window of morula to blastocyst formation. Since ZO-3 knock out mice are normal and fertile (Adachi et al., 2006) and ZO-2 knock out embryos die shortly after implantation due to an arrest in early gastrulation (Xu et al., 2008), ZO-2 and ZO-3 functions in blastocyst formation are dispensable. However, the function of ZO-1 is unknown at this stage. Our results, however, suggest that loss-of-function of ZO-1 resulted in decreased expression of Cdx2 and Oct-4. In this regard, it has been demonstrated that an interaction between Cdx2 and Oct3/4 determines the first differentiation event of mammalian development (Niwa et al., 2005). Collectively, the results suggest that one cause of failure or delay in morula to blastocyst transformation in ZO-1 siRNA electroporated embryos is decreased expression of lineage specific genes Cdx2 and Oct-4.
This work shows a possible role of ZO-1 in blastocyst formation but it needs to be placed in context with previous studies in embryos as well as in various epithelial cell lines. It has been demonstrated in epithelial cell lines that TJ formation was delayed but not abolished when ZO-1 was knocked down or abolished (Umeda et al., 2006). However, suppression of ZO-2 in ZO-1 and ZO-3-deficient cells successfully stopped TJ formation (Umeda et al., 2006). Since ZO-3 is not required for TJ formation (Adachi et al., 2006; Umeda et al., 2006) and possibly not redundant with ZO-1 and/or ZO-2 (Itoh et al., 1999), the question remains as to the redundancy of ZO-1 and ZO-2. In this regard, Umeda and coworkers (2006) showed that ZO-1 and ZO-2 appear to be functionally redundant but they can also independently determine whether and where claudins are polymerized. In our study, we only suppressed ZO-1 expression but not ZO-2. However, we know that occludin first assembles in the outer cells of late morula when both ZO-1 and ZO-2 are present (Sheth et al., 2000). This suggests that the occludin/ZO-1 or ZO-2 complexes may play important role in TJ formation in outer cells of the morula. Since the absence of occludin (Saitou et al., 2000), some of claudins (Furuse et al., 2002; Nitta et al., 2003; Gow et al., 2004), ZO-2 (Xu et al., 2008) and ZO-3 (Adachi et al., 2006; Xu et al., 2008) does not affect blastocyst formation, single knockout of ZO-1 or knockout of ZO-1 and ZO-2 in combination will be required to understand the definitive role of these TJ proteins in embryo development and blastocyst formation. In this regard a recent study (Madan et al., 2007) has demonstrated that blockage of Na/K-ATPase β1 subunit expression by microinjecting fertilized 1-cell stage embryos with Na/K-ATPase β1 siRNA resulted in inhibition of morula to blastocyst formation by inhibiting Na/K-ATPase β1 protein expression together with aberrant expression of Na/K-ATPase α1 and tight junction proteins, ZO-1 and occludin.
The current study is the first to assign a function of ZO-1 in the process of morula to blastocyst conversion. Disruption of ZO-1-mediated tight junction formation leads to arrest of embryonic development at the morula stage without further differentiation of outside and inside cells to the trophectoderm and inner cell mass. It has been well established that construction of an epithelial layer first requires the formation of cadherin-based adherens junctions that helps to build later tight junctions (Gumbiner et al, 1988). These two junctional networks jointly regulate the strength of adhesion between cells permitting epithelia to meet the functional needs of the tissue. Our study demonstrates that in the absence of ZO-1, E-cadherin-based junctions do not provide enough support to the outer cells of the morula to initiate fluid accumulation inside the embryo.
Acknowledgement
The support of the National Cooperative Program on Trophoblast-Maternal Tissue Interactions is gratefully acknowledged. This work was supported by National Institutes of Health grants UO-1 HD042636 and HD044741 (to BCP). We would like to thank Dr. Mark R. Frey for his help in optical sectioning of embryos.
Footnotes
Publisher's Disclaimer: This is a PDF file of an unedited manuscript that has been accepted for publication. As a service to our customers we are providing this early version of the manuscript. The manuscript will undergo copyediting, typesetting, and review of the resulting proof before it is published in its final citable form. Please note that during the production process errors may be discovered which could affect the content, and all legal disclaimers that apply to the journal pertain.
References
- Adachi M, Inoko A, Hata M, Furuse K, Umeda K, Itoh M, Tsukita S. Normal establishment of epithelial tight junctions in mice and cultured cells lacking expression of ZO-3, a tight-junction MAGUK protein. Mol. Cellu. Biol. 2006;26:9003–9015. doi: 10.1128/MCB.01811-05. [DOI] [PMC free article] [PubMed] [Google Scholar]
- Benjamin JT, Smith RJ, Halloran BA, Day TJ, Kelly DR, Prince LS. FGF-10 is decreased in bronchopulmonary dysplasia and suppressed by Toll-like receptor activation. Am. J. Physiol. Cell Mol. Physiol. 2007;292:L550–L558. doi: 10.1152/ajplung.00329.2006. [DOI] [PubMed] [Google Scholar]
- Cheong HT, Taniguchi T, Hishinuma M, Takahashi Y, Kanagawa H. Effects of various electric fields on the fusion and in vitro development of mouse two-cell embryos. Theriogenology. 1991;36:875–885. doi: 10.1016/0093-691x(91)90353-f. [DOI] [PubMed] [Google Scholar]
- Claessens MM, Bathe M, Frey E, Bausch AR. Actin-binding proteins sensitively mediate F-actin bundle stiffness. Nat. Mater. 2006;5:748–753. doi: 10.1038/nmat1718. [DOI] [PubMed] [Google Scholar]
- Farquhar MG, Palade GE. Junctional complexes in various epithelia. J. Cell Biol. 1963;17:375–412. doi: 10.1083/jcb.17.2.375. [DOI] [PMC free article] [PubMed] [Google Scholar]
- Fleming TP, McConnell J, Johnson MH, Stevenson BR. Development of tight junctions de novo in the mouse early embryos: Control of assembly of the tight junction-specific protein, ZO-1. J. Cell Biol. 1989;108:1407–1418. doi: 10.1083/jcb.108.4.1407. [DOI] [PMC free article] [PubMed] [Google Scholar]
- Fleming TP, Sheth B, Fesenko I. Cell adhesion in the preimplantation mammalian embryo and its role in trophectoderm differentiation and blastocyst morphogenesis. Front. Biosci. 2001;6:1000–1007. doi: 10.2741/fleming. [DOI] [PubMed] [Google Scholar]
- Furuse M, Hata M, Furuse K, Yoshida Y, Haratake A, Sugitani Y, Noda T, Kubo A, Tsukita S. Claudin-based tight junctions are crucial for the mammalian epidermal barrier: a lesson from claudin-1-deficient mice. J. Cell Biol. 2002;156:1099–1111. doi: 10.1083/jcb.200110122. [DOI] [PMC free article] [PubMed] [Google Scholar]
- Grabarek JB, Plusa B, Glover DM, Zernicka-Goetz M. Efficient delivery of dsRNA into zona-encased mouse oocytes and preimplantation embryos by electroporation. Genesis. 2002;32:269–276. doi: 10.1002/gene.10076. [DOI] [PubMed] [Google Scholar]
- Gow A, Davies C, Southwood CM, Frolenkov G, Chrustowski M, Ng L, Yamauchi D, Marcus DC, Kachar B. Deafness in Claudin-11-null mice reveals the critical contribution of basal cell tight junctions to stria vascularis function. J. Neurosci. 2004;24:7051–7062. doi: 10.1523/JNEUROSCI.1640-04.2004. [DOI] [PMC free article] [PubMed] [Google Scholar]
- Gumbiner B, Stevenson B, Grimaldi A. The role of the cell adhesion molecule uvomorulin in the formation and maintenance of the epithelial junctional complex. J. Cell Biol. 1988;107:1575–1587. doi: 10.1083/jcb.107.4.1575. [DOI] [PMC free article] [PubMed] [Google Scholar]
- Hannon GJ. RNA interference. Nature. 2002;418:494–498. doi: 10.1038/418244a. [DOI] [PubMed] [Google Scholar]
- Haraguchi S, Saga Y, Naito K, Inoue H, Seto A. Specific gene silencing in the preimplantation stage mouse embryo by an siRNA expression vector system. Mol. Reprod. Dev. 2004;68:17–24. doi: 10.1002/mrd.20047. [DOI] [PubMed] [Google Scholar]
- Itoh M, Furuse M, Morita K, Kubota K, Saitou M, Tsukita S. Direct binding of three tight junction-associated MAGUKs, ZO-1, ZO-2 and ZO-3 with the COOH termini of claudins. J. Cell Biol. 1999;147:1351–1363. doi: 10.1083/jcb.147.6.1351. [DOI] [PMC free article] [PubMed] [Google Scholar]
- Johnson MH, McConnell JML. Lineage allocation and cell polarity during mouse embryogenesis. Sem. Cell Dev. Biol. 2004;15:583–597. doi: 10.1016/j.semcdb.2004.04.002. [DOI] [PubMed] [Google Scholar]
- Larue L, Ohsugi M, Hirchenhain J, Kemler R. E-cadherin null mutant embryos fail to form a trophectoderm epithelium. Proc. Natl. Acad. Sci. USA. 1994;91:8263–8267. doi: 10.1073/pnas.91.17.8263. [DOI] [PMC free article] [PubMed] [Google Scholar]
- Lawitts JA, Biggers JD. Optimization of mouse embryo culture media using simplex methods. J. Reprod. Fertile. 1991;91:543–556. doi: 10.1530/jrf.0.0910543. [DOI] [PubMed] [Google Scholar]
- Madan P, Rose K, Watson AJ. Na/K-ATPase β1 subunit expression is required for blastocyst formation and normal assembly of trophectoderm tight junction-associated proteins. J. Biol. Chem. 2007;282:12127–12134. doi: 10.1074/jbc.M700696200. [DOI] [PubMed] [Google Scholar]
- Mamo S, Gal AB, Bodo S, Dinnyes A. Quantitative evaluation and selection of reference genes in mouse oocytes and embryos cultured in vivo and in vitro. BMC Dev. Biol. 2007;7:14. doi: 10.1186/1471-213X-7-14. [DOI] [PMC free article] [PubMed] [Google Scholar]
- Nitta T, Hata M, Gotoh S, Seo Y, Sasak H, Hashimoto N, Furuse M, Tsukita S. Size-selective loosening of the blood-brain barrier in claudin-5-deficient mice. J. Cell Biol. 2003;161:653–660. doi: 10.1083/jcb.200302070. [DOI] [PMC free article] [PubMed] [Google Scholar]
- Niwa H, Toyooka Y, Shimosato D, Strumpf D, Takahashi K, Yagi R, Rossant J. Interaction between Oct3/4 and Cdx2 determines trophectoderm differentiation. Cell. 2005;123:917–929. doi: 10.1016/j.cell.2005.08.040. [DOI] [PubMed] [Google Scholar]
- Ohsugi M, Larue L, Schwartz H, Kemler R. Cell-junction and cytoskeletal organization in mouse blastocysts lacking E-cadherin. Dev. Biol. 1997;185:261–271. doi: 10.1006/dbio.1997.8560. [DOI] [PubMed] [Google Scholar]
- Paria BC, Dey SK. Preimplantation embryo development in vitro: Cooperative interactions among embryo and role of growth factors. Proc. Natl. Acad. Sci. USA. 1990;87:4756–4760. doi: 10.1073/pnas.87.12.4756. [DOI] [PMC free article] [PubMed] [Google Scholar]
- Paria BC, Das SK, Andrews GK, Dey SK. Expression of epidermal growth factor receptor gene is regulated in the blastocyst during delayed implantation in the mouse. Proc. Natl. Acad. Sci. USA. 1993;90:55–59. doi: 10.1073/pnas.90.1.55. [DOI] [PMC free article] [PubMed] [Google Scholar]
- Saitou M, Furuse M, Sasaki H, Schulzke J, Fromm M, Takano H, Noda T, Tsukita S. Complex phenotype of mice lacking occludin, a component of tight junction strands. Mol. Biol. Cell. 2000;11:4131–4142. doi: 10.1091/mbc.11.12.4131. [DOI] [PMC free article] [PubMed] [Google Scholar]
- Sharp PA. RNA interference –2001. Genes. Dev. 2001;15:485–490. doi: 10.1101/gad.880001. [DOI] [PubMed] [Google Scholar]
- Sheth B, Fesenko I, Collins JE, Moran B, Wild AE, Anderson JM, Fleming TP. Tight junction assembly during mouse blastocyst formation is regulated by late expression of ZO-1 α+ isoform. Development. 1997;124:2027–2037. doi: 10.1242/dev.124.10.2027. [DOI] [PubMed] [Google Scholar]
- Sheth B, Moran B, Anderson JM, Fleming TP. Post-translational control of occludin membrane assembly in mouse trophectoderm: a mechanism to regulate timing of tight junction biogenesis and blastocyst formation. Development. 2000;127:831–840. doi: 10.1242/dev.127.4.831. [DOI] [PubMed] [Google Scholar]
- Soares ML, Haraguchi S, Torres-Padilla M, Kalmar T, Carpenter L, Bell G, Morrison A, Ring CA, Clarke NJ, Glover DM, Zernicka-Goetz M. Functional studies of signaling pathways in peri-implantation development of the mouse embryo by RNAi. BMC Dev. Biol. 2005;5:28–37. doi: 10.1186/1471-213X-5-28. [DOI] [PMC free article] [PubMed] [Google Scholar]
- Tsukita S, Furuse M, Itoh M. Multifunctional strands in tight junctions. Nat. Rev. Mol. Cell Biol. 2001;2:285–293. doi: 10.1038/35067088. [DOI] [PubMed] [Google Scholar]
- Umeda K, Ikenouchi J, Katahira-Tayama S, Furuse K, Sasaki H, Nakayama M, Matsui T, Tsukita S, Furuse M, Tsukita S. ZO-1 and ZO-2 independently determine where claudins are polymerized in tight-junction strand formation. Cell. 2006;126:741–754. doi: 10.1016/j.cell.2006.06.043. [DOI] [PubMed] [Google Scholar]
- Wianny F, Zernicka-Goetz M. Specific interference with gene function by double-stranded RNA in early mouse development. Nat. Cell Biol. 2000;2:70–75. doi: 10.1038/35000016. [DOI] [PubMed] [Google Scholar]
- Xu J, Jaya Kausalya P, Phua DCY, Ali SM, Hossain Z, Hunziker W. Early embryonic lethality of mice lacking ZO-2, but not ZO-3, reveals critical and non-redundant roles for individual ZO proteins in mammalian development. Mol. Cell. Biol. 2008 doi: 10.1128/MCB.00891-07. (in press) [DOI] [PMC free article] [PubMed] [Google Scholar]
- Yamanaka Y, Raiston A, Stephenson RO, Rossant J. Cell and molecular regulation of the mouse blastocyst. Dev. Dyn. 2006;235:2301–2314. doi: 10.1002/dvdy.20844. [DOI] [PubMed] [Google Scholar]
- Ziomek CA, Johnson MH. Cell surface interactions induce polarization of mouse 8-cell blastomeres at compaction. Cell. 1980;21:935–942. doi: 10.1016/0092-8674(80)90457-2. [DOI] [PubMed] [Google Scholar]


