

Abstract
This work investigated the effect of ultrasonic frequency on the threshold for blood-brain barrier (BBB) disruption induced by ultrasound pulses combined with an ultrasound contrast agent. Experiments were performed in rabbits using ultrasound pulses at 2.04 MHz using sonications with peak pressure amplitudes ranging from 0.3 to 2.3 MPa. BBB disruption was evaluated using contrast-enhanced magnetic resonance imaging. The threshold for BBB disruption was estimated using probit regression. Representative samples with similar amounts of contrast enhancement were examined in light microscopy. Results from these experiments were compared to data from previous studies that used ultrasound frequencies between 0.26 and 1.63 MHz. We found that the BBB disruption threshold (value where the probability for disruption was estimated to be 50%) expressed in terms of the peak negative pressure amplitude increased as a function of the frequency. It appeared to be constant, however, when the exposures were expressed as a function of the mechanical index (peak negative pressure amplitude estimated in situ divided by square root of frequency). Regression of data from all frequencies resulted in an estimated mechanical index threshold of 0.46 (95% confidence intervals: 0.42–0.50). Histological examination of representative samples with similar amounts of blood-brain barrier disruption found that the number of regions containing extravasated red blood cells per unit area was substantially lower on average for lower ultrasound frequencies. This data suggests that the mechanical index is a meaningful metric for ultrasound-induced blood-brain barrier disruption, at least for when other parameters that are not taken into account by the mechanical index are not varied. It also suggests that lower frequency sonication produces less red blood cell extravasation per unit area.
Keywords: Ultrasound, blood-brain barrier, drug delivery
Introduction
The blood-brain barrier (BBB) is a major limitation to the delivery of drugs to the central nervous system (CNS). This barrier, which is formed by the anatomical and biochemical properties of brain endothelium, prevents all large-molecule agents and even most small-molecule agents from being delivered to the brain (Pardridge 2003). It is arguably the principle impediment to the use of therapeutics for CNS disease.
In the past few years, several studies in animals have demonstrated that low-power ultrasound pulses combined with an ultrasound contrast agent can temporarily disrupt the BBB with negligible associated effects to the brain (Hynynen et al. 2001; Choi et al. 2007; Yang et al. 2007; McDannold et al. 2005; Hynynen et al. 2005; Hynynen et al. 2006; McDannold et al. 2006; McDannold et al. 2007b; Treat et al. 2007). This phenomenon could be exploited for a noninvasive means for targeted drug delivery in the CNS. By systematically focusing the ultrasound beam at overlapping locations, one could potentially disrupt the barrier in a volume that conforms to the desired anatomical site. It could facilitate the use of therapeutic agents that are currently hampered by the BBB, such chemotherapy agents or drugs designed to treat neurodegenerative disease.
While the exact mechanisms for the disruption are not known, it is presumably related to the interaction between the ultrasound field, the microbubbles that make up the ultrasound contrast agent, and the microvasculature. The interaction between microbubbles and the ultrasound field is strongly affected by the ultrasound frequency (Leighton 1994). For example, the frequency has a large effect on the inertial cavitation threshold and on the growth of microbubbles within the ultrasound field during sonication. The purpose of this work was therefore to examine the relationship between the ultrasound frequency, the threshold for BBB disruption and the resulting tissue effects. To investigate this dependence, new data acquired using an ultrasound frequency of 2.04 MHz was compared to data acquired in previous studies acquired at frequencies ranging from 0.26 to 1.63 MHz (Hynynen et al. 2001; McDannold et al. 2005; Hynynen et al. 2005; Hynynen et al. 2006; McDannold et al. 2006; McDannold et al. 2007b; Treat et al. 2007).
Methods
The animal experiments were approved by our institutional animal committee. Male New Zealand white rabbits (weight: approximately 4 kg) were anesthetized using intramuscular injections of a mixture of 12 mg of sodium xylazine (Xyla-ject; Phoenix Pharmaceuticals, St Joseph, MO, USA) and 48 mg of ketamine hydrochloride (Abbott Laboratories, North Chicago, IL, USA) given per kg of body weight per hour. A craniotomy (approximately 2×2 cm) performed at least two weeks before the experiments provided an acoustic path into the brain. The craniotomy was performed to allow more accurate estimation of the peak focal pressure amplitude in the brain and to simplify the experiments (i.e., we did not have to correct for skull aberrations). The fur in the ultrasound beam path was removed before the experiments with clippers and depilatory cream. Ultrasound exposures (sonications) were then applied under MRI guidance at two non-overlapping locations in each hemisphere. These targets were one cm deep in the thalamus and approximately 2–3 mm from the midline. Forty-four locations were sonicated over the course of the experiments in 11 rabbits. Four locations were excluded from the analysis due to operator errors during the experiments.
The ultrasound field was generated with an air-backed spherically curved transducer (diameter/radius of curvature: 10/8 cm) with a center frequency of 0.69 MHz which was operated at its 3rd harmonic (2.04 MHz). It was driven by a function generator (Model 395, Wavetek, San Diego, CA, USA) and RF amplifier (model 240L, ENI Inc, Rochester, NY, USA). Electrical power was measured in each experiment with a power meter (model 438A, Hewlett Packard, Palo Alto, CA, USA) and dual directional coupler (model C173, Werlatone, Brewster, NY, USA). The transducer’s electrical impedance was matched to the output impedance of the amplifier (50Ω) by an external matching network. The ultrasound field was calibrated using methods described previously (Hynynen et al. 1997). The peak negative pressure amplitude was measured in a tank of degassed water using a calibrated membrane hydrophone (spot diameter 0.5 mm, GEC-Marconi Research Center, Chelmsford, England) for the entire pressure amplitude range used. Reported values for the rabbit experiments are estimates in the brain based on ultrasound attenuation through 10 mm of brain, assuming an attenuation coefficient of 5 Np/m/MHz (0.43 dB/cm/MHz) (Goss et al. 1978). The values for the rat brain are based on attenuation through 5 mm of brain using the same attenuation coefficient and take into account the insertion loss of the rat skull (Treat et al. 2007). Ultrasound attenuation through 1 mm of skin (measured in a rabbit using digital calipers) was also taken into account, assuming an attenuation coefficient of 40 Np/m/MHz (4.6 dB/cm/MHz), the median value reported in a review by Hynynen (Hynynen 1990).
Sonication parameters were: 20 s duration; burst length: 10 ms; pulse repetition frequency: 1 Hz. Ten seconds before each sonication, a bolus of ultrasound contrast agent (Optison, GE Healthcare, Milwaukee, WI) was injected intravenously through the ear vein at a dosage of 50 μl per kg of body weight. This dosage was selected as it in the range recommended for human use (0.5–5.0 ml; i.e., 7.1–71 μl/kg for a 70 kg adult). Optison injection was followed by a bolus injection of approximately two ml of saline to flush extension tubing that extended out of the MRI. Time between each sonication was approximately five minutes. This delay allowed for the agent to be mostly removed from the circulation.
The transducer was mounted in a three dimensional manually operated positioning system and was submerged in a tank of degassed, deionized water. The rabbit was placed supine on a plastic tray mounted above this tank. The ultrasound beam propagated vertically out of the water tank through a hole in this tray. Acoustic coupling between the water tank and the animal was provided by a plastic bag filled with degassed water. The experiments were performed in a clinical 1.5T MRI scanner (GE Healthcare, Milwaukee, WI, USA). A receive-only surface coil (7.6 cm diameter, GE Healthcare, Milwaukee, WI, USA) was placed below the head to provide imaging with a high signal-to-noise ratio. The ultrasound beam propagated through a hole in this coil. The experimental setup is diagrammed in Fig 1.
Figure 1.
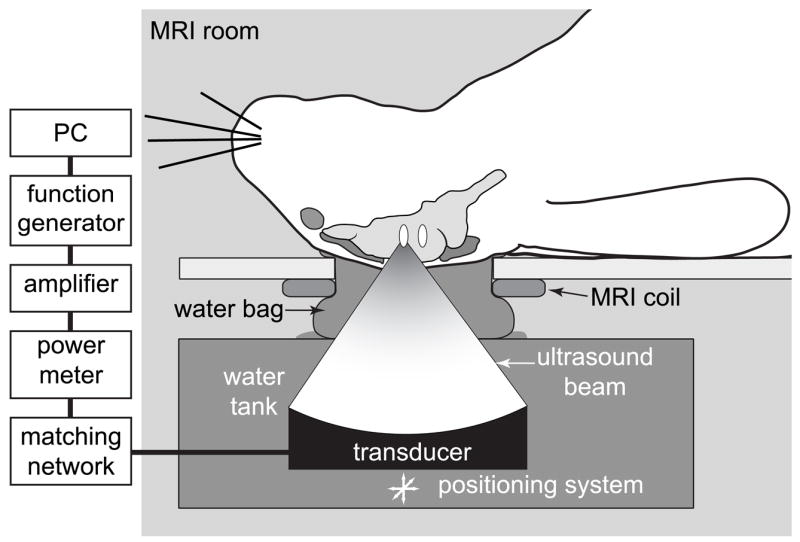
Diagram of the experimental setup.
BBB disruption was detected in contrast-enhanced T1-weighted fast spin echo images (parameters: TR/TE: 500/15–23 ms; ETL: 4; BW: 16 kHz; matrix size: 256×256; NEX: 4; FOV: 10 cm; slice thickness: 1.5 mm; interslice spacing: 1.5 mm). Immediately after the last sonication, a baseline set of axial T1-weighted images was acquired. Following the injection of contrast agent (: Magnevist®, Berlex Laboratories, Inc., Wayne, NJ, USA administered IV at a dose of 0.125 mmol per kg of body weight as a bolus injection), a time series of these images was acquired to evaluate the BBB disruption. Imaging was acquired for approximately 30 min after contrast injection.
Histological examination
The animals were sacrificed four hours after the last sonication. The brains were fixed using transcardial perfusion (0.9%NaCl-250 ml, 10% buffered formalin phosphate –500 ml) followed by removal of the brains and immersion fixation (in 10% buffered formalin phosphate). Representative locations were selected for histological examination. The locations were selected based on the amount of contrast enhancement observed in contrast MRI. They had signal enhancement that was within one standard deviation of the mean enhancement for sonications applied at a peak pressure amplitude of 0.5 MPa using an ultrasound frequency of 0.69 MHz. This criterion was selected because a previous study found that those parameters produced negligible effects to the brain (Hynynen et al. 2005). The brains selected for this analysis were embedded in paraffin and serially sectioned at 5 micrometers. Every 50th section (250 μm between sections) was stained with hematoxylin and eosin (H&E) for light microscopy evaluation. For each targeted location, all stained sections were examined and the single section that showed the largest tissue effects was identified. Regions containing either individual extravasated red blood cells or clumps of extravasated erythrocytes (see Results) were counted and compared to representative examples (using the same selection criteria) from previous studies in rabbits at different ultrasound frequencies (see table 1). Such data was not available for rats. One author (NV) who was blind to the acoustic parameters used performed the histology examination. This author was provided with anatomical MR images with marks indicating the targets.
Table 1.
Data for the different frequencies tested.
| Frequency (MHz) | Pressure amplitude (MPa)* | N locations (threshold) | Reference(s) | N locations (histology) | Reference |
|---|---|---|---|---|---|
| 0.26 | 0.1 – 0.6 | 54 | 1, 2 | 7 | 2 |
| 0.69 | 0.4 – 1.5 | 60 | 3, 4 | 8 | 4 |
| 1.50 | 0.4 – 2.6 | 119** | 5 | -- | -- |
| 1.63 | 0.7 – 4.7 | 139*** | 6, 7 | 13**** | 7 |
| 2.04 | 0.3 – 2.3 | 40 | N/A | 8 | N/A |
Estimates in the brain;
30s sonications in rats, 3T MRI; all other data acquired in rabbits with 20s sonications, 1.5T MRI;
100 ms bursts; all other data used 10 ms bursts;
Animals sacrificed 72h after sonication; all other cases, animals were sacrificed 4h after sonication
Data Analysis
The signal intensity enhancement at each location was found by measuring the mean percent increase in image intensity in a 3×3 voxel region of interest (ROI) in the contrast-enhanced T1-weighted imaging. The percent increase in a 5×5 voxel ROI in a nearby non-sonicated region (control) was subtracted from this value to exclude enhancement due to contrast in the vasculature. BBB disruption was determined to have occurred if the mean percent change in the target ROI was greater than one standard deviation of the enhancement measured in larger control ROI.
The probability for BBB disruption, with 95% confidence intervals, was estimated as a function of peak negative pressure amplitude using probit analysis, a regression model for the analysis of categorical data often used for bioassay work (Finney 1971). The threshold was defined as the value where the probability for BBB disruption was estimated to be 50%. This threshold was selected because it was a robust estimate compared to larger or smaller values where the confidence intervals were large. The probit regression is most robust at the mean of the independent variable, which was near the 50% probability in our data. Also, the range in pressure amplitudes where the probability for BBB disruption transitioned between 0 and 100% was not constant for the different frequencies. Presumably, this difference was due to experimental artifacts such as outliers, but we cannot rule out a frequency dependence of this transition “width” which could yield a different interpretation of our results.
The BBB disruption threshold for sonications at 2.04 MHz was compared with results at other frequencies obtained previously in rabbits (Hynynen et al. 2001; McDannold et al. 2005; Hynynen et al. 2005; Hynynen et al. 2006; McDannold et al. 2006; McDannold et al. 2007b) and rats (Treat et al. 2007) (see table 1 for details). Except where noted, these experiments were performed under identical conditions. These data was used to investigate the functional form of the BBB disruption threshold (T) as a function of frequency (f). The equation:
| (1) |
was fit using weighted non-linear least squares regression (Gauss-Newton algorithm with Levenberg-Marquardt modifications for global convergence) to find values of the constants a and b. The weights were the one divided by the square of the 95% confidence intervals found in the probit regression. Based on the value of b found in this regression (see results), we converted all of the data to mechanical index (MI), defined here as the peak negative pressure amplitude in situ divided by the square root of the frequency, and found a single BBB disruption threshold for the combined data. Note that for commercial ultrasound imaging, the MI is defined using a uniform attenuation coefficient of 3.45 Np/m/MHz. We chose to use a more accurate in situ estimate by employing literature values for the brain and skin attenuation. Calculating a single MI threshold using the uniform attenuation resulted in a small (less than 2%) increase and would not change our conclusions. Other statistical analysis consisted of calculation of means and standard deviations for the number and density of regions containing extravasations and for the contrast enhancement for those locations. The values for these measurements at each frequency were compared using unpaired two-tailed student’s t-tests. All data analysis was performed by one author (NM) using software written in-house in Matlab (version 7.0, the Mathworks, Natick, MA, USA).
Results
The MRI signal intensity enhancement is plotted as a function of peak negative pressure amplitude for the 2.04 MHz sonications in fig. 2. The probability for BBB disruption as a function of this pressure amplitude and the probit regression used to estimate the value at which the probability was 50% are also shown. For this frequency, this threshold was estimated to be 0.69 MPa (CI: 0.55 – 0.87).
Figure 2.
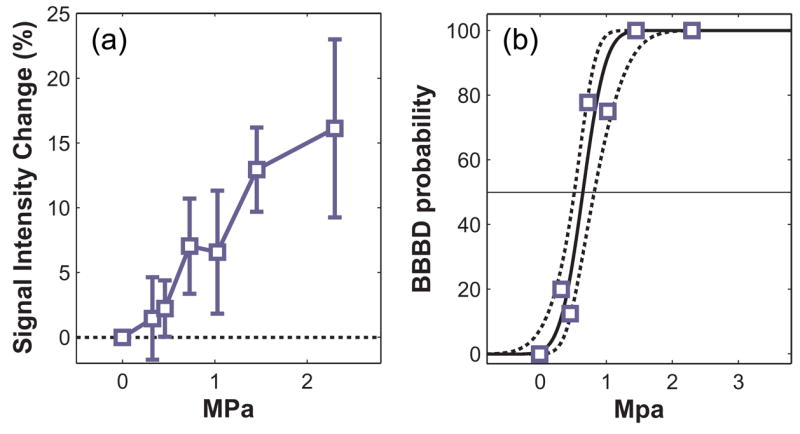
A: Signal enhancement in contrast-enhanced T1-weighted MR images as a function of peak negative pressure amplitude for sonications applied at an ultrasound frequency of 2.04 MHz. B: Probability for BBB disruption (BBBD) as a function of peak negative pressure amplitude. The solid line indicates the probit regression of this data; dotted lines indicate 95% confidence intervals.
Representative examples of contrast-enhanced MRI from the different experiments (Table 1) are shown in fig. 3. The threshold for BBB disruption increased as a function of ultrasound frequency (fig. 4). Regression of this data to equation (1) yielded a value of 0.45 MPa/MHz for a (95% confidence intervals: 0.40–0.50) for b of b=0.48 (95% confidence intervals: 0.37–0.59). The correlation coefficient of the regression (R2) was 0.98.. Since b=0.5 in the definition of the mechanical index (MI), this result suggests that the threshold for BBB disruption expressed in terms of MI is independent of the frequency. Plotting the threshold in MI as a function of frequency (fig 4, right) also demonstrates this independence. Based on this finding, the data from all ultrasound frequencies was combined and a single threshold for BBB disruption was found in MI. The threshold for BBB disruption in MI was estimated to be 0.46 (95% confidence intervals: 0.42–0.50).
Figure 3.
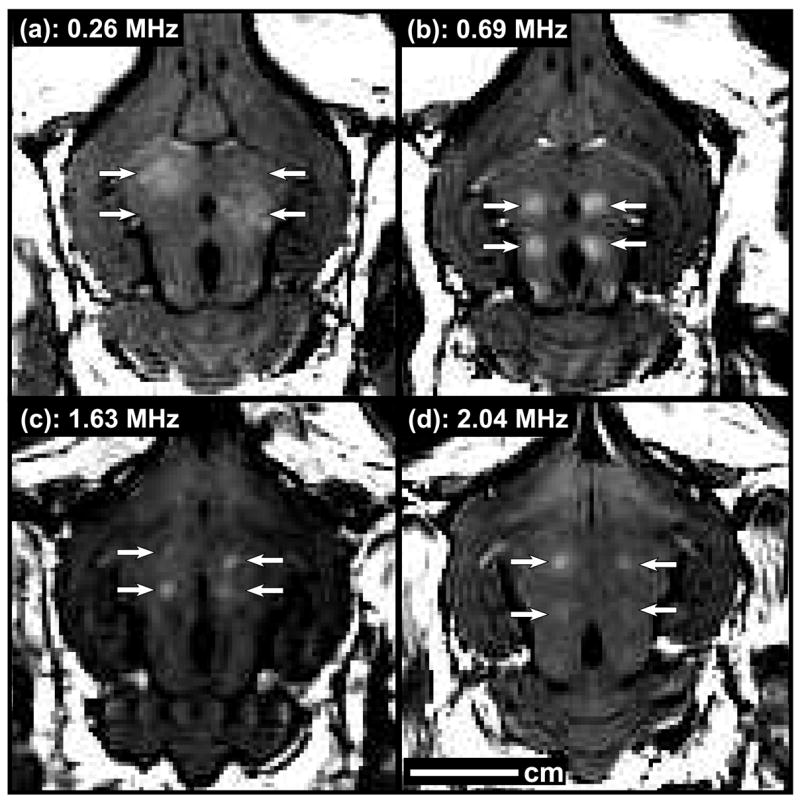
Examples of contrast-enhanced T1-weighted MR images of rabbit brains showing targeted BBB disruption, indicated by focal contrast enhancement, for the different frequencies tested in these studies. Four sonications were targeted in each brain. Note that two locations sonicated at 0.26 MHz did not result in BBB disruption in these examples.
Figure 4.
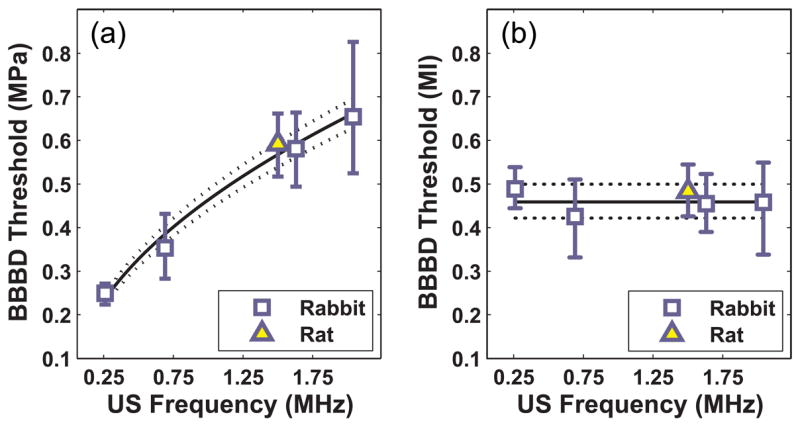
A: BBB disruption (BBBD) threshold as a function of ultrasound frequency. B: BBB disruption threshold as a function of the mechanical index (MI), which appeared to be the same for the different frequencies tested. Solid line: regression of data to eq. (1); dotted lines: 95% confidence intervals.
Histological changes at 2.04 MHz were small and generally limited to minor vascular damage, as indicated by tiny clumps of extravasated erythrocytes or individual extravasated red blood cells that were scattered about the sonicated regions (fig. 5). The brain tissue generally appeared to be otherwise unaffected. The number of regions containing extravasations that was produced per sonication decreased slightly on average as the ultrasound frequency increased for the representative samples examined, although substantial variation was observed and the difference between the different frequencies was not significant (fig. 6A). However, the density of extravasations (number of extravasations divided by πr2, where r is the beam radius measured in a water tank) was often much higher for the 1.63 and 2.04 MHz sonications than any of the lower frequency sonications (fig. 6B). On average, significantly more extravasations per unit area (P<0.05) were found with 1.63 MHz than at 0.26 or 0.69 MHz. These differences were evident even though the amount of contrast enhancement was similar for these samples (fig. 6C).
Figure 5.

Typical tissue effects as seen in histology. Histological changes were limited generally to minor vascular damage, as indicated by the presence of individual extravasated red blood cells or, as shown here, clumps of extravasated erythrocytes. (B: High magnification view of rectangle in A; Bar: 100 μm)
Figure 6.

A: Number of regions containing extravasations as a function of ultrasound frequency. B: The density of extravasations vs. frequency. This density was defined as the number of areas with extravasation divided by πr2, where r is the half width of beam plots measured in water with a needle hydrophone. Lower ultrasound frequencies had fewer cells per unit area on average, but substantial variation was present. C: MRI contrast enhancement. Mean ± standard deviation shown.
Discussion
The results of this study suggest that the BBB disruption threshold increases as the square root of frequency, which is consistent with the assumption underlying the MI. This result is in general agreement with some prior work that found that thresholds for lung damage in mice (Child et al. 1990), killing of fruit fly larvae (Child et al. 1990), membrane damage in plants (Miller and Thomas 1993), and inertial cavitation of ultrasound contrast agents in solution (Giesecke and Hynynen 2003) are consistent with the frequency dependence that defines the MI. However, several other studies investigating ultrasound bioeffects have clearly shown that this is not always the case (Miller and Dou 2004; O’Brien, Jr. et al. 2006; Stieger et al. 2007; Church and O’Brien, Jr. 2007). Indeed, other work indicates that the threshold and magnitude of the BBB disruption change when the burst length is reduced below 10 ms (McDannold et al. 2007a). Nevertheless, this work supports the use of MI as a meaningful index for ultrasound-induced vascular bioeffects in the presence of microbubbles provided that other sonication parameters such as burst length are kept constant.
The MI was developed based on theoretical formulation of inertial cavitation thresholds in water and blood and is used as a standard for setting limits on non-thermal bioeffects produced by ultrasound (Apfel and Holland 1991). This formulation was based on analytical models of microbubble growth as a function of ultrasound frequency. While ultrasound-induced BBB disruption is presumably related to the interaction of the microbubbles and the brain vasculature, inertial cavitation does not appear necessary (McDannold et al. 2006). Other mechanisms that could be responsible include radiation force, stretching of the vessel walls during bubble oscillation, and acoustic streaming of the fluid surrounding the bubbles. Each of these effects should be related to bubble growth, so perhaps these results are not surprising.
We also found that for sonications that produced a similar amount of BBB disruption based on MRI contrast enhancement, the lower ultrasound frequencies produced fewer extravasations per unit area than 1.63 or 2.04 MHz. This finding is in agreement with qualitative observations in earlier studies (Hynynen et al. 2006; McDannold et al. 2006). These extravasations are perhaps the result of micro-damage to the blood vessels resulting from inertial cavitation. The larger amount observed at higher frequencies may be due to the resonant frequency (approximately 2 MHz (Forsberg et al. 2000)) of the microbubbles that make up Optison. Perhaps inertial cavitation was more likely to occur at frequencies near the resonant size. This reason would be somewhat puzzling, however, since those frequencies had a higher BBB disruption threshold. Perhaps there are two mechanisms that are occurring simultaneously: a mechanism that results in BBB disruption (active transport across the endothelial cells and passage through tight junctions (Sheikov et al. 2004)) and inertial cavitation that results in tiny injuries/tears in the microvasculature and extravasated erythrocytes. The thresholds and relative contribution for these two mechanisms could have different frequency responses and both will contribute to the penetration of agents into the brain. Perhaps at higher frequencies the threshold for the BBB disruption is closer to the inertial cavitation threshold. Another factor to consider is that the behavior of microbubbles may be different in small blood vessels (Sassaroli and Hynynen 2004). Further experiments are needed to understand the frequency dependence that was observed here.
Having fewer extravasated erythrocytes at lower frequencies is particularly satisfying since such frequencies are less affected by the skull bone. In particular, it may be possible to use a frequency of approximately 0.25 MHz or lower without having to correct for skull-induced aberration (Yin and Hynynen 2005), perhaps allowing for a relatively simple ultrasound device. Note that we have found that these extravasations can be avoided altogether using 0.26 MHz sonication for lower-level BBB disruption (Hynynen et al. 2006; McDannold et al. 2006).
This data was potentially limited by the spatial resolution of the MRI. It is possible that small regions with BBB disruption existed below our detection limit for the higher frequency sonications. Such opening may also have resulted in fewer regions with extravasated red blood cells. Future work using higher resolution imaging methods or testing overlapping sonications are necessary to confirm that this did not occur. It would also be useful to investigate whether the observed frequency dependence will be replicated using parameters not taken into account by the mechanical index or when short pulses similar to those used in ultrasound imaging (for which the mechanical index was developed) are used. Finally, it would be interesting to test whether our observed frequency response holds at frequencies above 2 MHz.
Conclusion
The results from this study suggest that the BBB disruption threshold has a frequency dependence consistent with the assumption underlying the MI. These results also suggest that lower frequency sonication is associated with less micro-damage to the vasculature per unit area. This latter result is favorable with respect to moving this technology to patients, as lower frequency devices are less affected by the skull.
Acknowledgments
Support: NIH (R01EB003268, R33EB000705, U41RR019703). The authors thank Yongzhi Zhang for his help with these experiments.
Footnotes
Publisher's Disclaimer: This is a PDF file of an unedited manuscript that has been accepted for publication. As a service to our customers we are providing this early version of the manuscript. The manuscript will undergo copyediting, typesetting, and review of the resulting proof before it is published in its final citable form. Please note that during the production process errors may be discovered which could affect the content, and all legal disclaimers that apply to the journal pertain.
Reference List
- Apfel RE, Holland CK. Gauging the likelihood of cavitation from short-pulse, low-duty cycle diagnostic ultrasound. Ultrasound Med Biol. 1991;17:179–185. doi: 10.1016/0301-5629(91)90125-g. [DOI] [PubMed] [Google Scholar]
- Child SZ, Hartman CL, Schery LA, Carstensen EL. Lung damage from exposure to pulsed ultrasound. Ultrasound Med Biol. 1990;16:817–825. doi: 10.1016/0301-5629(90)90046-f. [DOI] [PubMed] [Google Scholar]
- Choi JJ, Pernot M, Small SA, Konofagou EE. Noninvasive, transcranial and localized opening of the blood-brain barrier using focused ultrasound in mice. Ultrasound Med Biol. 2007;33:95–104. doi: 10.1016/j.ultrasmedbio.2006.07.018. [DOI] [PubMed] [Google Scholar]
- Church CC, O’Brien WD., Jr Evaluation of the threshold for lung hemorrhage by diagnostic ultrasound and a proposed new safety index. Ultrasound Med Biol. 2007;33:810–818. doi: 10.1016/j.ultrasmedbio.2006.11.006. [DOI] [PMC free article] [PubMed] [Google Scholar]
- Finney DJ. Probit Analysis. Cambridge, U.K.: Cambridge University Press; 1971. [Google Scholar]
- Forsberg F, Shi WT, Goldberg BB. Subharmonic imaging of contrast agents. Ultrasonics. 2000;38:93–98. doi: 10.1016/s0041-624x(99)00148-1. [DOI] [PubMed] [Google Scholar]
- Giesecke T, Hynynen K. Ultrasound-mediated cavitation thresholds of liquid perfluorocarbon droplets in vitro. Ultrasound Med Biol. 2003;29:1359–1365. doi: 10.1016/s0301-5629(03)00980-3. [DOI] [PubMed] [Google Scholar]
- Goss SA, Johnston RL, Dunn F. Comprehensive compilation of empirical ultrasonic properties of mammalian tissues. J Acoust Soc Am. 1978;64:423–457. doi: 10.1121/1.382016. [DOI] [PubMed] [Google Scholar]
- Hynynen K. Biophysics and technology of ultrasound hyperthermia. In: Gautherie M, editor. Methods of External Hyperthermic Heating. New York: Springer-Verlag; 1990. [Google Scholar]
- Hynynen K, McDannold N, Sheikov NA, Jolesz FA, Vykhodtseva N. Local and reversible blood-brain barrier disruption by noninvasive focused ultrasound at frequencies suitable for trans-skull sonications. Neuroimage. 2005;24:12–20. doi: 10.1016/j.neuroimage.2004.06.046. [DOI] [PubMed] [Google Scholar]
- Hynynen K, McDannold N, Vykhodtseva N, Jolesz FA. Noninvasive MR imaging-guided focal opening of the blood-brain barrier in rabbits. Radiology. 2001;220:640–646. doi: 10.1148/radiol.2202001804. [DOI] [PubMed] [Google Scholar]
- Hynynen K, McDannold N, Vykhodtseva N, Raymond S, Weissleder R, Jolesz FA, Sheikov N. Focal disruption of the blood–brain barrier due to 260-kHz ultrasound bursts: a method for molecular imaging and targeted drug delivery. J Neurosurgery. 2006;105:445–454. doi: 10.3171/jns.2006.105.3.445. [DOI] [PubMed] [Google Scholar]
- Hynynen K, Vykhodtseva NI, Chung AH, Sorrentino V, Colucci V, Jolesz FA. Thermal effects of focused ultrasound on the brain: determination with MR imaging. Radiology. 1997;204:247–253. doi: 10.1148/radiology.204.1.9205255. [DOI] [PubMed] [Google Scholar]
- Leighton TG. The Acoustic Bubble. San Diego, CA: Academic Press Limited; 1994. [Google Scholar]
- McDannold N, Vykhodtseva N, Hynynen K. Targeted disruption of the blood-brain barrier with focused ultrasound: association with cavitation activity. Phys Med Biol. 2006;51:793–807. doi: 10.1088/0031-9155/51/4/003. [DOI] [PubMed] [Google Scholar]
- McDannold N, Vykhodtseva N, Hynynen K. Parametric study of acoustic parameters on blood-brain barrier disruption induced by ultrasound and an ultrasound contrast agent. Proceedings of the 7th International Symposium on Therapeutic Ultrasound; Seoul, South Korea. 2007a. in press. [Google Scholar]
- McDannold N, Vykhodtseva N, Hynynen K. Use of ultrasound pulses combined with Definity for targeted blood-brain barrier disruption: A feasibility study. Ultrasound Med Biol. 2007b;33:584–590. doi: 10.1016/j.ultrasmedbio.2006.10.004. [DOI] [PMC free article] [PubMed] [Google Scholar]
- McDannold N, Vykhodtseva N, Raymond S, Jolesz FA, Hynynen K. MRI-guided targeted blood-brain barrier disruption with focused ultrasound: Histological findings in rabbits. Ultrasound Med Biol. 2005;31:1527–1537. doi: 10.1016/j.ultrasmedbio.2005.07.010. [DOI] [PubMed] [Google Scholar]
- Miller DL, Dou C. Membrane damage thresholds for 1- to 10-MHz pulsed ultrasound exposure of phagocytic cells loaded with contrast agent gas bodies in vitro. Ultrasound Med Biol. 2004;30:973–977. doi: 10.1016/j.ultrasmedbio.2004.05.010. [DOI] [PubMed] [Google Scholar]
- Miller DL, Thomas RM. Ultrasonic gas body activation in Elodea leaves and the mechanical index. Ultrasound Med Biol. 1993;19:343–351. doi: 10.1016/0301-5629(93)90106-x. [DOI] [PubMed] [Google Scholar]
- O’Brien WD, Jr, Simpson DG, Frizzell LA, Zachary JF. Superthreshold behavior of ultrasound-induced lung hemorrhage in adult rats: role of pulse repetition frequency and pulse duration. J Ultrasound Med. 2006;25:873–882. doi: 10.7863/jum.2006.25.7.873. [DOI] [PMC free article] [PubMed] [Google Scholar]
- Pardridge WM. Blood-brain barrier drug targeting: the future of brain drug development. Mol Interv. 2003;3:90–105. 51. doi: 10.1124/mi.3.2.90. [DOI] [PubMed] [Google Scholar]
- Sassaroli E, Hynynen K. Forced linear oscillations of microbubbles in blood capillaries. J Acoust Soc Am. 2004;115:3235–3243. doi: 10.1121/1.1738456. [DOI] [PubMed] [Google Scholar]
- Sheikov N, McDannold N, Vykhodtseva N, Jolesz F, Hynynen K. Cellular mechanisms of the blood-brain barrier opening induced by ultrasound in presence of microbubbles. Ultrasound Med Biol. 2004;30:979–989. doi: 10.1016/j.ultrasmedbio.2004.04.010. [DOI] [PubMed] [Google Scholar]
- Stieger SM, Caskey CF, Adamson RH, Qin S, Curry FR, Wisner ER, Ferrara KW. Enhancement of vascular permeability with low-frequency contrast-enhanced ultrasound in the chorioallantoic membrane model. Radiology. 2007;243:112–121. doi: 10.1148/radiol.2431060167. [DOI] [PubMed] [Google Scholar]
- Treat LH, McDannold N, Zhang Y, Vykhodtseva N, Hynynen K. Targeted delivery of doxorubicin to the rat brain at therapeutic levels using MRI-guided focused ultrasound. Int J Cancer. 2007;121:901–907. doi: 10.1002/ijc.22732. [DOI] [PubMed] [Google Scholar]
- Yang FY, Fu WM, Yang RS, Liou HC, Kang KH, Lin WL. Quantitative evaluation of focused ultrasound with a contrast agent on blood-brain barrier disruption. Ultrasound Med Biol. 2007;33:1421–1427. doi: 10.1016/j.ultrasmedbio.2007.04.006. [DOI] [PubMed] [Google Scholar]
- Yin X, Hynynen K. A numerical study of transcranial focused ultrasound beam propagation at low frequency. Phys Med Biol. 2005;50:1821–1836. doi: 10.1088/0031-9155/50/8/013. [DOI] [PubMed] [Google Scholar]