

Abstract
Chronic cocaine use in humans and animal models is known to lead to pronounced alterations in neuronal function in the nucleus accumbens (NAc), a brain region associated with drug reinforcement. Two-dimensional gel electrophoresis was used to compare protein alterations in the NAc between cocaine overdose (COD) victims (n = 10) and controls (n = 10). Following image normalization, spots with significantly differential image intensities (P < 0.05) were identified, excised, trypsin digested and analyzed by matrix-assisted laser desorption ionization-time of flight-time of flight. A total of 1407 spots were found to be present in a minimum of five subjects per group and the intensity of 18 spots was found to be differentially abundant between the groups, leading to positive identification of 15 proteins by peptide mass fingerprinting (PMF). Of an additional 37 protein spots that were constitutively expressed, 32 proteins were positively identified by PMF. Increased proteins in COD included β-tubulin, liprin-α3 and neuronal enolase, whereas decreased proteins included parvalbumin, ATP synthase β-chain and peroxiredoxin 2. The present data provide a preliminary protein profile of COD, suggesting the involvement of novel proteins and pathways in the expression of this complex disease. Additional studies are warranted to further characterize alterations in the differentially regulated proteins. Understanding the coordinated involvement of multiple proteins in cocaine abuse provides insight into the molecular basis of the disease and offers new targets for pharmacotherapeutic intervention for drug abuse-related disorders.
Keywords: human, post-mortem, mass spectrometry, 2-D fluorescence difference gel electrophoresis, synaptic signaling
Introduction
Cocaine abuse/dependence is a devastating neuro-psychiatric illness characterized by chronic and persistence drug use usually involving patterns of abstinence and binge use, impaired social and occupational functioning, paranoid ideation, aggression, anxiety and depression.1 Historically, the abuse liability of cocaine is attributed to the direct effects of the drug on dopamine uptake blockade, yielding elevated extracellular dopamine concentrations that occur in discrete areas of the brain, specifically the nucleus accumbens (NAc), ventral tegmental area (VTA), prefrontal cortex – regions of the mesolimbic dopamine pathway, which originates in the VTA and projects to several forebrain regions, most notably the NAc.2–5 In humans, neuroimaging studies have revealed cocaine-induced functional activation of the NAc following acute drug administration in cocaine-dependent subjects6 and bilateral activation following imagery-induced drug craving.6–8 These data support numerous studies in animal models demonstrating the role of the NAc in the reinforcing effects of cocaine.9–14
Although regional and neurotransmitter-centric hypotheses have provided a framework for studying the acute and chronic effects of cocaine intake on the brain, detailed mechanisms of intra-cellular neuroadaptations have only recently become known. Repeated cocaine use induces biochemical adaptations in reinforcement-relevant brain regions15–17 and these adaptations appear to be relevant to the processes of sensitization, craving, withdrawal and relapse.18 In humans, the functional activity of the NAc is associated with the subjective effects of cocaine6 and with craving for cocaine.7,8,19 In addition to the cocaine-induced NAc plasticity, studies in rodent models indicate persistent or even permanent biochemical alterations in regions associated with the mesolimbic dopamine pathway including upregulation of the cyclic AMP (cAMP) pathway,20–26 activator protein 1 family members27–32 as well as glutamate, dopamine, γ-aminobutyric acid (GABA) and opiate receptors, growth factors, cytoskeletal elements and cell metabolism.33–41
Genomic analyses in human post-mortem tissue of cocaine overdose (COD) victims have confirmed the findings of studies employing rodent models and have revealed novel mechanisms of drug-induced neuronal and non-neuronal dysregulation in human post-mortem brain tissue.42–45 For example, Bannon and co-workers42 examined gene expression in the NAc of post-mortem brain tissue of human cocaine abusers and controls and found significant alterations in several novel functional classes and transcripts including signal transduction, transcriptional and translational processing, neurotransmission and synaptic function, glia, structural and cell adhesion, receptors/transporters/ion channels, cell cycle and growth and lipid and protein processing. Interestingly, they identified several myelin-associated transcripts that were significantly decreased in the NAc of cocaine abusers including myelin basic protein (MBP), proteolipid protein 1 (PLP) and myelin-associated oligodendrocyte basic protein (MOBP), which were confirmed by quantitative PCR. In a separate cohort, Hemby and colleagues evaluated a targeted set of transcripts in the VTA and lateral substantia nigra (l-SN) and found significant upregulation of numerous transcripts and their encoded proteins in the VTA, but not l-SN, of cocaine overdose victims including the N-methyl-D-asparatate receptor subunit NR1, α-amino-3-hydroxy-5-methyl-4-isoxazole-propionic acid receptor subunit GluR2 and kainate receptor subunits GluR5 and KA2 mRNAs.43 Similarly, protein levels of NR1 and GluR2/3, with trends in GluR1 and GluR5, were found to be increased in the NAc but not putamen of cocaine overdose victims,44 suggesting that these alterations are pathway specific and may contribute to persistent drug intake and craving in the human cocaine abuser. These studies suggest that multiple pathways are involved in the neuropathology and altered neuronal function of cocaine addicts. As noted for alcoholism,46 such studies highlight the importance of using high-throughput technologies to study in more detail the neuropathology associated with addictive disorders. Although these studies have been highly informative in furthering our understanding of cocaine-induced transcriptional regulation contributing to long-term changes in primate brain, research determining coordinate changes in the expression of multiple proteins has been scarce.47 To develop a more comprehensive understanding of the neuro-adaptive processes involved in cocaine abuse, it is necessary, reasonable and timely to evaluate regional brain proteomes in human COD victims. To date, no large-scale analyses of protein expression in the human drug addicted brain have been made.
Recent technological developments have made the simultaneous, quantitative examination of hundreds to thousands of proteins and protein modifications possible in post-mortem brain tissue of individuals diagnosed with psychiatric illness, including alcoholism.46,48–51 Such studies have confirmed the differential abundance of certain proteins and provided refined hypotheses regarding the molecular mechanisms of these diseases. Two-dimensional electrophoresis (2DE), which separates protein species by both isoelectric point and molecular weight,52 has been widely used and recently been improved through the addition of direct labeling of proteins with cyanine (Cy) dyes to facilitate quantitation (two-dimensional difference gel electrophoresis (2D-DIGE)).53–56 Quantitative proteomics, such as 2D-DIGE, is an open discovery platform (i.e. proteins are identified post hoc) in which proteins of interest are excised from 2DE gels, digested with trypsin, analyzed by mass spectrometry and the masses are compared against predicted or known peptide profiles of proteins for matching via peptide mass fingerprinting (PMF).57–59 Increased accuracy of identification can be accomplished through tandem mass spectrometry (MS/MS) to generate protein sequence data in addition to peptide masses.
The use of proteomic strategies, which provide broad and unbiased coverage of the proteome, can be used to understand the multitude of effects of cocaine on protein function. In the present study, identification of differentially expressed proteins from the NAc of COD and controls was assessed by fluorescence 2D-DIGE combined with tandem mass spectrometry analysis. Protein expression profiles of COD and controls were compared using DeCyder image analysis software and differentially expressed proteins were identified by matrix-assisted laser desorption ionization-time of flight-time of flight (MALDI-ToF/ToF) mass spectrometry. In addition to proteins previously implicated in cocaine addiction, novel proteins were also identified.
Materials and methods
Subjects and tissue
Brain tissue was obtained at autopsy from age-matched drug-free control individuals and COD victims at the University of Miami Brain Endowment Bank as described previously.60,61 A diagnostic neuropathology examination at the gross and microscopic level, of multiple cortical and subcortical areas, revealed no neuropathological abnormalities relevant to the mental status. The NAc from 10 control and 10 COD human subjects was used for this study (Table 1). A semiquantitative neuropathological assessment found negligible neuronal loss, ischemic changes or reactive gliosis. All cases were retrospectively accrued based on the toxicological data and the circumstances surrounding death to carefully classify cocaine intoxication in the COD cases. This included a review of the prior arrest records and treatment admissions as well as pathological indications such as perforation of nasal septum and needle track marks. All the cases were evaluated for common drugs of abuse including alcohol. The positive urine screens were confirmed by quantitative analysis of blood to exclude cases from the study based on evidence of polydrug or alcohol use before death. Cocaine and benzoylecgonine concentrations were assessed by gas chromatography–mass spectrometry from the brain as well as blood.62
Table 1.
Clinical characteristics of COD and control subjects
| Subject no. | Race/sex | Age | PMI (h) | Brain pH | Cause of death |
|---|---|---|---|---|---|
| COD subjects | |||||
| COD 2 | W/M | 23 | 8 | 6.71 | Cocaine intoxication |
| COD 3 | W/M | 41 | 12 | 6.61 | Cocaine intoxication |
| COD 4 | W/M | 40 | 11.5 | 6.46 | Cocaine intoxication |
| COD 5 | B/M | 25 | 12 | 6.53 | Cocaine intoxication |
| COD 6 | W/M | 39 | 12 | 6.25 | Cocaine intoxication |
| COD 7 | W/M | 32 | 20 | 6.55 | Cocaine intoxication |
| COD 8 | B/M | 35 | 20.5 | 6.34 | Cocaine intoxication |
| COD 9 | W/M | 35 | 25.5 | 6.33 | Cocaine intoxication |
| COD 10 | W/M | 49 | 15 | 6.55 | Cocaine intoxication |
| Mean | 34.65 | 14.7 | 6.47 | ||
| s.e.m. | 3.11 | 1.84 | 0.05 | ||
| Median | 37 | 12 | 6.50 | ||
| Control subjects | |||||
| Control 1 | W/M | 45 | 18 | 6.80 | Blunt neck trauma |
| Control 2 | W/M | 27 | 14 | 6.42 | Idiopathic cardiac conduction system disease |
| Control 3 | W/M | 44 | 11.5 | 6.29 | Acute myocardial infarction |
| Control 4 | W/M | 37 | 14.5 | 6.59 | Atherosclerotic cardiovascular disease |
| Control 5 | B/M | 22 | 22 | 6.67 | GSW |
| Control 6 | W/M | 36 | 22 | 6.76 | OCAD |
| Control 7 | W/M | 34 | 14 | 6.29 | Critical coronary arteriosclerosis |
| Control 8 | B/M | 33 | 15 | 6.62 | Calcific aortic stenosis |
| Control 9 | W/M | 34 | 11.5 | 6.63 | Acute asthmatic bronchitis |
| Control 10 | W/M | 46 | 11 | 6.43 | Aortic aneurysm |
| Mean | 36 | 15.35 | 6.55 | ||
| s.e.m. | 2.56 | 1.35 | 0.06 | ||
| Median | 35.5 | 14.25 | 6.61 | ||
Abbreviation: COD, cocaine overdose.
Protein isolation and fractionation
The brains were photographed after removal and cut into 1.5 cm coronal blocks to be subsequently frozen in 2-methyl butane on dry ice at −30°C and stored later at −80°C. One hundred and fifty milligram punches were dissected from the blocks containing NAc and caudate/putamen. The frozen brain tissue was homogenized into a dry homogenate using a steel mortar and pestle chilled in dry ice. Subcellular fractionation into membrane, nuclear and cytoplasmic fractions was performed as described previously.43,44 For the purposes of this study, only cytosolic fractions were evaluated. Studies are underway to assess the membrane and nuclear proteomes using alternative separation methodologies to enable detection of hydrophobic proteins difficult to detect by gel-based methods. Tissue samples were homogenized in 10 mM HEPES, 10 mM NaCl, 1 mM KH2PO4, 5 mM NaHCO3, 1 mM CaCl2, 0.5 mM MgCl2, 5 mM EDTA, 1 mM phenylmethylsulfonylfluoride, 10 mM benzamidine, 10 μg/ml aprotinin, 10 μg/ml leupeptin and 1 μg/ml pepstatin. Homogenates were centrifuged using a swinging bucket rotor (Beckman Coulter SW55Ti) at 5333 g for 5 min and the supernatant (cytosolic and crude membrane fraction) fractions were further centrifuged at 59 255 g for 30 min at 4°C and the cytosolic supernatant fraction collected was stored at −80°C. The cytosolic protein fraction from each subject was precipitated with 2D clean-up kits (GE Healthcare, Piscataway, NJ, USA; according to the manufacturer’s recommendation) at −20°C overnight. The next day, samples were pelleted by centrifugation at 12 000 r.p.m. for 5 min. The pellets were air-dried for 2 min and resuspended in 50 μl of sample buffer (30 mM Tris-HCl, 2 M thiourea, 7 M urea and 4% CHAPS, pH 8.5). After the samples were brought within a pH range of 8.0–9.0 using 0.1 N NaOH, the protein concentration was determined using the 2D-Quant kits (GE Healthcare).
Cyanine dye labeling
Minimal labeling of the lysine residues was achieved by reaction with Cy dyes. A normalization (pooled) sample was prepared by combining 50 μg from each of the 20 samples. The labeling of 50 μg of protein sample (each sample) was optimized by labeling with 200 pmol of appropriate dye (suspended in > 99.5% pure dimethylformamide).63 This permitted optimum labeling of the comparatively less abundant protein spots while still maintaining the most abundant protein spots in the dynamic linear range for quantitative image analyses. Each gel comprised a pooled sample labeled with Cy2 as well as COD and control samples labeled with either Cy3 or Cy5 as depicted in Figure 1 and outlined in Table 2. The labeling reaction was stopped by addition of 1 μl of 10 mM lysine on ice for 10 min. For each gel, the labeled pool sample and the labeled COD and control samples were mixed and an equal amount of rehydration buffer (2 M thiourea, 7 M urea, 2% dithiothreitol (DTT), 4% CHAPS and 2% pharmalyte (GE HealthCare)) was added and the total volume was brought up to 450 μl by Destreak rehydration buffer (GE HealthCare).65 For the ‘pick gel’, 50 μg of pooled sample was labeled with the Cy2 dye, which was combined with 750 μg of unlabeled pool sample. An equal amount of sample buffer was added and the total volume increased to 450 μl by the addition of Destreak rehydration buffer.
Figure 1.

Schematic of 2D-DIGE procedure comparing cytosolic fractions from COD and control subjects. The schematic represents comparison of a COD victim and an age-matched control labeled with Cy3 dye and Cy5 dye, respectively. Note that dye labeling was counterbalanced across groups for the study. A normalization pool comprising all COD and control samples was labeled with Cy2 dye and used to normalize spot location across all gels. Following labeling, samples were mixed and electrophoresed by two-dimensional polyacrylamide gel electrophoresis (2D-PAGE). Ten subjects from each group were electrophoresed on ten 2D gels simultaneously. Each gel was scanned at three wavelengths (λ) based on the excitation wavelengths of each dye. The images were further analyzed by DeCyder Image analysis software to determine differentially regulated protein spots. Gel images are representative and depict a defined section of the gel.
Table 2.
Experimental design
| Gel no. | Cyanine dye 2 | Cyanine dye 3 | Cyanine dye 5 |
|---|---|---|---|
| Subject code | |||
| 1 | Normalization pool | COD 1 | Control 1 |
| 2 | Normalization pool | Control 2 | COD 2 |
| 3 | Normalization pool | COD 3 | Control 3 |
| 4 | Normalization pool | Control 4 | COD 4 |
| 5 | Normalization pool | COD 5 | Control 5 |
| 6 | Normalization pool | Control 6 | COD 6 |
| 7 | Normalization pool | COD 7 | Control 7 |
| 8 | Normalization pool | Control 8 | COD 8 |
| 9 | Normalization pool | COD 9 | Control 9 |
| 10 | Normalization pool | Control 10 | COD 10 |
Gel 11: Normalization pool (200 μg) – preparative gel.
Two-dimensional polyacrylamide gel electrophoresis
The isoelectric focusing (IEF) was carried out on Immobiline DryStrips (240 × 3 × 0.5 mm, linear 4–7 pH, GE Healthcare, Piscataway, NJ, USA) using the GE Healthcare EttanIPGphor apparatus.64,65 Sequential IEF was done by step-and-hold as follows: 10 h at 0 V, 1 h at 100 V, 1 h at 500 V, 1 h at 1000 V, 3 h at 8000 V (gradient; 13.5 kV h), 7.5 h at 8000 V for a total of 75.1 kV h. A maximum current of 50 μA was applied per strip, maintaining the platform temperature at 20°C. After IEF, the IPG strips were equilibrated to reduce the disulfide bonds with gentle rocking for 10 min in equilibrating solution (6 M urea, 1.5 M Tris-HCl, pH 8.8, 30% (v/v) glycerol, 2% (w/v) sodium dodecyl sulfate (SDS) and 2% (w/v) DTT). To alkylate the SH groups of the proteins, the IPG strips were rocked for 10 min in solution containing 6 M urea, 1.5 M Tris-HCl, pH 8.8, 30% (v/v) glycerol, 2% (w/v) SDS and 2.5% (w/v) iodoacetamide.66 The proteins were further separated on the basis of their molecular weight on a pre-cast 8–15% gradient SDS-polyacrylamide gel electrophoresis (SDS-PAGE) (2400 × 2000 × 1 mm, Jule Inc., Milford, CT, USA) at a constant 4 W using the Ettan Dalt II System (GE Healthcare).67 Ten microliter of the molecular mass marker (Amersham Rainbow marker RPN 800) was loaded on 2 mm2 filter paper, which was placed on the basic end of the IPG strip.67,68 The slab gels were fixed overnight in 30% (v/v) methanol and 7.5% (v/v) acetic acid in distilled water.69 This was followed by washing the gels twice with DW (500 ml) for 10 min each. The ‘pick gel’ after fixation was stained with SyproRuby (Molecular Probes, Eugene, OR, USA) overnight as per the recommendations of the manufacturer. The next day, excess stain was removed by washing the gel twice with 10% methanol and 6% glacial acetic acid for 10 min each.
Gel image analysis
The Typhoon 9400 scanner (GE Healthcare) was used to scan all the gels at 100 μm resolution. The blue laser (488 nm) for excitation and 520 band pass emission filter was used for scanning the gel image of Cy2-labeled sample, the green laser (nm) for excitation and band pass emission filter was used for scanning Cy3-labeled sample and the red laser (633 nm) for excitation and 670 band pass emission filter was used for scanning Cy5-labeled sample. The photomultiplier tube was set to ensure maximum pixel intensity of 85 000–95 000 for all the images in every gel. To remove the extraneous areas of the gel image, the images were cropped using the Image-Quant V5.2 (GE Healthcare). The image analysis was performed by DeCyder 5.01 (GE Healthcare). The DeCyder DIA was initially employed for intra-gel analysis, followed by DeCyder BVA for inter-gel analysis. The DIA mode of DeCyder was employed for protein spot detection as well as for normalization of COD and control gel images to the pooled sample gel image. After spot detection, the abundance changes are represented by the normalized volume ratio (Cy3:Cy2 and Cy5:Cy2), represented by the ratio of COD or the control sample (Cy3 or Cy5) with respect to the pooled sample (Cy2). The DeCyder DIA normalization method assumes that most proteins are unchanged, having unit volume ratio. The following parameters were used for spot filtering: slope > 1.0, area < 350, peak height < 350 and volume < 100 000. The spots were authenticated manually for all the gels. Spot maps from all the gels were first matched by manual landmarks and then in automatic mode by DeCyder BVA. The protein spot matches were confirmed manually for all the gels. The average ratio (COD:control (n = 10)) as well as the corresponding Student’s t-test value for each protein spot was calculated based on all gel images in the DeCyder BVA mode.50 The protein of interest based on statistically significant t-test was further assessed by the three-dimensional spot profile to validate the spot on most of the gel images.
Mass spectrometry analysis
Protein spots of interest were subjected to mass spectrometry analysis for identification.70 The pick list of protein spots of interest was created using DeCyder DIA.71 Gel plugs of 2 mm size were cut robotically using the Ettan Spot Handling Workstation (GE Healthcare).50 Picked proteins were prepared for mass spectrometry analysis using a standard in-gel trypsin digestion protocol. Briefly, the gel plugs were washed for 20 min, twice in 50 mM ammonium bicarbonate/50% (v/v) methanol in water and once with 75% (v/v) acetonitrile (ACN) in DW for 30 min or until the gel plugs turn opaque. The ACN was removed after the final wash and dry gel plugs were dried at 40°C for 10 min. After the samples were cooled, they were incubated at 56°C for 45 min in 40 μl of 50 mM DTT/100 mM ammonium bicarbonate. The samples were allowed to cool after discarding the solution and immediately 40 μl of 100 mM iodoacetamide was added and the samples were incubated at room temperature (RT) for 30 min in dark. After discarding the above solution, a final wash was given by 100 μl of 50 mM ammonium bicarbonate/50% (v/v) methanol in water for 10–15 min at RT followed by drying the gel plugs by vacuum centrifugation. Twenty micrograms of lyophilized trypsin (883 pmol; Promega, Madison, WI, USA) was reconstituted in 1 ml of 20 mM ammonium bicarbonate and incubated for 15 min at 37°C. After drying, the gel plugs were incubated overnight at 37°C in 140 ng of sequencing grade trypsin (Promega). The supernatant from trypsin digest was transferred to a low-retention 96-well plate. Peptides from the gel pieces were sequentially extracted twice in 100 μl of extraction buffer (50% (v/v) ACN and 0.1% (v/v) trifluoroacetic acid (TFA) in DW). The original tryptic supernatant and the supernatants from two sequential extractions were combined and dried in a vacuum centrifuge. The dried peptides from each gel plug were dissolved in 5 μl of 50% (v/v) ACN and 0.1% TFA in DW and 0.5 μl deposited on the stainless-steel MALDI target plate. After drying, this was mixed with 0.5 μl of 6 mg/ml of α-cyano-4-hydroxy-cinnamic acid (Sigma-Aldrich, St Louis, MO, USA) in 50% (v/v) ACN and 0.1% TFA in DW.
Mass spectrometry analyses were performed using the Applied Biosystems 4700 Proteomics Analyzer (MALDI-ToF/ToF: Applied Biosystems, Foster City, CA, USA) in reflector mode for positive ion detection. The laser wavelength and the repetition rate were 355 nm and 200 Hz, respectively. All the mass spectrometry spectra resulted from accumulation of at least 2000 laser shots. The peak detection criteria used were minimum S/N of 8, local noise window width (m/z) of 200 and minimum peak width at full-width half-maximum (bins) of 2.9. The mass spectra were calibrated using the two trypsin auto-digest products: fragment 100–107 ([M + H]+ = 842.51 Da), fragment 98–107 ([M + H]+ = 1045.556 Da) and fragment 50–69 ([M + H]+ = 2211.105Da).72 Mass lists were submitted to GPS Explorer (Applied Biosystems) for protein identification.57 A maximum of 10 strongest precursor ions per sample were chosen for MS/MS analysis. The following monoisotopic precursor selection was used for the MS/MS: minimum S/N filter of 10, excluding the most commonly observed peptide peaks for trypsin and keratin, and excluding the precursors within 150 resolution. In the ToF1 stage, all ions were accelerated to 1 kV under conditions promoting metastable fragmentation. The peak detection criteria used were S/N of 8 and local noise window width of 250 (m/z).
Protein identification
Mass lists were submitted to GPS Explorer (Applied Biosystems) to search against the NCBInr (National Centre for Biotechnology Information non-redundant) primate database for protein identification.57 The following parameters were used: one allowed missed cleavage, ±50 p.p.m. for mass/charge (m/z) error for mass spectrometry and 0.1 Da mass/charge (m/z) error for MS/MS, partial modification of cysteine (carbamidomethyl-cysteine) and methionine (oxidized). PMF and MS/MS spectra were interpreted with the Mascot software (Matrix Science Ltd, London, UK).73,74 Database searches, through Mascot, using combined PMF and MS/MS data sets were performed via GPS Explorer software (Applied Biosystems). The probability score calculated by the software was used as the criterion for correct identification. The algorithm used for determining the probability-based scoring with a given mass spectrum is described in detail by Pappin et al.75 The criterion for identification was a MASCOT confidence interval greater than 95%. Protein identification was confirmed by checking the protein mass and pI accuracy.70
Results
Cytosolic fractions of NAc from human COD victims and controls were compared using the DIGE proteomics strategy to determine differences in the abundance levels of proteins in a pH range of 4–7 to elucidate the molecular mechanisms by which previous exposure to cocaine alters the cytosolic proteome of NAc (Figure 1). The total number of protein spots detected in the NAc of control and COD were 1555. Of these, 1407 protein spots were present in at least five or more control and COD subjects. The DeCyder image analysis of the images representing COD and control NAc cytosol proteome elucidated the putative COD-specific protein spots. Quantification of the individual protein spots revealed that the vast majority of ~1400 protein spots were quantitatively similar. As anticipated, the majority of these proteins were gene products relegated to structural and housekeeping functions. Image analysis of fluorescently labeled NAc cytosol lysates loaded together on 2D gels identified differential distributions of 18 protein spots characterized by 15 proteins after chronic exposure to cocaine (Figure 2). The most prominent categories of altered expression were membrane-associated proteins and proteins involved in cytoskeletal transformation. Even though there have been many studies reporting the cocaine-induced alterations in gene expression, this is the first study that utilizes a non-candidate approach to decipher the involvement of novel proteins and pathways.
Figure 2.
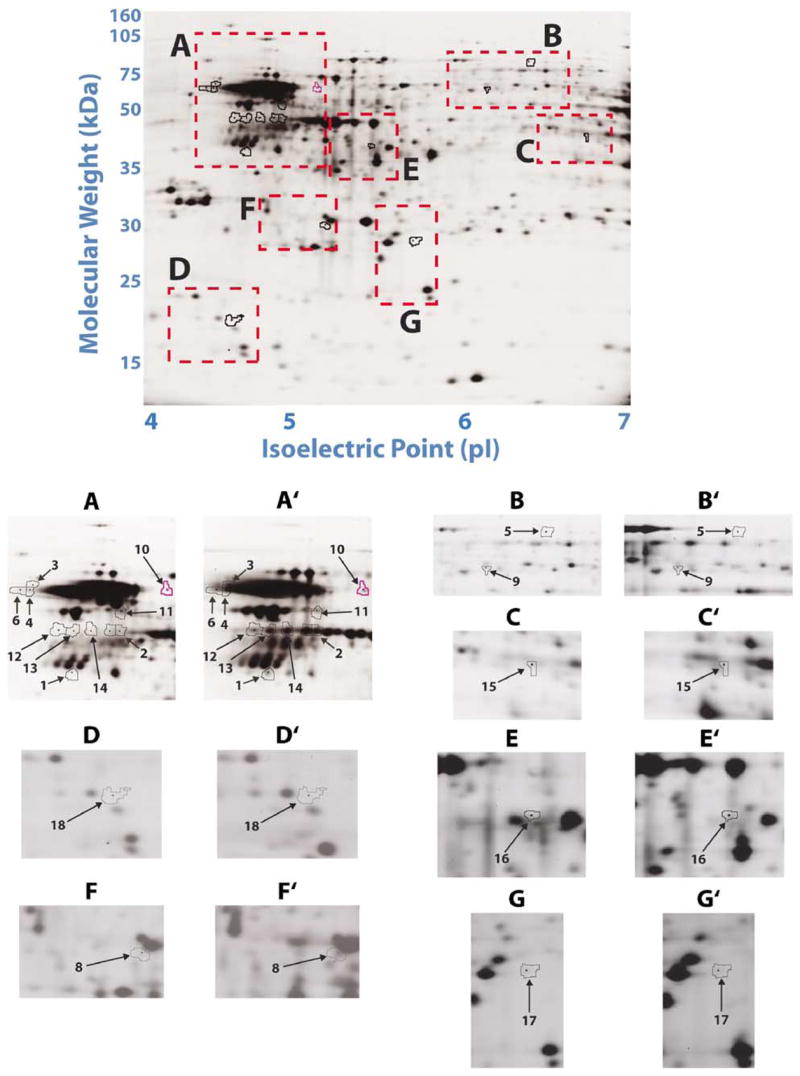
Representative 2D-DIGE-based comparison of control and COD groups. A representative 2D-DIGE image of cytosolic proteins from human the NAc control group. Cytosolic proteins were fractionated in the first dimension by a 4–7 linear pH gradient (pI) and in the second dimension by an 8–15% gradient SDS-PAGE gel (molecular weight, kDa). The areas marked with boxes are magnified and shown separately (A–G) and are compared with the corresponding areas from the COD group (A′–G′). The numbered protein spots marked with arrows are differentially regulated between control and COD subjects and correspond with numbers in Figures 2 and 3, and Table 3.
Several proteins exhibited statistically significant increases in COD victims including tubulin beta 2 (TUB2), desmoplakin, 60 kDa chaperone, liprin-α3 and neuron-specific enolase (NSE), whereas other proteins were statistically decreased in the COD victims including ATP synthase β-chain (ATPB), peroxiredoxin 2, isoform a (PRDX2) and centrosome protein cep290 (Figures 3 and 4). Several protein spots showed a strong trend towards differential expression, but were not statistically significantly different (spot 2: glial fibrillary acidic protein (GFAP) (P = 0.084); spot 5: sodium channel associated protein 1 (P = 0.079); and spot 15: brain type aldolase (P = 0.067)); however, the magnitude of differential expression warrants their inclusion. A representative DIGE gel image of the control NAc cytosol is shown in Figure 2. The areas of interest are magnified to show the abundance patterns of 18 protein spots, which were differentially regulated and characterized as 15 unique proteins. The magnitude of differential expression varied from a 1.21-fold decrease for brain-type aldolase (spot 15; Figures 2 and 4) to a 3.27-fold increase in the steady-state levels of TUB2 (spot 4; Figures 2 and 3). Notably, the expression of GFAP (spots 1 and 2) was greater in COD victims as shown in Figures 2 and 3.
Figure 3.

Differentially expressed proteins between COD and control groups. Quantitative assessments of protein spots were made using DeCyder-based quantitation software by comparing Cy2-normalized signal intensities for COD and control subjects. Each panel depicts the age-matched COD/control pairs (filled circles) and mean standardized log abundance of the groups (red-filled star). Three-dimensional images of the identified protein spots from representative COD and control subjects are provided and the standardized log abundance value for the respective outlined peaks are identified as the blue circles and lines in the plot. All proteins in the figure are significantly different between the two groups (P < 0.05).
Figure 4.
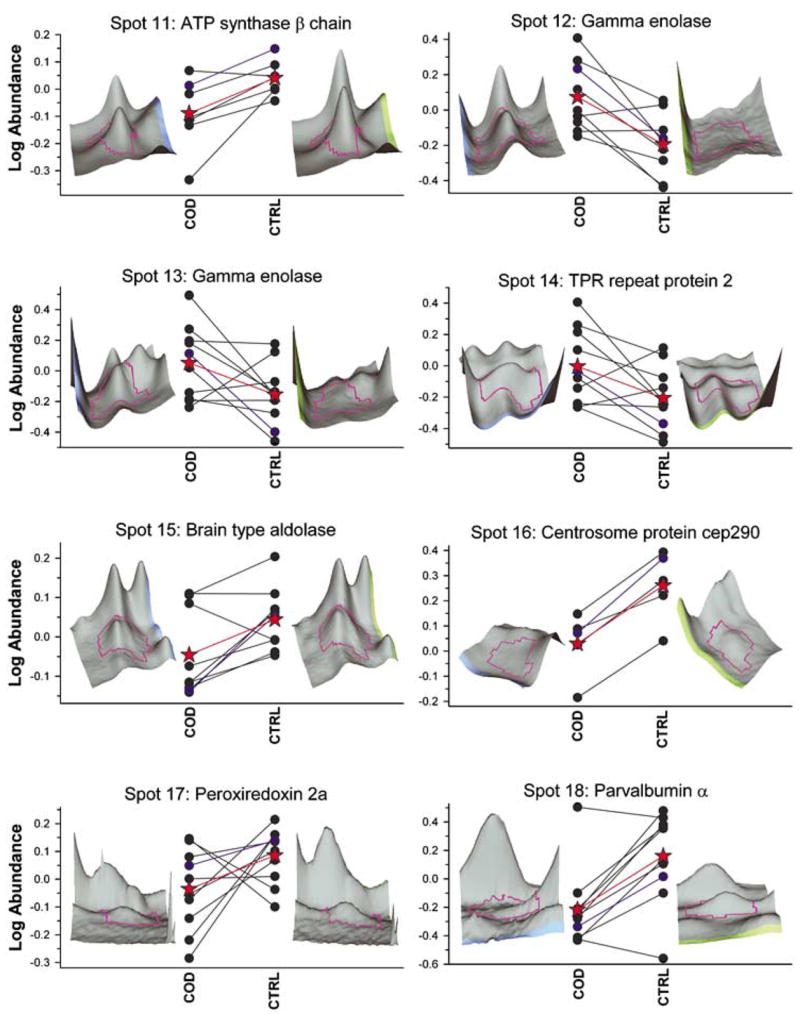
Differentially expressed proteins between COD and control groups. Quantitative assessments of protein spots were made using DeCyder-based quantitation software by comparing Cy2-normalized signal intensities for COD and control subjects. Each panel depicts the age-matched COD/control pairs (filled circles) and mean standardized log abundance of the groups (red-filled star). Three-dimensional images of the identified protein spots from representative COD and control subjects are provided and the standardized log abundance value for the respective peaks are identified as the blue circles and lines in the plot. All proteins in the figure are significantly different between the two groups (P < 0.05).
Methodological considerations
Many of the proteins identified were confirmed by sequencing the peptide mass spectra obtained by MALDI-ToF/ToF. The identification of GFAP by PMF of MALDI-ToF-MS shown in Figure 5a is representative of protein identification in this study. The GFAP identification was validated by sequencing two peptides, ALAAELNQLR94–103 and LADVYQAELR,110–119 having precursor ion m/z of 1098.6 and 1177.6, respectively (Figure 5b and c). Some of the protein spots that yielded significant DeCyder ratios were not identified with MALDI-ToF-MS, which can be attributed to insufficient amounts of protein.
Figure 5.
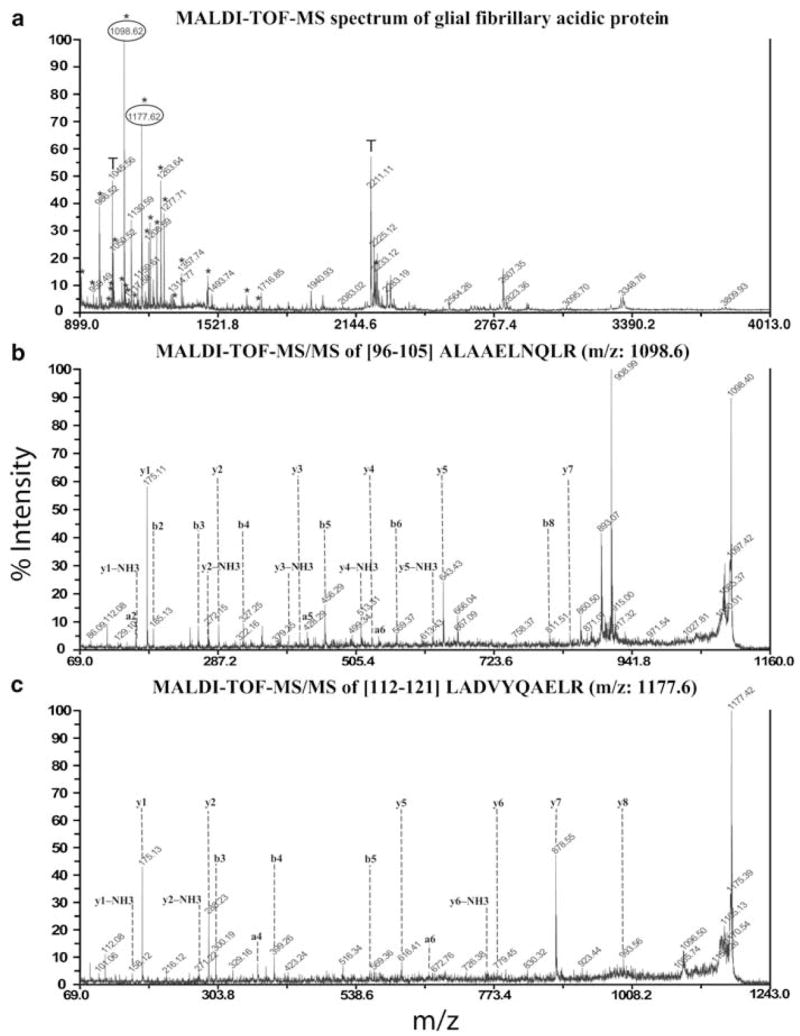
Representative MALDI-ToF/ToF-based mass spectrometry identification of proteins; GFAP. Peptide mass fingerprint of GFAP with peptides marked with ‘*’ matched by MASCOT search against the NCBInr primate database. The x- and y-axes indicate the mass to charge (m/z) ratio and the % abundance of the tryptic peptide fragments, respectively (a). MALDI-ToF-MS/MS analysis of peptide fragment from GFAP with m/z of 1098.6 was sequenced as ALAAELNQLR. The corresponding y- and b-series ions as well as the immonium ions are shown (b). A similar MALDI-ToF-MS/MS analysis of peptide fragment with m/z 1177.6 was sequenced as LADVYQAELR (c).
Significant differences (P < 0.05; Student’s t-test) were found in the relative abundance of proteins from all the COD and control subjects for the protein spots (Figures 3 and 4), which correlate with the identified spot numbers (Figure 2 and Table 3). The intra- and inter-group variability of expression for all the protein spots and corresponding three-dimensional images are depicted in Figures 3 and 4. A number of proteins extracted from 2D gels were constitutively expressed in the control and COD groups and were identified by MALDI-ToF-MS and MALDI-ToF-MS/MS mass spectrometry (Table 4 and Figure 6). These belonged to the following groups: inter- and intracellular signaling, cell morphology, protein folding and stability, cell proliferation and apoptosis, and putative regulators of transcriptional and post-transcriptional modes of muscle-specific gene expression, fully realizing that such a classification is somewhat arbitrary as a number of proteins could be assigned to more than one functional category. It should be noted that although some of the differentially expressed proteins seen here are already known to be either directly or indirectly involved in COD, a number of gene products (e.g. liprin-α3) with unprecedented involvement in COD were also identified in the current study.
Table 3.
Differentially expressed proteins from human NAc of control and COD, identified by MALDI-ToF/ToF
| Spot no. | Protein ID (PMF) | Accession no. | Mr (kDa) | pI | Peptides | MASCOT score | Confidence interval (%) | Protein quantitation
|
|
|---|---|---|---|---|---|---|---|---|---|
| t-Test | Average ratio | ||||||||
| Structural | |||||||||
| 838 | Glial fibrillary acidic protein | gi|4503979 | 49.84 | 5.42 | 30 | 262 | 100 | 0.055 | 1.60 |
| 641 | Glial fibrillary acidic protein | gi|4503979 | 49.84 | 5.42 | 18 | 55 | 95.47 | 0.084 | 1.41 |
| 339 | Tubulin, beta, 2 | gi|20809886 | 49.92 | 4.78 | 16 | 113 | 100 | 0.0039 | 2.72 |
| 388 | Tubulin, beta, 2 | gi|20809886 | 49.92 | 4.78 | 14 | 74 | 99.9 | 0.004 | 3.27 |
| 1154 | Desmoplakin (DP) (250/210 kDa paraneoplastic pemphigus antigen) | gi|12644130 | 33.16 | 6.44 | 59 | 62 | 99.9 | 0.012 | 1.34 |
| 376 | 60 kDa chaperonin | gi|41399285 | 61.01 | 5.7 | 20 | 57 | 99.8 | 0.022 | 1.41 |
| Synaptic plasticity | |||||||||
| 150 | Sodium channel associated protein 1 | gi|24308518 | 80.27 | 5.98 | 23 | 61 | 99.7 | 0.079 | −1.45 |
| 386 | Liprin-α3 | gi|32189362 | 133.41 | 5.53 | 30 | 55 | 99.7 | 0.0072 | 2.56 |
| Mitochondrial | |||||||||
| 640 | Mitochondrial carnitine/acylcarnitine carrier protein (CAC) | gi|3914023 | 32.92 | 9.48 | 11 | 51 | 86 | 0.079 | −1.47 |
| 517 | ATP synthase β-chain, mitochondrial precursor | gi|114549 | 56.52 | 5.26 | 18 | 78 | 99.97 | 0.036 | −1.31 |
| Metabolism | |||||||||
| 688 | Fructose-bisphosphate aldolase C(brain-type aldolase) | gi|113613 | 39.43 | 6.41 | 16 | 74 | 99.94 | 0.067 | −1.21 |
| 632 | Gamma enolase (neural enolase) (NSE) | gi|20981682 | 47.24 | 4.91 | 17 | 146 | 100 | 0.0075 | 1.9 |
| 635 | Gamma enolase (neural enolase) (NSE) | gi|20981682 | 47.24 | 4.91 | 18 | 87 | 99.9 | 0.052 | 1.69 |
| 1210 | Peroxiredoxin 2, isoform a | gi|24659879 | 21.88 | 5.66 | 13 | 201 | 100 | 0.045 | −1.29 |
| Miscellaneous | |||||||||
| 638 | DnaJ homolog subfamily C member 7(tetratricopeptide repeat protein 2) | gi|46397879 | 56.4 | 6.56 | 16 | 51 | 86.3 | 0.057 | −1.66 |
| 798 | Centrosome protein cep290 | gi|51890223 | 290.01 | 5.76 | 57 | 82 | 99.9 | 0.026 | −1.72 |
| 334 | Hypothetical protein LOC80129 | gi|38511966 | 82.27 | 6.22 | 24 | 57 | 99.8 | 0.041 | 1.22 |
| 1384 | Parvalbumin alpha | gi|131100 | 12.05 | 4.98 | 9 | 51 | 86.3 | 0.011 | −2.21 |
Abbreviations: COD, cocaine overdose; MALDI-ToF/ToF, matrix-assisted laser desorption ionization-time of flight-time of flight; NAc, nucleus accumbens.
Table 4.
Proteins with constitutive expression, from human NAc of control and COD identified by MALDI-ToF/ToF
| Spot no. | Protein ID (PMF) | Accession no. | Mr (kDa) | pI | Peptides | MASCOT score | Confidence interval (%) | Protein quantitation
|
|
|---|---|---|---|---|---|---|---|---|---|
| t-Test | Average ratio | ||||||||
| Structural | |||||||||
| 665 | Actin, beta | gi|14250401 | 40.98 | 5.5 | 21 | 243 | 100 | 0.6 | 1.14 |
| 863 | Vimentin | gi|44890587 | 53.61 | 5.06 | 21 | 70 | 99.85 | 0.89 | 1.26 |
| 341 | Vimentin | gi|138535 | 53.7 | 5.06 | 19 | 57 | 88.6 | 0.92 | 1.03 |
| 843 | Tropomyosin 2 (beta), isoform 2 | gi|15079982 | 32.97 | 4.63 | 15 | 57 | 96.8 | 0.13 | −1.22 |
| Synaptic plasticity/signal transduction | |||||||||
| 1128 | 14-3-3 gamma protein | gi|5726310 | 28.36 | 4.7 | 11 | 86 | 99.99 | 0.75 | 1.8 |
| 1129 | 14-3-3 gamma protein | gi|5726310 | 28.36 | 4.7 | 13 | 92 | 99.99 | 0.88 | 1.25 |
| 1315 | Superoxide dismutase 1, soluble | gi|4507149 | 15.93 | 5.7 | 3 | 50 | 99.9 | 0.42 | −1.16 |
| 815 | DDAH1 protein | gi|34783629 | 27.11 | 5.23 | 14 | 63 | 99.2 | 0.27 | −1.21 |
| 856 | Dystonin isoform 1 | gi|34577047 | 629.39 | 5.52 | 84 | 67 | 99.9 | 0.58 | −1.15 |
| 914 | Centrosome protein 4 | gi|50083279 | 133.4 | 5.87 | 31 | 68 | 98.9 | 0.3 | 1.1 |
| 1037 | Centrosome protein cep290 | gi|51890223 | 290.15 | 5.76 | 57 | 77 | 99.8 | 0.9 | 1.15 |
| 1102 | Rho-associated protein kinase 2 | gi|47605990 | 160.48 | 5.73 | 33 | 58 | 90.9 | 0.48 | 1.21 |
| Mitochondrial | |||||||||
| 1133 | ATP synthase, delta subunit, precursor | gi|17390171 | 174.79 | 5.38 | 3 | 38 | 99.9 | 0.53 | −1.13 |
| 1225 | ATP synthase D chain, mitochondrial | gi|6831494 | 184.79 | 5.21 | 12 | 66 | 99.6 | 0.58 | 1.0 |
| 1199 | Ubiquinol-cytochrome c reductase iron–sulfur subunit, mitochondrial precursor | gi|1351361 | 29.63 | 8.55 | 13 | 178 | 100 | 0.6 | −1.12 |
| 1301 | Ubiquinol-cytochrome c reductase iron–sulfur subunit, mitochondrial precursor | gi|54036561 | 29.74 | 8.7 | 8 | 100 | 100 | 0.33 | −1.16 |
| 1137 | Ubiquitin carboxyl-terminal esterase L1 | gi|21361091 | 24.73 | 5.3 | 12 | 120 | 100 | 0.89 | −1.04 |
| 768 | Isocitrate dehydrogenase (NAD) subunit alpha, mitochondrial precursor | gi|1708399 | 39.56 | 6.47 | 6 | 46 | 99.9 | 0.86 | 1.08 |
| 998 | FLJ32452 protein | gi|28704062 | 27.24 | 9.81 | 12 | 55 | 94 | 0.79 | −1.06 |
| 1068 | Creatine kinase, sarcomeric mitochondrial precursor (S-MtCK) | gi|125312 | 47.49 | 8.46 | 16 | 51 | 88.4 | 0.78 | 1.1 |
| 521 | Vacuolar protein sorting 41, isoform 1 | gi|28278745 | 98.5 | 5.56 | 23 | 45 | 97.3 | 0.16 | 1.55 |
| Metabolism | |||||||||
| 685 | Fructose-bisphosphate aldolase C | gi|4885063 | 39.43 | 6.41 | 19 | 94 | 100 | 0.48 | −1.17 |
| 1069 | Peroxiredoxin 6 | gi|23274223 | 25.02 | 6 | 15 | 195 | 100 | 0.87 | 1.02 |
| 490 | Alpha enolase (non-neural enolase) | gi|119339 | 47.14 | 7.01 | 15 | 58 | 99.8 | 0.92 | 1.03 |
| Miscellaneous | |||||||||
| 1079 | Golgi apparatus protein 1 precursor | gi|17376711 | 134.5 | 6.53 | 30 | 64 | 99.4 | 0.82 | −1.1 |
| 883 | Golgi apparatus protein 1 precursor | gi|17376711 | 134.5 | 6.53 | 34 | 63 | 99.23 | 1.0 | 1.05 |
| 870 | Transformation/transcription domain-associated protein | gi|38605529 | 43.73 | 9.49 | 52 | 44 | 97 | 0.09 | 1.12 |
| 95 | Golgi apparatus protein 1 precursor | gi|17376711 | 134.5 | 6.53 | 35 | 72 | 99.6 | 0.16 | 1.61 |
| 306 | RAD50 homolog isoform 1 | gi|19924129 | 153.79 | 6.48 | 34 | 53 | 99.6 | 0.15 | 1.39 |
| 212 | PMFBP1 protein | gi|20306381 | 118.95 | 5.94 | 29 | 61 | 98.86 | 0.12 | 1.22 |
| 1056 | Calbindin (Calbindin D28) | gi|115394 | 30 | 4.7 | 7 | 41 | 93.3 | 0.71 | 1.07 |
| 160 | Heat-shock cognate 71 kDa protein | gi|123648 | 70.85 | 5.37 | 22 | 72 | 99.9 | 0.79 | −1.03 |
| 185 | Serotransferrin precursor (transferrin) | gi|136191 | 76.99 | 6.81 | 15 | 40 | 91.6 | 0.41 | 1.08 |
| 186 | Stress-induced phosphoprotein 1 (STI 1) | gi|400042 | 62.6 | 6.4 | 21 | 56 | 96.1 | 0.83 | −1.04 |
| 507 | DEAD-box protein abstract | gi|21071032 | 69.79 | 6.4 | 19 | 50 | 99.1 | 0.88 | 1.02 |
Abbreviations: COD, cocaine overdose; MALDI-ToF/ToF, matrix-assisted laser desorption ionization-time of flight-time of flight; NAc, nucleus accumbens.
Figure 6.
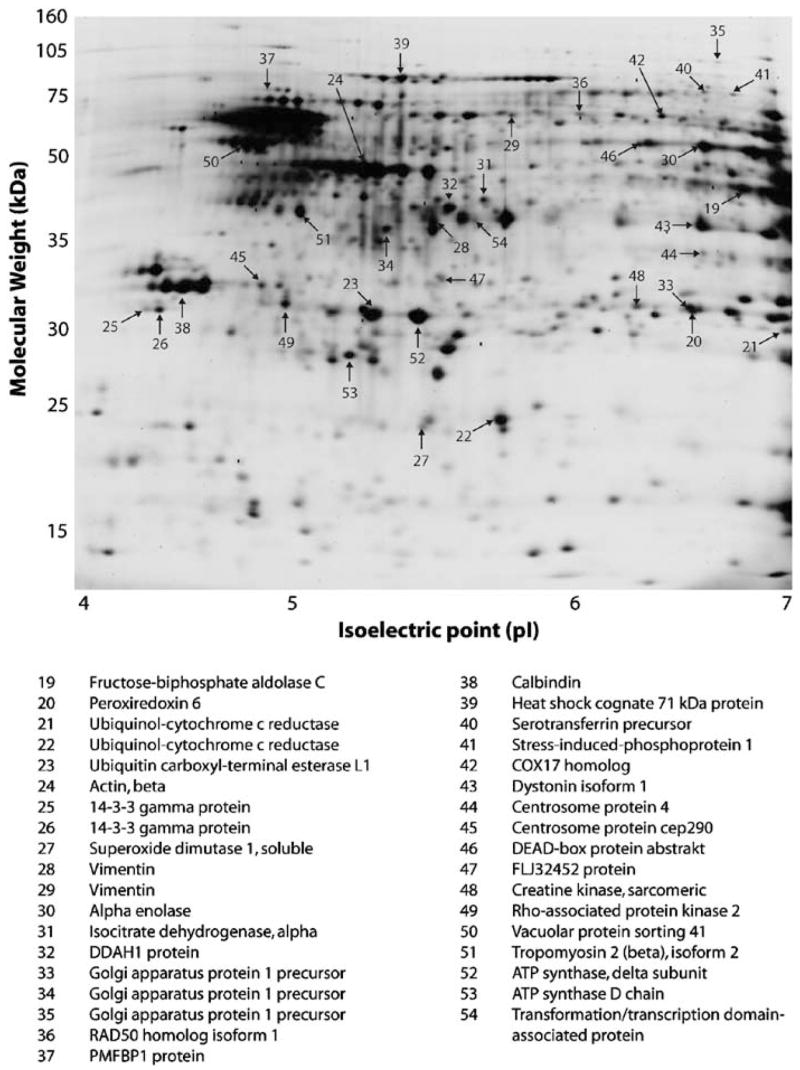
2D-PAGE depicting constitutively expressed proteins in control and COD groups. A representative 2D gel image of cytosolic proteins from human NAc control group. Trypsin-digested proteins were separated in the first dimension by a 4–7 linear pH gradient (isoelectric point, pI) and by an 8–15% gradient SDS-PAGE gel in the second dimension (molecular weight, kDa). Constitutively expressed proteins were identified by MASCOT searches of MALDI-ToF/ToF mass spectra against the NCBInr primate database. Identified proteins are indicated by arrows on the gel and annotated in the list below the image.
2D-DIGE is a technical advance over standard two dimensional gel electrophoresis (2DGE) methods in which the lysine groups on proteins are directly labeled with Cy dyes before IEF, thus allowing 2–3 samples with different dyes to be electrophoresed on the same gel.117 The major advantage of the approach is the ability to compare experimental and control samples on the same gel, thus reducing variability in spot recognition and variability between gels as well as reducing the number of gels that are required. The accuracy of quantitation as well as the statistical confidence obtained for the differentially regulated proteins is significantly higher using the experimental design of 2D-DIGE.47,63,117,118 Moreover, 2D-DIGE offers the most reliable quantitation of any two-dimensional gel electrophoresis (2DGE) method, is comparable in sensitivity to the silver staining method, yet is compatible with the downstream mass spectrometry protein characterization (as majority of the lysine residues remain untagged and accessible for tryptic digestion). An important caveat of the labeling method is that proteins with a high percentage of lysine residues are likely labeled more efficiently compared with the proteins with few/no lysine residues. Therefore, the possibility remains that a protein spot identified as highly abundant using conventional 2DGE with Coomassie or silver staining could be of medium or even low abundance as revealed by 2D-DIGE due to low lysine content.
The selection of specific pH range used in the present study for separation of proteins in the first dimension was determined empirically and was based on the pH range that provided optimal resolution of proteins present in the complex mixture in question. Previous studies have utilized broad-range pH strips46,49,50 as well as more narrow- range pH strips51,55,56,72 for a range of complex protein samples. For complex protein mixtures, it has been noted that the majority of the protein spots resolved using 3–10 pH strip usually fall between 4 and 7 pH.72,117 In the present study, IEF for a pH range of 4–7 resulted in an average of 1407 protein spots that could be clearly differentiated and thus subjected to statistical analysis. A preliminary study of the same samples indicated detection of an average of 840 protein spots resolved in the 3–10 pH strip.120 These findings suggest that the use of narrower pH range (pH 4–7) resulted in better resolution of spots and a detection of a greater number of spots than obtained with an IEF range of pH 3–10. Another advantage of using narrower pH ranges for IEF is that broader pH ranges (e.g. 3–10) result in co-migration of proteins as noted by the identification of more than one protein per protein spot by mass spectrometry analysis, thus precluding quantification of the identified proteins. An important caveat of the narrower pH range for IEF is the exclusion of proteins with isolelectric points greater than or less than the range (e.g. G protein-coupled receptors). To address such issues, we are employing multidimensional liquid chromatographic techniques to analyze such proteins to better resolve acidic/basic and hydrophobic proteins.
Discussion
The expression of 15 polypeptides was consistently altered in the NAc of COD subjects, which included proteins for several families such as structural, synaptic plasticity/signal transduction, mitochondrial and metabolic. Cytosolic fractions of NAc from control and COD human victims were compared by a non-candidate, large-scale method of proteomics that involved resolution of proteins by 2D-DIGE, DeCyder image analysis followed by identification of target proteins by tandem mass spectrometry. DeCyder image analysis of the most abundant 1407 cytosolic proteins revealed that a vast majority of these most likely represented gene products relegated to structural and/or housekeeping functions and apparently did not undergo major regulation. The 2D-DIGE is not compatible with the assessment of post-translational modifications such as phosphorylation and glycosylation. Phosphorylation studies using non-human primate models have been initiated, as the postmortem interval precludes assessment of phosphorylation status in human tissue (unpublished data).
A protein associated with synaptic plasticity was identified as differentially regulated between COD and control subjects (liprin-α3, +2.56), adding further information to the documented cocaine-induced molecular adaptations in the NAc.40,76–79 Liprin-α3 (protein tyrosine phosphatase receptor type f polypeptide-interacting protein: PTPRF-interacting protein alpha 3) belongs to the Liprin family. Glutamate receptor interacting protein I binds via PDZ6 to the carboxyl-terminus of liprin-α protein, an interaction important in surface expression and synaptic targeting of AMPA type glutamate receptor mediated by the movement along the microtubular track.80 KIF1A kinesin motor is associated with liprin-α and liprin-α-interacting Rab3A-interacting molecules, assisting in kinesin-mediated neuronal transport.81 The functional significance of liprin-α at the mammalian synapses is largely unknown. Liprin-α binds to receptor protein tyrosine phosphatase (Dlar), which suggests that liprin-α3 and Dlar are involved in the formation of presynaptic active zones.82 MALS–CASK–Mint 1 complex occurs pre- and postsynaptically and has a distinct role in both the locations.83,84 Postsynaptically MALS is known to bind to NMDA receptors and also involved in the transport of NMDA receptor vesicle along microtubules.85,86 MALS, an essential component of neurotransmitter release, exists as a component of a large presynaptic complex in which liprin-α is also a part. The synaptic AMPA and NMDA receptors have complex roles in the NAc in cocaine relapse. There occurs attenuation of reinstatement response after intra-NAc administration of AMPA/kainite receptor agonists.87,88 Increased protein levels of GluR1 and GluR2/3 and the NMDA receptor subunit NR1 have been documented in rats after withdrawal from chronic cocaine administration.78,89 Significant elevations in NR1, GluR1, GluR2/3 and KA2 mRNA and protein levels have been documented in the VTA of COD victims.43 Recently, we reported increased protein levels of NR1, GluR2/3, GluR1 and GluR5 in the NAc of rhesus monkeys self-administering cocaine; however, humans with COD showed a significant increase of only NR1 and GluR2/3 in NAc.44 The increased expression of liprin-α in human COD victims probably plays an important role in mediating the AMPA and NMDA receptor movement along the microtubular track to the synaptic membrane.
In the present study, the two metabolic proteins identified as differentially regulated in the NAc of COD subjects were NSE (+1.9, +1.69) and PRDX2 (−1.29). Glucose is the major source of nutrition for the brain and its metabolism via the glycolytic pathway generates ATP, a critical source of energy for cellular and molecular functions, as well as acetyl-CoA for the formation of acetylcholine and cholesterol, the main sterol in the brain. Previous studies have demonstrated altered metabolism as a function of cocaine administration in rats,90 monkeys91,92 and humans;6,19 however, few studies have attempted to understand the metabolic processes underlying altered regional glucose utilization. NSE is involved in the third step of glycolysis and catalyzes the conversion of 2-phosphoglycerate to phosphoenolpyruvate and is known to be brain specific. NSE, the gamma isoform of enolase, can form either heterodimers with the alpha isoform or homodimers, and is specific for neuronal cell bodies and axons. Altered NSE abundance appears to be isoform specific, as the alpha isoform, which is also located in neurons, is not significantly changed in COD subjects. Interestingly, glucose metabolism was altered in the NAc of rhesus monkeys following acute cocaine administration,91 as well as acute and chronic cocaine self-administration.92 The differential regulation of this glycolytic enzyme likely reflects a shift in metabolism, whereas NAc neurons are under cocaine-induced stress and may indicate a disturbance in glucose metabolism in this region. Future studies are needed to determine activity-related changes (i.e. post-translational modifications) in these enzymes that would render them functionally consequential.
PRDX2 is a member of the peroxiredoxin family of antioxidants and is involved in redox regulation of the cell by reducing peroxides with reducing equivalents provided through the thioredoxin system. Like PRDX1, PRDX2 is a highly abundant cytosolic protein and is a primary regulator of H2O2 generated by cell surface receptors.93 PRDX2 is expressed in neurons but not in glial cells94 and appears to be located primarily in cells vulnerable to oxidative stress and ischemic injury, such as the hippocampus and cerebellum.94 PRDX2 provides an important function by protecting protein and lipids against oxidative injury95,96 and regulates apoptosis97 by eliminating peroxides generated during metabolism. Previous research has shown that cocaine administration increased lipid peroxidation,98 altered antioxidant enzyme activity and elevated reactive oxygen species in dopaminergic projection areas99,100 all of which suggests the likelihood of H2O2 accumulation and oxidative stress. Interestingly, the changes in PRDX2 may be subtype specific, as PRDX6, another cytosolic peroxiredoxin, was not significantly changed in the COD subjects.
Proteomic analysis also revealed a significant decrease in ATPB (−1.31), involved in mitochondrial function, in COD victims. ATPB is the catalytic subunit of the CF(1) component of F(O) type ATPases located on the inner membrane of mitochondria. The ATP synthase complex utilizes ADP in the presence of a proton gradient across the membrane to produce ATP. These data are commensurate with research showing decreased mitochondrial gene expression in rats administered cocaine36,101 and further suggest decreased energy metabolism in the NAc as a function of cocaine administration.
Four proteins involved in cellular structure were found to be increased to varying degrees in COD subjects: TUB2 (+2.72, +3.27), desmoplakin (+1.34) and chaperonin (+1.41) and GFAP (+1.60, +1.41). Increased TUB2 protein expression in the NAc of human COD victims is an original documentation of the current study. The highly acidic carboxy-terminal region binds cations such as calcium, which is particularly interesting in the light of previous findings showing elevated NR1 and GluR2 protein levels in the NAc of COD victims,44 which mediate increased calcium flux in this region. Interestingly, calcium currents are decreased in the NAc following cocaine withdrawal. A decrease in D1 receptor stimulation and activation of cAMP signaling suppresses calcium currents after cocaine withdrawal in NAc neurons. The reduction of calcium currents in NAc following chronic cocaine administration possibly affects Ca2+-dependent processes such as synaptic plasticity, transmitter releases as well as intracellular signaling cascades and thereby reducing information processing during cocaine withdrawal.101 Based on the findings of the current study, we hypothesize that the reduction in calcium currents in the NAc may mediate increased TUB2 levels by altered interaction with its acidic carboxy-terminus. Tubulin, a dimer of α- and β-chains is a major constituent of microtubules. It binds 2 mol of GTP, one at an exchangeable site on the β-chain and one at a non-exchangeable site on the α-chain. In addition to transport of biosynthetic products and organelles, the microtubule-dependent transport is important for signal transduction.103,104 In disease, the aggregates and jams cause transport dysfunction by decreased levels of anterograde cargoes vital for axonal and synaptic function.105
Detected isoforms of GFAP in COD victims were increased approximately 40 and 60% above controls levels – each with trends though not statistically significant at the 0.05 level. The functional relevance and specificity of elevated GFAP isoforms in the NAc of COD remains equivocal, as similar increases have been observed in post-mortem brain tissue from other diseases including frontal cortical regions of victims of suicide106 and Alzheimer’s disease,107,108 as well as in biopsy samples from temporal lobe epilepsy.109 Previously, several GFAP isoforms were shown to be decreased in the frontal cortex of individuals diagnosed with schizophrenia, bipolar disorder and depression.51 Comparisons of previous studies with the current results are difficult owing to differences in the brain regions and the mass spectrometry procedures (e.g. ES-MS or MALDI-ToF vs MALDI-ToF/ToF). The design and techniques of the current study do not enable assessment of post-translational modifications of proteins; however, assessments of such modifications are warranted. Interestingly, Albertson et al.42 demonstrated a clear decrease in the mRNA levels of oligodendrocytic proteins (another type of neuroglia) including MBP, PLP and MOBP with similar decreased protein levels of MBP in the NAc of cocaine abusers. Astrocytes play an important role in synaptic plasticity through interactions with adjacent neurons and GFAP plays an important role in stabilizing the astrocytic processes.110,111
In addition to the aforementioned proteins, two other proteins of interest were found to be decreased in the NAc of COD subjects: parvalbumin (−2.21) and DnaJ homolog subfamily C member 7 (tetratrico-peptide repeat protein 2) (−1.66). Parvalbumin is a calcium binding protein that regulates transport and buffering of intracellular calcium112 and within the NAc is localized in GABAergic interneurons – cells that regulate input and output of these structures including medium spiny neurons even though there are few parvalbumin neurons.113 In the NAc, these cells are unevenly distributed, with greater density in the lateral portions of the core and shell of NAc.115 A previous study in rats demonstrated that sensitization to the locomotor effects of cocaine is accompanied by increased parvalbumin reactivity in the striatum and with decreased number of parvalbumin immuno-reactive neurons in the NAc shell and dorsolateral striatum following 14 days of withdrawal from cocaine115 decreased 40% in striatum following methamphetamine administration in mice.116
Summary
The study identified several proteins that were differentially expressed between COD and controls subjects in the NAc, some of which have been reported previously and others that are reported for the first time. The analysis of the NAc proteome is far from comprehensive; however, better protein fractionation schemes combined with sensitive isobaric tags for relative and absolute quantification (iTRAQ) mass spectrometry methods are being developed to further explore the NAc proteome in cocaine addicts with particular attention to changes in membrane and nuclear protein fractions. Understanding the multitude of protein systems and pathways altered by cocaine and other abused drugs is imperative for the development of a comprehensive understanding of the neuropathophysiology associated with cocaine abuse.
Acknowledgments
This research was supported by National Institutes of Health Grant R01DA013772.
References
- 1.DSM-IV. Diagnostic and Statistical Manual of Mental Disorders. American Psychiatric Association; Washington, DC: 1994. [Google Scholar]
- 2.Wise RA, Bozarth MA. A psychomotor stimulant theory of addiction. Psychol Rev. 1987;94:469–492. [PubMed] [Google Scholar]
- 3.Wise RA. Drug-activation of brain reward pathways. Drug Alcohol Depend. 1998;51:13–22. doi: 10.1016/s0376-8716(98)00063-5. [DOI] [PubMed] [Google Scholar]
- 4.Koob GF, Sanna PP, Bloom FE. Neuroscience of addiction. Neuron. 1998;21:467–476. doi: 10.1016/s0896-6273(00)80557-7. [DOI] [PubMed] [Google Scholar]
- 5.Koob GF, Nestler EJ. The neurobiology of drug addiction. J Neuropsychiatry Clin Neurosci. 1997;9:482–497. doi: 10.1176/jnp.9.3.482. [DOI] [PubMed] [Google Scholar]
- 6.Breiter HC, Gollub RL, Weisskoff RM, Kennedy DN, Makris N, Berke JD, et al. Acute effects of cocaine on human brain activity and emotion. Neuron. 1997;19:591–611. doi: 10.1016/s0896-6273(00)80374-8. [DOI] [PubMed] [Google Scholar]
- 7.Kilts CD, Schweitzer JB, Quinn CK, Gross RE, Faber TL, Muhammad F, et al. Neural activity related to drug craving in cocaine addiction. Arch Gen Psychiatry. 2001;58:334–341. doi: 10.1001/archpsyc.58.4.334. [DOI] [PubMed] [Google Scholar]
- 8.Kilts CD, Gross RE, Ely TD, Drexler KP. The neural correlates of cue-induced craving in cocaine-dependent women. Am J Psychiatry. 2004;161:233–241. doi: 10.1176/appi.ajp.161.2.233. [DOI] [PubMed] [Google Scholar]
- 9.Hemby SE, Johnson BA, Dworkin SI. Neurobiological basis of drug reinforcement. In: Johnson BA, Roache JD, editors. Drug Addiction and Its Treatment: Nexus of Neuroscience and Behavior. Lippincott-Raven Publishers; Philadelphia: 1997. pp. 137–169. [Google Scholar]
- 10.Hemby SE, Co C, Dworkin SI, Smith JE. Synergistic elevations in nucleus accumbens extracellular dopamine concentrations during self-administration of cocaine/heroin combinations (Speed-ball) in rats. J Pharmacol Exp Ther. 1999;288:274–280. [PubMed] [Google Scholar]
- 11.Hemby SE, Co C, Koves TR, Smith JE, Dworkin SI. Differences in extracellular dopamine concentrations in the nucleus accumbens during response-dependent and response-independent cocaine administration in the rat. Psychopharmacology (Berl) 1997;133:7–16. doi: 10.1007/s002130050365. [DOI] [PubMed] [Google Scholar]
- 12.Pettit HO, Ettenberg A, Bloom FE, Koob GF. Destruction of dopamine in the nucleus accumbens selectively attenuates cocaine but not heroin self-administration in rats. Psychopharmacology. 1984;84:167–173. doi: 10.1007/BF00427441. [DOI] [PubMed] [Google Scholar]
- 13.Pettit HO, Pan HT, Parsons LH, Justice JB., Jr Extracellular concentrations of cocaine and dopamine are enhanced during chronic cocaine administration. J Neurochem. 1990;55:798–804. doi: 10.1111/j.1471-4159.1990.tb04562.x. [DOI] [PubMed] [Google Scholar]
- 14.Zito KA, Vickers G, Roberts DC. Disruption of cocaine and heroin self-administration following kainic acid lesions of the nucleus accumbens. Pharmacol Biochem Behav. 1985;23:1029–1036. doi: 10.1016/0091-3057(85)90110-8. [DOI] [PubMed] [Google Scholar]
- 15.White FJ, Kalivas PW. Neuroadaptations involved in amphetamine and cocaine addiction. Drug Alcohol Depend. 1998;51:141–153. doi: 10.1016/s0376-8716(98)00072-6. [DOI] [PubMed] [Google Scholar]
- 16.Nestler EJ. Molecular basis of long-term plasticity underlying addiction. Nat Rev Neurosci. 2001;2:119–128. doi: 10.1038/35053570. [DOI] [PubMed] [Google Scholar]
- 17.Koob GF, Le Moal M. Drug addiction, dysregulation of reward, and allostasis. Neuropsychopharmacology. 2001;24:97–129. doi: 10.1016/S0893-133X(00)00195-0. [DOI] [PubMed] [Google Scholar]
- 18.Nestler EJ, Aghajanian GK. Molecular and cellular basis of addiction. Science. 1997;278:58–63. doi: 10.1126/science.278.5335.58. [DOI] [PubMed] [Google Scholar]
- 19.Risinger RC, Salmeron BJ, Ross TJ, Amen SL, Sanfilipo M, Hoffmann RG, et al. Neural correlates of high and craving during cocaine self-administration using BOLD fMRI. NeuroImage. 2005;26:1097–1108. doi: 10.1016/j.neuroimage.2005.03.030. [DOI] [PubMed] [Google Scholar]
- 20.Miserendino MJ, Nestler EJ. Behavioral sensitization to cocaine: modulation by the cyclic AMP system in the nucleus accumbens. Brain Res. 1995;674:299–306. doi: 10.1016/0006-8993(95)00030-t. [DOI] [PubMed] [Google Scholar]
- 21.Self DW, Genova LM, Hope BT, Barnhart WJ, Spencer JJ, Nestler EJ. Involvement of cAMP-dependent protein kinase in the nucleus accumbens in cocaine self-administration and relapse of cocaine-seeking behavior. J Neurosci. 1998;18:1848–1859. doi: 10.1523/JNEUROSCI.18-05-01848.1998. [DOI] [PMC free article] [PubMed] [Google Scholar]
- 22.Pliakas AM, Carlson RR, Neve RL, Konradi C, Nestler EJ, Carlezon WA., Jr Altered responsiveness to cocaine and increased immobility in the forced swim test associated with elevated cAMP response element-binding protein expression in nucleus accumbens. J Neurosci. 2001;21:7397–7403. doi: 10.1523/JNEUROSCI.21-18-07397.2001. [DOI] [PMC free article] [PubMed] [Google Scholar]
- 23.Carlezon WA, Jr, Thome J, Olson VG, Lane-Ladd SB, Brodkin ES, Hiroi N, et al. Regulation of cocaine reward by CREB. Science. 1998;282:2272–2275. doi: 10.1126/science.282.5397.2272. [DOI] [PubMed] [Google Scholar]
- 24.Nestler EJ, Terwilliger RZ, Walker JR, Sevarino KA, Duman RS. Chronic cocaine treatment decreases levels of the G protein subunits Gi alpha and Go alpha in discrete regions of rat brain. J Neurochem. 1990;55:1079–1082. doi: 10.1111/j.1471-4159.1990.tb04602.x. [DOI] [PubMed] [Google Scholar]
- 25.Striplin CD, Kalivas PW. Correlation between behavioral sensitization to cocaine and G protein ADP-ribosylation in the ventral tegmental area. Brain Res. 1992;579:181–186. doi: 10.1016/0006-8993(92)90049-f. [DOI] [PubMed] [Google Scholar]
- 26.Terwilliger RZ, Beitner-Johnson D, Sevarino KA, Crain SM, Nestler EJ. A general role for adaptations in G-proteins and the cyclic AMP system in mediating the chronic actions of morphine and cocaine on neuronal function. Brain Res. 1991;548:100–110. doi: 10.1016/0006-8993(91)91111-d. [DOI] [PubMed] [Google Scholar]
- 27.Hope B, Kosofsky B, Hyman SE, Nestler EJ. Regulation of immediate early gene expression and AP-1 binding in the rat nucleus accumbens by chronic cocaine. Proc Natl Acad Sci USA. 1992;89:5764–5768. doi: 10.1073/pnas.89.13.5764. [DOI] [PMC free article] [PubMed] [Google Scholar]
- 28.Nye HE, Hope BT, Kelz MB, Iadarola M, Nestler EJ. Pharmacological studies of the regulation of chronic FOS-related antigen induction by cocaine in the striatum and nucleus accumbens. J PharmacolExp Ther. 1995;275:1671–1680. [PubMed] [Google Scholar]
- 29.Pich EM, Pagliusi SR, Tessari M, Talabot-Ayer D, Hooft van Huijsduijnen R, Chiamulera C. Common neural substrates for the addictive properties of nicotine and cocaine. Science. 1997;275:83–86. doi: 10.1126/science.275.5296.83. [DOI] [PubMed] [Google Scholar]
- 30.Hiroi N, Brown JR, Haile CN, Ye H, Greenberg ME, Nestler EJ. FosB mutant mice: loss of chronic cocaine induction of Fos-related proteins and heightened sensitivity to cocaine’s psychomotor and rewarding effects. Proc Natl Acad Sci USA. 1997;94:10397–10402. doi: 10.1073/pnas.94.19.10397. [DOI] [PMC free article] [PubMed] [Google Scholar]
- 31.Haile CN, Hiroi N, Nestler EJ, Kosten TA. Differential behavioral responses to cocaine are associated with dynamics of mesolimbic dopamine proteins in Lewis and Fischer 344 rats. Synapse. 2001;41:179–190. doi: 10.1002/syn.1073. [DOI] [PubMed] [Google Scholar]
- 32.McClung CA, Nestler EJ. Regulation of gene expression and cocaine reward by CREB and DeltaFosB. Nat Neurosci. 1208;6:1208–1215. doi: 10.1038/nn1143. [DOI] [PubMed] [Google Scholar]
- 33.Zhang D, Zhang L, Tang Y, Zhang Q, Lou D, Sharp FR, et al. Repeated cocaine administration induces gene expression changes through the dopamine D1 receptors. Neuropsychopharmacology. 2005;30:1443–1454. doi: 10.1038/sj.npp.1300680. [DOI] [PubMed] [Google Scholar]
- 34.Tang W, Wesley M, Freeman WM, Liang B, Hemby SE. Alterations in ionotropic glutamate receptor subunits during binge cocaine self-administration and withdrawal in rats. J Neurochem. 2004;89:1021–1033. doi: 10.1111/j.1471-4159.2004.02392.x. [DOI] [PMC free article] [PubMed] [Google Scholar]
- 35.Yuferov V, Nielsen D, Butelman E, Kreek MJ. Microarray studies of psychostimulant-induced changes in gene expression. Addict Biol. 2005;10:101–118. doi: 10.1080/13556210412331308976. [DOI] [PubMed] [Google Scholar]
- 36.Yuferov V, Kroslak T, Laforge KS, Zhou Y, Ho A, Kreek MJ. Differential gene expression in the rat caudate putamen after ‘binge’ cocaine administration: advantage of triplicate microarray analysis. Synapse. 2003;48:157–169. doi: 10.1002/syn.10198. [DOI] [PubMed] [Google Scholar]
- 37.Backes E, Hemby SE. Discrete cell gene profiling of ventral tegmental dopamine neurons after acute and chronic cocaine self-administration. J Pharmacol Exp Ther. 2003;307:450–459. doi: 10.1124/jpet.103.054965. [DOI] [PMC free article] [PubMed] [Google Scholar]
- 38.Hemby SE, Horman B, Tang W. Differential regulation of ionotropic glutamate receptor subunits following cocaine self-administration. Brain Res. 2005;1064:75–82. doi: 10.1016/j.brainres.2005.09.051. [DOI] [PMC free article] [PubMed] [Google Scholar]
- 39.Ang E, Chen J, Zagouras P, Magna H, Holland J, Schaeffer E, et al. Induction of nuclear factor-kappaB in nucleus accumbens by chronic cocaine administration. J Neurochem. 2001;79:221–224. doi: 10.1046/j.1471-4159.2001.00563.x. [DOI] [PubMed] [Google Scholar]
- 40.Yao WD, Gainetdinov RR, Arbuckle MI, Sotnikova TD, Cyr M, Beaulieu JM, et al. Identification of PSD-95 as a regulator of dopamine-mediated synaptic and behavioral plasticity. Neuron. 2004;41:625–638. doi: 10.1016/s0896-6273(04)00048-0. [DOI] [PubMed] [Google Scholar]
- 41.Bahi A, Dreyer JL. Cocaine-induced expression changes of axon guidance molecules in the adult rat brain. Mol Cell Neurosci. 2005;28:275–291. doi: 10.1016/j.mcn.2004.09.011. [DOI] [PubMed] [Google Scholar]
- 42.Albertson DN, Pruetz B, Schmidt CJ, Kuhn DM, Kapatos G, Bannon MJ. Gene expression profile of the nucleus accumbens of human cocaine abusers: evidence for dysregulation of myelin. J Neurochem. 2004;88:1211–1219. doi: 10.1046/j.1471-4159.2003.02247.x. [DOI] [PMC free article] [PubMed] [Google Scholar]
- 43.Tang W-X, Fasulo WH, Mash DC, Hemby SE. Molecular profiling of midbrain dopamine regions in cocaine overdose victims. J Neurochem. 2003;85:911–924. doi: 10.1046/j.1471-4159.2003.01740.x. [DOI] [PMC free article] [PubMed] [Google Scholar]
- 44.Hemby SE, Tang W, Muly EC, Kuhar MJ, Howell L, Mash DC. Cocaine-induced alterations in nucleus accumbens ionotropic glutamate receptor subunits in human and non-human primates. J Neurochem. 2005;95:1785–1793. doi: 10.1111/j.1471-4159.2005.03517.x. [DOI] [PMC free article] [PubMed] [Google Scholar]
- 45.Lehrmann E, Oyler J, Vawter MP, Hyde TM, Kolachana B, Kleinman JE, et al. Transcriptional profiling in the human prefrontal cortex: evidence for two activational states associated with cocaine abuse. Pharmacogenomics J. 2003;3:27–40. doi: 10.1038/sj.tpj.6500146. [DOI] [PMC free article] [PubMed] [Google Scholar]
- 46.Alexander-Kaufman K, James G, Sheedy D, Harper C, Matsumoto I. Differential protein expression in the prefrontal white matter of human alcoholics: a proteomics study. Mol Psychiatry. 2006;11:56–65. doi: 10.1038/sj.mp.4001741. [DOI] [PubMed] [Google Scholar]
- 47.Freeman WM, Hemby SE. Proteomics for protein expression profiling in neuroscience. Neurochem Res. 2004;29:1065–1081. doi: 10.1023/b:nere.0000023594.21352.17. [DOI] [PMC free article] [PubMed] [Google Scholar]
- 48.Clark D, Dedova I, Cordwell S, Matsumoto I. A proteome analysis of the anterior cingulate cortex gray matter in schizophrenia. Mol Psychiatry. 2006;11:423, 459–470. doi: 10.1038/sj.mp.4001806. [DOI] [PubMed] [Google Scholar]
- 49.Prabakaran S, Swatton JE, Ryan MM, Huffaker SJ, Huang JT, Griffin JL, et al. Mitochondrial dysfunction in schizophrenia: evidence for compromised brain metabolism and oxidative stress. Mol Psychiatry. 2004;9:684–697. 643. doi: 10.1038/sj.mp.4001511. [DOI] [PubMed] [Google Scholar]
- 50.Swatton JE, Prabakaran S, Karp NA, Lilley KS, Bahn S. Protein profiling of human postmortem brain using 2-dimensional fluorescence difference gel electrophoresis (2-D DIGE) Mol Psychiatry. 2004;9:128–143. doi: 10.1038/sj.mp.4001475. [DOI] [PubMed] [Google Scholar]
- 51.Johnston-Wilson NL, Sims CD, Hofmann JP, Anderson L, Shore AD, Torrey EF, et al. Disease-specific alterations in frontal cortex brain proteins in schizophrenia, bipolar disorder, and major depressive disorder. The Stanley Neuropathology Consortium. Mol Psychiatry. 2000;5:142–149. doi: 10.1038/sj.mp.4000696. [DOI] [PubMed] [Google Scholar]
- 52.Gorg A, Obermaier C, Boguth G, Harder A, Scheibe B, Wildgruber R, et al. The current state of two-dimensional electrophoresis with immobilized pH gradients. Electrophoresis. 2000;21:1037–1053. doi: 10.1002/(SICI)1522-2683(20000401)21:6<1037::AID-ELPS1037>3.0.CO;2-V. [DOI] [PubMed] [Google Scholar]
- 53.Tonge R, Shaw J, Middleton B, Rowlinson R, Rayner S, Young J, et al. Validation and development of fluorescence two-dimensional differential gel electrophoresis proteomics technology. Proteomics. 2001;1:377–396. doi: 10.1002/1615-9861(200103)1:3<377::AID-PROT377>3.0.CO;2-6. [DOI] [PubMed] [Google Scholar]
- 54.Unlu M, Morgan ME, Minden JS. Difference gel electrophoresis: a single gel method for detecting changes in protein extracts. Electrophoresis. 1997;18:2071–2077. doi: 10.1002/elps.1150181133. [DOI] [PubMed] [Google Scholar]
- 55.Dhingra V, Li Q, Allison AB, Stallknecht DE, Fu ZF. Proteomic profiling and neurodegeneration in west-nile-virus-infected neurons. J Biomed Biotechnol. 2005;2005:271–279. doi: 10.1155/JBB.2005.271. [DOI] [PMC free article] [PubMed] [Google Scholar]
- 56.Bruggeman V, Van den Bergh G, Clerens S, Dumez L, Onagbesan O, Arckens L, et al. Effect of a single in ovo injection of 2,3,7,8-tetrachlorodibenzo-p-dioxin on protein expression in liver and ovary of the one-day-old chick analyzed by fluorescent two-dimensional difference gel electrophoresis and mass spectrometry. Proteomics. 2006;6:2576–2585. doi: 10.1002/pmic.200500237. [DOI] [PubMed] [Google Scholar]
- 57.Henzel WJ, Billeci TM, Stults JT, Wong SC, Grimley C, Watanabe C. Identifying proteins from two-dimensional gels by molecular mass searching of peptide fragments in protein sequence databases. Proc Natl Acad Sci USA. 1993;90:5011–5015. doi: 10.1073/pnas.90.11.5011. [DOI] [PMC free article] [PubMed] [Google Scholar]
- 58.Mann M, Hojrup P, Roepstorff P. Use of mass spectrometric molecular weight information to identify proteins in sequence databases. Biol Mass Spectrom. 1993;22:338–345. doi: 10.1002/bms.1200220605. [DOI] [PubMed] [Google Scholar]
- 59.Pappin DJ. Peptide mass fingerprinting using MALDI-TOF mass spectrometry. Methods Mol Biol. 2003;211:211–219. doi: 10.1385/1-59259-342-9:211. [DOI] [PubMed] [Google Scholar]
- 60.Stephens BG, Jentzen JM, Karch S, Mash DC, Wetli CV. Criteria for the interpretation of cocaine levels in human biological samples and their relation to the cause of death. Am J Forensic Med Pathol. 2004;25:1–10. doi: 10.1097/01.paf.0000118960.58334.a9. [DOI] [PubMed] [Google Scholar]
- 61.Stephens BG, Jentzen JM, Karch S, Wetli CV, Mash DC. National Association of Medical Examiners position paper on the certification of cocaine-related deaths. Am J Forensic Med Pathol. 2004;25:11–13. doi: 10.1097/01.paf.0000114041.70865.24. [DOI] [PubMed] [Google Scholar]
- 62.Hernandez A, Andollo W, Hearn WL. Analysis of cocaine and metabolites in brain using solid phase extraction and full-scanning gas chromatography/ion trap mass spectrometry. Forensic Sci Int. 1994;65:149–156. doi: 10.1016/0379-0738(94)90270-4. [DOI] [PubMed] [Google Scholar]
- 63.Alban A, David SO, Bjorkesten L, Andersson C, Sloge E, Lewis S, et al. A novel experimental design for comparative two-dimensional gel analysis: two-dimensional difference gel electrophoresis incorporating a pooled internal standard. Proteomics. 2003;3:36–44. doi: 10.1002/pmic.200390006. [DOI] [PubMed] [Google Scholar]
- 64.Berggren KN, Chernokalskaya E, Lopez MF, Beechem JM, Patton WF. Comparison of three different fluorescent visualization strategies for detecting Escherichia coli ATP synthase subunits after sodium dodecyl sulfate-polyacrylamide gel electrophoresis. Proteomics. 2001;1:54–65. doi: 10.1002/1615-9861(200101)1:1<54::AID-PROT54>3.0.CO;2-5. [DOI] [PubMed] [Google Scholar]
- 65.Bjellqvist B, Ek K, Righetti PG, Gianazza E, Gorg A, Westermeier R, et al. Isoelectric focusing in immobilized pH gradients: principle, methodology and some applications. J Biochem Biophys Methods. 1982;6:317–339. doi: 10.1016/0165-022x(82)90013-6. [DOI] [PubMed] [Google Scholar]
- 66.Tannu NS, Wu J, Rao VK, Gadgil HS, Pabst MJ, Gerling IC, et al. Paraffin-wax-coated plates as matrix-assisted laser desorption/ionization sample support for high-throughput identification of proteins by peptide mass fingerprinting. Anal Biochem. 2004;327:222–232. doi: 10.1016/j.ab.2004.01.033. [DOI] [PubMed] [Google Scholar]
- 67.O’Farrell PH. High resolution two-dimensional electrophoresis of proteins. J Biol Chem. 1975;250:4007–4021. [PMC free article] [PubMed] [Google Scholar]
- 68.Weber K, Osborn M. The reliability of molecular weight determinations by dodecyl sulfate-polyacrylamide gel electrophoresis. J Biol Chem. 1969;244:4406–4412. [PubMed] [Google Scholar]
- 69.Tannu NS, Sanchez-Brambila G, Kirby P, Andacht TM. Effect of staining reagent on peptide mass fingerprinting from in-gel trypsin digestions: a comparison of SyproRuby™ and DeepPurple™. Electrophoresis. 2006;27:3136–3143. doi: 10.1002/elps.200500740. [DOI] [PubMed] [Google Scholar]
- 70.Patterson SD, Aebersold R. Mass spectrometric approaches for the identification of gel-separated proteins. Electrophoresis. 1995;16:1791–1814. doi: 10.1002/elps.11501601299. [DOI] [PubMed] [Google Scholar]
- 71.Gharahdaghi F, Weinberg CR, Meagher DA, Imai BS, Mische SM. Mass spectrometric identification of proteins from silver-stained polyacrylamide gel: a method for the removal of silver ions to enhance sensitivity. Electrophoresis. 1999;20:601–605. doi: 10.1002/(SICI)1522-2683(19990301)20:3<601::AID-ELPS601>3.0.CO;2-6. [DOI] [PubMed] [Google Scholar]
- 72.Tannu NS, Rao VK, Chaudhary RM, Giorgianni F, Saeed AE, Gao Y, et al. Comparative proteomes of the proliferating C(2)C(12) myoblasts and fully differentiated myotubes reveal the complexity of the skeletal muscle differentiation program. Mol Cell Proteomics. 2004;3:1065–1082. doi: 10.1074/mcp.M400020-MCP200. [DOI] [PubMed] [Google Scholar]
- 73.Mann M, Wilm M. Error-tolerant identification of peptides in sequence databases by peptide sequence tags. Anal Chem. 1994;66:4390–4399. doi: 10.1021/ac00096a002. [DOI] [PubMed] [Google Scholar]
- 74.Yates III., JR Database searching using mass spectrometry data. Electrophoresis. 1998;19:893–900. doi: 10.1002/elps.1150190604. [DOI] [PubMed] [Google Scholar]
- 75.Pappin DJ, Hojrup P, Bleasby AJ. Rapid identification of proteins by peptide-mass fingerprinting. Curr Biol. 1993;3:327–332. doi: 10.1016/0960-9822(93)90195-t. [DOI] [PubMed] [Google Scholar]
- 76.McClung CA, Nestler EJ. Regulation of gene expression and cocaine reward by CREB and DeltaFosB. Nat Neurosci. 2003;6:1208–1215. doi: 10.1038/nn1143. [DOI] [PubMed] [Google Scholar]
- 77.Sutton MA, Schmidt EF, Choi KH, Schad CA, Whisler K, Simmons D, et al. Extinction-induced upregulation in AMPA receptors reduces cocaine-seeking behaviour. Nature. 2003;421:70–75. doi: 10.1038/nature01249. [DOI] [PubMed] [Google Scholar]
- 78.Lu L, Grimm JW, Shaham Y, Hope BT. Molecular neuroadaptations in the accumbens and ventral tegmental area during the first 90 days of forced abstinence from cocaine self-administration in rats. J Neurochem. 2003;85:1604–1613. doi: 10.1046/j.1471-4159.2003.01824.x. [DOI] [PubMed] [Google Scholar]
- 79.Nestler EJ. Cellular responses to chronic treatment with drugs of abuse. Crit Rev Neurobiol. 1993;7:23–39. [PubMed] [Google Scholar]
- 80.Wyszynski M, Kim E, Dunah AW, Passafaro M, Valtschanoff JG, Serra-Pages C, et al. Interaction between GRIP and liprin-alpha/SYD2 is required for AMPA receptor targeting. Neuron. 2002;34:39–52. doi: 10.1016/s0896-6273(02)00640-2. [DOI] [PubMed] [Google Scholar]
- 81.Shin H, Wyszynski M, Huh KH, Valtschanoff JG, Lee JR, Ko J, et al. Association of the kinesin motor KIF1A with the multimodular protein liprin-alpha. J Biol Chem. 2003;278:11393–11401. doi: 10.1074/jbc.M211874200. [DOI] [PubMed] [Google Scholar]
- 82.Serra-Pages C, Medley QG, Tang M, Hart A, Streuli M. Liprins, a family of LAR transmembrane protein-tyrosine phosphatase-interacting proteins. J Biol Chem. 1998;273:15611–15620. doi: 10.1074/jbc.273.25.15611. [DOI] [PubMed] [Google Scholar]
- 83.Hata Y, Butz S, Sudhof TC. CASK: a novel dlg/PSD95 homolog with an N-terminal calmodulin-dependent protein kinase domain identified by interaction with neurexins. J Neurosci. 1996;16:2488–2494. doi: 10.1523/JNEUROSCI.16-08-02488.1996. [DOI] [PMC free article] [PubMed] [Google Scholar]
- 84.Okamoto M, Sudhof TC. Mints, Munc18-interacting proteins in synaptic vesicle exocytosis. J Biol Chem. 1997;272:31459–31464. doi: 10.1074/jbc.272.50.31459. [DOI] [PubMed] [Google Scholar]
- 85.Jo K, Derin R, Li M, Bredt DS. Characterization of MALS/Velis-1, -2, and -3: a family of mammalian LIN-7 homologs enriched at brain synapses in association with the postsynaptic density-95/NMDA receptor postsynaptic complex. J Neurosci. 1999;19:4189–4199. doi: 10.1523/JNEUROSCI.19-11-04189.1999. [DOI] [PMC free article] [PubMed] [Google Scholar]
- 86.Setou M, Nakagawa T, Seog DH, Hirokawa N. Kinesin superfamily motor protein KIF17 and mLin-10 in NMDA receptor-containing vesicle transport. Science. 2000;288:1796–1802. doi: 10.1126/science.288.5472.1796. [DOI] [PubMed] [Google Scholar]
- 87.Cornish JL, Kalivas PW. Glutamate transmission in the nucleus accumbens mediates relapse in cocaine addiction. J Neurosci. 2000;20:RC89. doi: 10.1523/JNEUROSCI.20-15-j0006.2000. [DOI] [PMC free article] [PubMed] [Google Scholar]
- 88.Park WK, Bari AA, Jey AR, Anderson SM, Spealman RD, Rowlett JK, et al. Cocaine administered into the medial prefrontal cortex reinstates cocaine-seeking behavior by increasing AMPA receptor-mediated glutamate transmission in the nucleus accumbens. J Neurosci. 2002;22:2916–2925. doi: 10.1523/JNEUROSCI.22-07-02916.2002. [DOI] [PMC free article] [PubMed] [Google Scholar]
- 89.Lu W, Monteggia LM, Wolf ME. Repeated administration of amphetamine and cocaine does not alter AMPA receptor subunit expression in the rat midbrain. Neuropsychopharmacology. 2002;26:1–13. doi: 10.1016/S0893-133X(01)00272-X. [DOI] [PubMed] [Google Scholar]
- 90.Porrino LJ. Functional consequences of acute cocaine treatment depend on route of administration. Psychopharmacology (Berl) 1993;112:343–351. doi: 10.1007/BF02244931. [DOI] [PubMed] [Google Scholar]
- 91.Lyons D, Friedman DP, Nader MA, Porrino LJ. Cocaine alters cerebral metabolism within the ventral striatum and limbic cortex of monkeys. J Neurosci. 1996;16:1230–1238. doi: 10.1523/JNEUROSCI.16-03-01230.1996. [DOI] [PMC free article] [PubMed] [Google Scholar]
- 92.Porrino LJ, Lyons D, Smith HR, Daunais JB, Nader MA. Cocaine self-administration produces a progressive involvement of lim-bic, association, and sensorimotor striatal domains. J Neurosci. 2004;24:3554–3562. doi: 10.1523/JNEUROSCI.5578-03.2004. [DOI] [PMC free article] [PubMed] [Google Scholar]
- 93.Rhee SG, Chae HZ, Kim K. Peroxiredoxins: a historical overview and speculative preview of novel mechanisms and emerging concepts in cell signaling. Free Radic Biol Med. 2005;38:1543–1552. doi: 10.1016/j.freeradbiomed.2005.02.026. [DOI] [PubMed] [Google Scholar]
- 94.Sarafian TA, Verity MA, Vinters HV, Shih CC, Shi L, Ji XD, et al. Differential expression of peroxiredoxin subtypes in human brain cell types. J Neurosci Res. 1999;56:206–212. [PubMed] [Google Scholar]
- 95.Yim MB, Chae HZ, Rhee SG, Chock PB, Stadtman ER. On the protective mechanism of the thiol-specific antioxidant enzyme against the oxidative damage of biomacromolecules. J Biol Chem. 1994;269:1621–1626. [PubMed] [Google Scholar]
- 96.Netto LES, Chae HZ, Kang SW, Rhee SG, Stadtman ER. Removal of hydrogen peroxide by thiol-specific antioxidant enzyme (TSA) is involved with its antioxidant properties. TSA possesses thiol peroxidase activity. J Biol Chem. 1996;271:15315–15321. doi: 10.1074/jbc.271.26.15315. [DOI] [PubMed] [Google Scholar]
- 97.Kim H, Lee TH, Park ES, Suh JM, Park SJ, Chung HK, et al. Role of peroxiredoxins in regulating intracellular hydrogen peroxide and hydrogen peroxide-induced apoptosis in thyroid cells. J Biol Chem. 2000;275:18266–18270. doi: 10.1074/jbc.275.24.18266. [DOI] [PubMed] [Google Scholar]
- 98.Kloss MW, Rosen GM, Rauckman EJ. Biotransformation of norcocaine to norcocaine nitroxide by rat brain microsomes. Psychopharmacology (Berl) 1984;84:221–224. doi: 10.1007/BF00427449. [DOI] [PubMed] [Google Scholar]
- 99.Dietrich JB, Mangeol A, Revel MO, Burgun C, Aunis D, Zwiller J. Acute or repeated cocaine administration generates reactive oxygen species and induces antioxidant enzyme activity in dopaminergic rat brain structures. Neuropharmacology. 2005;48:965–974. doi: 10.1016/j.neuropharm.2005.01.018. [DOI] [PubMed] [Google Scholar]
- 100.Macedo DS, de Vasconcelos SM, dos Santos RS, Aguiar LM, Lima VT, Viana GS, et al. Cocaine alters catalase activity in prefrontal cortex and striatum of mice. Neurosci Lett. 2005;387:53–56. doi: 10.1016/j.neulet.2005.07.024. [DOI] [PubMed] [Google Scholar]
- 101.Dietrich JB, Poirier R, Aunis D, Zwiller J. Cocaine downregulates the expression of the mitochondrial genome in rat brain. Ann NY Acad Sci. 2004;1025:345–350. doi: 10.1196/annals.1316.042. [DOI] [PubMed] [Google Scholar]
- 102.Zhang XF, Cooper DC, White FJ. Repeated cocaine treatment decreases whole-cell calcium current in rat nucleus accumbens neurons. J Pharmacol Exp Ther. 2002;301:1119–1125. doi: 10.1124/jpet.301.3.1119. [DOI] [PubMed] [Google Scholar]
- 103.Howe CL, Mobley WC. Signaling endosome hypothesis: a cellular mechanism for long distance communication. J Neurobiol. 2004;58:207–216. doi: 10.1002/neu.10323. [DOI] [PubMed] [Google Scholar]
- 104.Collins MO, Yu L, Coba MP, Husi H, Campuzano I, Blackstock WP, et al. Proteomic analysis of in vivo phosphorylated synaptic proteins. J Biol Chem. 2005;280:5972–5982. doi: 10.1074/jbc.M411220200. [DOI] [PubMed] [Google Scholar]
- 105.Goldstein LS. Do disorders of movement cause movement disorders and dementia? Neuron. 2003;40:415–425. doi: 10.1016/s0896-6273(03)00630-5. [DOI] [PubMed] [Google Scholar]
- 106.Schlicht K, Buttner A, Siedler F, Scheffer B, Zill P, Eisenmenger W, et al. Comparative proteomic analysis with postmortem prefrontal cortex tissues of suicide victims versus controls. J Psychiatr Res. 2006 doi: 10.1016/j.jpsychires.2006.04.006. in press. [DOI] [PubMed] [Google Scholar]
- 107.Korolainen MA, Auriola S, Nyman TA, Alafuzoff I, Pirttila T. Proteomic analysis of glial fibrillary acidic protein in Alzheimer’s disease and aging brain. Neurobiol Dis. 2005;20:858–870. doi: 10.1016/j.nbd.2005.05.021. [DOI] [PubMed] [Google Scholar]
- 108.Tsuji T, Shimohama S. Analysis of the proteomic profiling of brain tissue in Alzheimer’s disease. Dis Markers. 2001;17:247–257. doi: 10.1155/2001/386284. [DOI] [PMC free article] [PubMed] [Google Scholar]
- 109.Yang JW, Czech T, Gelpi E, Lubec G. Extravasation of plasma proteins can confound interpretation of proteomic studies of brain: a lesson from apo A-I in mesial temporal lobe epilepsy. Brain Res Mol Brain Res. 2005;139:348–356. doi: 10.1016/j.molbrainres.2005.06.010. [DOI] [PubMed] [Google Scholar]
- 110.Haydon PG. GLIA: listening and talking to the synapse. Nat Rev Neurosci. 2001;2:185–193. doi: 10.1038/35058528. [DOI] [PubMed] [Google Scholar]
- 111.Weinstein DE, Shelanski ML, Liem RK. Suppression by antisense mRNA demonstrates a requirement for the glial fibrillary acidic protein in the formation of stable astrocytic processes in response to neurons. J Cell Biol. 1991;112:1205–1213. doi: 10.1083/jcb.112.6.1205. [DOI] [PMC free article] [PubMed] [Google Scholar]
- 112.Heizmann CW. Calcium-binding proteins: basic concepts and clinical implications. Gen Physiol Biophys. 1992;11:411–425. [PubMed] [Google Scholar]
- 113.Koos T, Tepper JM. Inhibitory control of neostriatal projection neurons by GABAergic interneurons. Nat Neurosci. 1999;2:467–472. doi: 10.1038/8138. [DOI] [PubMed] [Google Scholar]
- 114.Zahm DS, Grosu S, Irving JC, Williams EA. Discrimination of striatopallidum and extended amygdala in the rat: a role for parvalbumin immunoreactive neurons? Brain Res. 2003;978:141–154. doi: 10.1016/s0006-8993(03)02801-4. [DOI] [PubMed] [Google Scholar]
- 115.Todtenkopf MS, Stellar JR, Williams EA, Zahm DS. Differential distribution of parvalbumin immunoreactive neurons in the striatum of cocaine sensitized rats. Neuroscience. 2004;127:35–42. doi: 10.1016/j.neuroscience.2004.04.054. [DOI] [PubMed] [Google Scholar]
- 116.Zhu JP, Xu W, Angulo JA. Methamphetamine-induced cell death: selective vulnerability in neuronal subpopulations of the striatum in mice. Neuroscience. 2006;140:607–622. doi: 10.1016/j.neuroscience.2006.02.055. [DOI] [PMC free article] [PubMed] [Google Scholar]
- 117.Tannu N, Hemby SE. Methods for proteomics in neuroscience. In: Hemby SE, Bahn S, editors. Progress in Brain Research: Functional Genomics and Proteomics in the Clinical Neurosciences. Elsevier; Amsterdam: in press. [DOI] [PubMed] [Google Scholar]
- 118.Knowles MR, Cervino S, Skynner HA, Hunt SP, de Felipe C, Salim K, et al. Multiplex proteomic analysis by two-dimensional differential in-gel electrophoresis. Proteomics. 2003;3:1162–1171. doi: 10.1002/pmic.200300437. [DOI] [PubMed] [Google Scholar]
- 119.Shaw J, Knowles MR, Cervino S, Skynner HA, Hunt SP, de Felipe C, et al. Evaluation of saturation labelling two-dimensional difference gel electrophoresis fluorescent dyes. Proteomics. 2003;3:1181–1195. doi: 10.1002/pmic.200300439. [DOI] [PubMed] [Google Scholar]
- 120.Hemby SE. Assessment of genome and proteome profiles in cocaine abuse. In: Hemby SE, Bahn S, editors. Progress in Brian Research: Functional Genomics and Proteomics in the Clinical Neurosciences. Elsevier; New York: in press. [DOI] [PMC free article] [PubMed] [Google Scholar]