Abstract
This study was aimed at determining if physiotherapy ultrasound (US) affected the fragile and leaky angiogenic blood vessels in a tumor. In 22 C3HV/HeN mice, a subcutaneous melanoma (K173522) was insonated (1, 2 or 3 min) with continuous 1-MHz low-intensity (spatial-average temporal-average = 2.28 W cm−2), physiotherapy US. Contrast-enhanced (0.1 mL Optison®) power Doppler US observations were made and histogram analyses of the images were performed. Before insonation, all but 7% of the tumor was perfused. The avascular area in tumors receiving 3-min treatment increased to 82% (p < 0.001). A linear regression analysis showed that each min of insonation led to a 25% reduction in tumor vascularity; the antivascular activity persisted for 24 h. Histology demonstrated disruption of vascular walls and tumor cell death in areas of vascular congestion and thrombosis. Physiotherapy US particularly targeted the vascular structures, and the effects on tumor cells appeared to be secondary to the resultant ischemia.
Keywords: Angiogenesis, Antivascular, Cancer therapy, Ultrasound, Physiotherapy, Mouse, Melanoma
INTRODUCTION
For many years, ultrasound (US) has been used for clinical imaging, as well as for its therapeutic actions in physical therapy. Although the US energy in routine B-mode diagnostic US imaging causes minimal biologic effects (Barnett et al. 2000), in physiotherapy, it is widely used to heat periarticular structures and sites at bone-muscle interfaces. The physiotherapy US power levels generally range from 0.2 to 2.6 W cm−2, the frequencies from 1 to 3 MHz, and in vitro temperature rises of 1 to 8 °C have been described (Baker et al. 2001; Demmink et al. 2003; Robertson and Baker 2001). There remains, however, little scientific evidence to support the clinical effectiveness of such forms of US therapy (Baker et al. 2001; Robertson and Baker 2001). In combination with photodynamic therapy, low-intensity US (0.51 W cm−2, 1 MHz, 10-min treatment time) was also used to inhibit the growth of cutaneous squamous cell carcinomas in mice, but the authors concluded that the mechanism of the response remained unclear (Jin et al. 2000).
In contrast to low-intensity US, beams of high-intensity focused US have been used to treat benign (Madersbacher et al. 1997) and malignant (Uchida et al. 2002) prostate cancer, as well as hepatic (Rowland et al. 1997) and esophageal tumors (Melodelima et al. 2003). Concurrent magnetic resonance imaging has also been used to monitor the rise in temperature during insonation of implanted carcinomas in rabbits (Palussiere et al. 2003) and fibroadenomas of the human breast (Hynynen et al. 2001). High-intensity beams cause the tissue temperature to rise above 60°C, to as much as 90 to 95°C, and cause permanent damage to tissues related to a localized instantaneous coagulative necrosis (Clement 2004; Diederich et al. 2004; Uchida et al. 2002). The US intensity generally ranges from 103 to 104 W cm−2 with frequencies of from 0.5 to 10.0 MHz, although 1.5 MHz is most commonly used for a treatment time of 1 to 30 s (Clement 2004). Some workers, however, have used lower intensities (2.6 to 26.7 W cm−2) for treatment of experimental canine prostatic neoplasia (Hazle et al. 2002) and human esophageal cancer (Melodelima et al. 2003). High-intensity beams have also been used in ultrasonographic probes placed laparoscopically to partially ablate a porcine kidney (Paterson et al. 2003).
In this study, we explored the effects of physiotherapy US on tumor vasculature. As a tumor grows, the upregulation of angiogenic factors results in the sprouting of new blood vessels from pre-existing vessels to supply the tumor, but these new vessels fail to mature into a normally functioning vasculature (Carmeliet and Conway 2001; Carmeliet and Jain 2000; Folkman 1971, 2001; Haroon et al. 1999; Jain 2002). The vessels are fragile and leaky; their endothelial cells remain loosely associated, there is continued degradation of the extracellular matrix and the basement membrane is discontinuous or may fail to form. The resulting vasculature is not fully functional, has a nonuniform distribution and demonstrates irregular branching and arteriovenous shunts (Carmeliet and Conway 2001; Haroon et al. 1999; Jain 2002). We hypothesized that these newly formed unstable vessels supplying a tumor as a result of angiogenesis may be uniquely sensitive to US intensities identical to those used in routine clinical physiotherapy.
Using power Doppler US imaging together with an US contrast agent, we investigated the effect of physiotherapy US on tumor perfusion. In laboratory animals, IV injected US contrast agents have previously been used to visualize blood flow in tumor microvessels (Chomas et al. 2003; Fleischer 2000; Forsberg et al. 2004; Kamotani et al. 2003; Krix et al. 2003). Also, differences in perfusion between regions in a tumor have been demonstrated (Chomas et al. 2003) and have been quantified using image-gating methods (Kamotani et al. 2003).
MATERIALS AND METHODS
Murine tumor model
The animal preparation used in the present study was approved by the University of Pennsylvania’s Institutional Animal Care and Use Committee and the mice were maintained in microisolator cages under aseptic conditions. General anesthesia was induced in 22 female mice (6 to 8 weeks old; 20 to 25 g body weight; C3HV/ HeN strain; Charles River Laboratories, Wilmington, MA, USA) by the IP injection of ketamine hydrochloride (54 mg kg−1; Abbott Laboratories, North Chicago, IL, USA) and xylazine hydrochloride (4 mg kg−1; Phoenix Pharmaceutical Inc., St Joseph, MO, USA). K173522 murine melanoma cells (syngeneic with C3H/HeN mice) were cultured at 37°C in 5% CO2 maintained in Dulbecco’s modified Eagle’s medium (Cambrex Corporation, Walkersville, MD, USA) supplemented with 10% fetal bovine serum (Hyclone Inc., Logan, UT, USA) and 1% penicillin/streptomycin (Invitrogen Corporation, Grand Island, NY, USA). A total of 1 or 2 million melanoma cells were injected subcutaneously in the right flank of each anesthetized mouse. All the animals were imaged before and after tumor insonation and histology was performed in a selected number (Table 1).
Table 1.
Summary of ultrasound imaging and histology studies
| Treatment with physiotherapy US | |||||
|---|---|---|---|---|---|
| Control | 1 min | 2 min | 3 min | Total | |
| US imaging | 4 | 6 | 6 | 6 | 22 |
| Histology | 3 | 4 | 4 | 4 | 15 |
Numbers in the Table represent the number of mice studied.
Before the ultrasonographic studies, a tail vein was catheterized (26 gauge, Abbocath, Abbot Ireland, Sligo, Ireland). Each mouse was transferred to an acrylic box and general anesthesia was induced with 2% isoflurane (Isosol®, Halocarbon Laboratories, River Edge, NJ, USA) and air. The animal was then placed on a table under a heat lamp; a facemask was applied and anesthesia was maintained with 1.5% isoflurane during the periods of ultrasonographic observation.
Within 30 h of the completion of the experiment, a thoracotomy was performed in 15 anesthetized mice, the right atrium was incised and, to fix the tissues, 10 mL 4% w/v paraformaldehyde (Fisher Scientific, Fair Lawn, NJ, USA) in phosphate-buffered saline and sodium hydroxide (20 µL) was injected into the left ventricle. The tumor and overlying cutaneous tissues, as well as the adjacent thigh muscles, were removed for histopathologic study. In the remaining 7 anesthetized mice, only the US studies were performed (as described in the next sections).
Ultrasonography and ultrasonographic contrast medium
In each anesthetized mouse, ultrasonographic observations were made of the tumor before and after its insonation. A depilatory cream (Surgi-Prep®, Sparta Surgical Corporation, Concord, CA, USA) was used to remove the hair coat from the tumor site and US coupling gel was applied to the skin. B-mode ultrasonographic observations (using an identical time-gain compensation for all animals and including compound imaging) (Shattuck and von Ramm 1982) of the tumor were made (7 to 15 MHz probe; footprint = 10 × 35 mm; HDI 5000 SonoCT, Philips, Bothell, WA, USA); the dimensions of the tumor were measured. Images were made in the dorsal and sagittal anatomical planes and recorded on VHS videotape.
At the completion of each B-mode study, an ultrasonographic contrast medium was injected into the tail vein (0.1 mL perflutren protein-type A microspheres; Optison®, GE Healthcare, Princeton, NJ, USA), and the enhancement of power Doppler images, using a mechanical index of 0.9, was recorded on a videotape for quantitative analysis. The microbubbles contained in the contrast agent were destroyed by the US imaging pulses. To maximize the enhancement of the power Doppler images, the exposure of the contrast medium to US was reduced by acquiring the images at a low frame rate of 0.5 Hz (achieved by gating the US scanner at 0.5 Hz). The Doppler US imaging was continued until there was no enhancement in the tumor; thus, ensuring that no microbubble-related effects occurred during insonation of the tumor.
Tumor insonation
After the tumor had grown (over 3 to 4 weeks) to a minimum size of 1 cm in at least one dimension, the tumor was insonated with a physiotherapy US machine (1-MHz, continuous output, power level = 2; D150 Plus, Dynatronics Corp., Salt Lake City, UT, USA). The diameter of the transducer was 2.5 cm and the manufacturer stated that, utilizing the selected parameters, the intensity (spatial-average temporal-average, or ISATA), of the US beam was 2.0 W cm−2. In our laboratory, we measured the effective intensity of the US beam using a radiation force balance (UPM 30, ultrasound power meter, Ohmic Instruments Co., St Michaels, MD, USA). The degassed water used in the balance was prepared by boiling 1 L deionized water in a beaker for 30 min. The beaker was sealed and cooled to room temperature. The measured US intensity (ISATA) was 2.28 ± 0.02W cm−2.
To prevent possible interference from the microbubbles in the contrast agent, there was at least a 5-min period between the completion of the contrast-enhanced Doppler imaging and insonation of the tumor. So that the animal did not move during insonation, the isoflurane was increased to 2%. To avoid insonating the normal contiguous tissues, a rectangular-shaped foam pad (5.0 × 3.0 × 0.7 cm) with a 1-cm diameter hole was applied to the skin of each anesthetized mouse with the hole centered over the tumor (Fig. 1). The hole was filled with nondegassed ultrasonographic coupling gel; part of the insonating beam was transmitted through the gel to the tumor, but other parts of the beam were prevented from reaching the normal tissues contiguous with the tumor by the air-filled foam. The mouse was placed in ventral recumbency and a sagittal anatomical plane was used for the insonation. In this anatomical plane, the insonating beam was directed vertically and passed through the tumor in a dorsoventral direction toward the table top, and not through the abdominal wall and the adjacent organs in the peritoneal cavity. The B-mode and power Doppler observations were made in the identical anatomical plane. Any effects of insonation on the mouse, either locally on the tumor or generally on the health of the animal, were recorded.
Fig. 1.
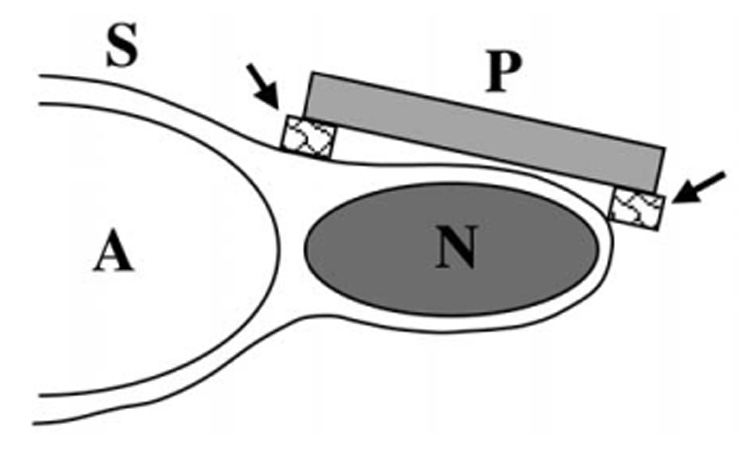
Schema of insonation of murine melanoma. The neoplasm (N) is located subcutaneously over the right side of the abdomen (A) of the mouse. The physiotherapy US probe (P) has been placed on a foam pad (arrows) with its central hole overlying the neoplasm. The space between the face of the probe and the skin (S) was filled with US gel.
Experimental design
In groups of 6 animals, the tumor was insonated (2.28 W cm−2, 1 MHz, continuous duty cycle) for either 1, 2 or 3 min. When the insonation time exceeded 1 min, there was a gap of 5 min between each 1-min period of insonation, during which the face of the probe was cooled in tap water at room temperature. A further group of 4 animals acted as controls; the sonographic probe was applied to the tumor for a total of 3 min, with 5-min intervals between each 1 min of application, as described above, but the machine was not switched on. In each mouse, the ultrasonographic observations (B-mode and contrast studies) were made before and within 5 min of insonation or sham insonation, and were repeated 24 h later.
Analysis of data
The ultrasonographic images of each tumor, recorded on videotape, were digitized (30 frames s−1; 24 bit; Adobe Premiere 6.5, Adobe Systems Inc, San Jose, CA, USA) using a digitizer (MediaConvertor, DVMC-DA2, Sony, Tokyo, Japan) connected to a standard personal computer and stored in an uncompressed format. Before and after the insonation, B-mode and power Doppler images of each tumor were selected for analysis. The power Doppler images were made before and after injection of the US contrast agent; the latter images were chosen on the basis of the one showing the maximum color enhancement. To accurately locate the tumor in the postcontrast images, a region-of-interest (ROI) was traced around the boundaries of the tumor in the precontrast image, and it was then superimposed on the postcontrast image. The images were analyzed using a custom-made software program written in Interactive Data Language (IDL, Research Systems Inc., Boulder, CO, USA). The program has been described (Sehgal et al. 2000, 2001). In summary, it involved using the color palette in the power Doppler image to form a look-up table for the color scheme in hue-saturation-value space. The lowest to highest values in the color palette were assigned values between 0 and 100 on a linear scale. Then, the computer searched for colored pixels within the ROI and assigned each pixel a value between 0 to 100, depending on the value it corresponded to in the calibrated color palette of the US image. This analysis provided a histogram of the ROI, where the zero value represented grey-scale pixels with no Doppler signal, and values 1 to 100 represented the strength of the Doppler signal.
Cumulative histogram curves were obtained for both the treated and control groups of mice by plotting the color level against the fraction of colored pixels. Each curve fractionates the area of the rectangle between (0, 0) and (100, 1) into vascular and avascular components (Appendix A). Therefore, the difference between the area under the curve after treatment and that before treatment was used as a measure of the antivascular effect of insonation in the tumor. The null hypothesis, that there was no reduction in the vascular area between pre- and posttreatment groups, was tested with a paired t-test (Medcalc Software, Mariankerke, Belgium); the difference was considered significant when p < 0.05. An unpaired t-test was used to compare the posttreatment area of the control animals with the posttreatment areas of each of the three treatment groups; the difference was considered significant when p < 0.05.
The average difference (mean ± standard error) between the areas under the pre- and postinsonation histogram curves for the controls and each treatment time was used to evaluate a dose/response relationship by a linear regression analysis. Tumor vascularity was also compared (t-test) between observations made immediately after insonation and 1 day later.
Estimation of ultrasound heating
An estimation of the heating of mammalian tissues was provided by observations made in 1-cm thick slices of fresh bovine muscle. Each of three muscle samples, initially at room temperature, was subjected to 3 × 1 min periods of insonation, as described above. A digital thermometer with thermistor sensor (Thermometer 5800, Omega Engineering Inc., Stamford, CT, USA; diameter = 1.5 mm; response time < 800 ms) was inserted into the muscle before and after (but not during) each period of insonation, and the temperature was recorded. We did not use thermocouples (implanted into the tumor) to make in vivo measurements of the temperature increase in order to avoid the complication of the conversion of acoustic energy to heat that would occur at a tumorthermocouple interface.
Histologic studies
In 15 mice (3 controls, and 4 for each of the three treatment times), the tumors were fixed overnight in 4% paraformaldehyde and were then embedded in paraffin, sectioned and stained with hematoxylin and eosin. Each histologic specimen was viewed under a microscope (Nikon E600 Eclipse, Nikon, Melville, NY, USA) for qualitative assessment of the tissue changes.
RESULTS
The mice recovered normally from the general anesthesia used during the insonation of the tumor, were bright and alert, and ate and drank normally. Each tumor was clearly detectable in the B-mode images. It was generally hypoechoic to the surrounding structures and its boundaries were distinct (Fig. 2a). Immediately after insonation, the skin overlying the tumor blanched and, in the mice receiving 3 min of insonation, it was firm to touch. In some animals (n = 10) a localized area of skin ulceration developed, but there was no apparent correlation between the treatment time and the presence of ulceration. Histologically, the skin overlying the tumor was inflamed and there was merging of collagen fiber bundles. In 6 mice, where the tumor was in close proximity to the femur, there was partial loss of function of the adjacent pelvic limb. At the bone/soft tissue interface between the femur and proximal musculature of the pelvic limb, histology demonstrated localized necrosis of muscle with an associated decrease in muscle striations, interstitial hemorrhage and vascular congestion. The mean peak rise in temperature after each 1-min sonation was 7.6 ± 2.7°C (n = 9), corresponding to an average temperature increase of 3.8°C over the duration of each 1-min period of insonation.
Fig. 2.
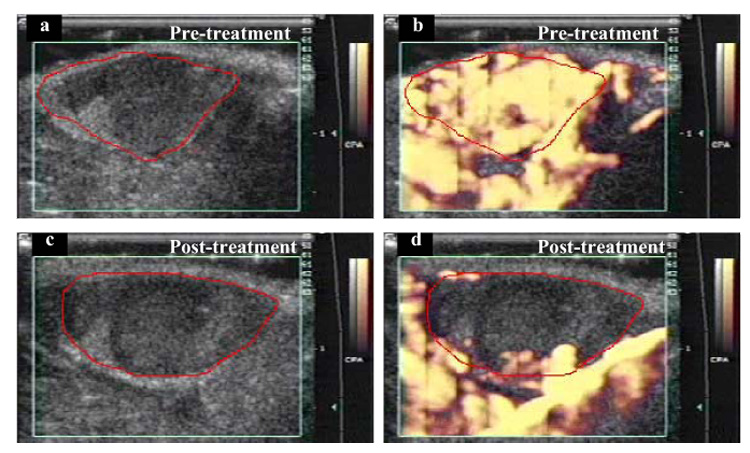
Power Doppler images of a subcutaneous melanoma in a mouse. In the initial pretreatment image (a), the boundary of mostly hypoechoic tumor has been traced in red. The green box superimposed on the image is the region from which Doppler information was acquired (on right side of image are time-gain compensation numbers, centimeter scale and grey-scale and color scale bars). CPA = “color power angio.” (b) At peak enhancement after IV injection of an US contrast agent. (c) Posttreatment (3 min at 2.28 W cm−2), before contrast injection, tumor is again mostly hypoechoic. (d) After contrast injection, there is almost no tumor enhancement, but vascular perfusion is still visible in surrounding healthy tissue. Comparing (b) and (d), it appears that the effect of insonation was to reduce access of contrast medium to tumor blood vessels, but access was maintained in the blood vessels in surrounding healthy tissues.
Before insonation, the contrast-enhanced power Doppler images clearly demonstrated the normal vascular perfusion of the tumor; it was highly vascular, as shown by the uniform flush of color that filled the entire lesion (Fig. 2b); the surrounding healthy tissues were also highly perfused. The postinsonation Doppler images showed, however, that the contrast medium did not enter all regions of the tumor, indicating that parts of the tumor were now avascular and had lost their normal vascular perfusion (Fig. 2d). For each treatment time, these Doppler observations were quantified by plotting cumulative histogram curves that showed the percentage fraction of image pixels that were colored at each color level (Fig. 3). The curves demonstrated that, with increasing insonation, there were fewer colored pixels in the image whereas, in the control animals, the number of colored pixels was maintained (Fig. 3 and Fig. 4).
Fig. 3.
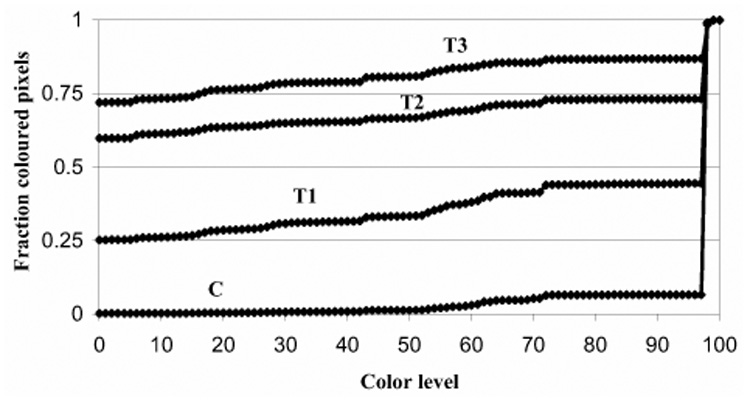
Cumulative histograms of colored pixels in power Doppler images. The number of pixels for each color level (0 = no color, 100 = most brightly colored) was measured from the contrast-enhanced power Doppler images of all murine tumors. Cumulative histogram curves were made of colored pixels in control (C) tumors, and those insonated for 1 (T1), 2 (T2) or 3 (T3) min. In the control animals, 0.94 fraction (94%) of the pixels have a high color level (exceeding color level 97), indicating the tumor is highly perfused. With increasing treatment times, the number of pixels at lower color levels increases progressively. For example, after 3-min treatment, most of the pixels have low color level values (0.72 fraction, 72%, had no color, 0.14 fraction, 14%, had color levels between 1 and 97, and 0.14 fraction, 14%, were between 98 and 100), indicating that the tumor was poorly perfused. The area above each curve measures the vascularity of the tumor, and the area below represents the extent of avascularity. The area between the curve for control (C) animals and each of the curves for treated tumors (T1, T2, T3) represents loss of tumor perfusion after insonation. The area increases progressively with treatment time. The average SD for each curve was as follows: C = ± 0.02, T1 = ± 0.33, T2 = ± 0.29, T3 = ± 0.19.
Fig. 4.
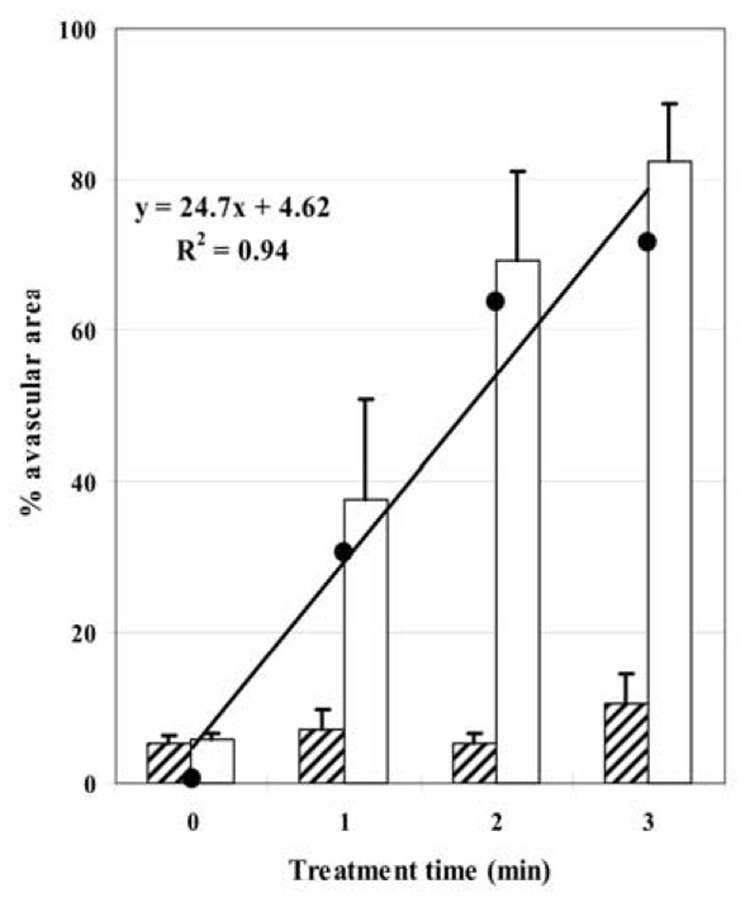
Effect of insonation on vascular perfusion in murine tumors. Hatched blocks represent mean size of avascular area before US treatment and open blocks, that after treatment; the % avascular area was measured from the areas under the cumulative histogram curves (Fig. 3; bars represent the standard error of the mean). In control animals (time = 0) there was no significant change in avascular area but, after insonation, there were highly significant increases in tumor avascularity. (●) represents the magnitude of increase in avascular area between untreated and treated groups, used to plot the linear regression. With increasing treatment time, tumors become increasingly avascular at a rate (slope of the regression line) of about 25% for each min of insonation.
Before insonation, all but 7% of the tumor was perfused (mean of preinsonation data from all tumors; Fig. 4). After insonation of all mice, there were increases in the size of the avascular area in the tumor. When the posttreatment control animals were compared with each of the treatment groups, the differences were highly significant (control vs. 1 min, p = 0.043; control vs. 2 min, p = 0.002; control vs. 3 min, p < 0.001). The avascular area in tumors receiving 3-min treatment had increased to 82%. A linear regression analysis showed that each min of insonation led to a 25% reduction in tumor vascularity, confirming the potent antivascular effect of insonation. Postinsonation, normal vascular perfusion was maintained in the adjacent tissues, including the right kidney; the blood vessels adjacent to the tumor had retained their normal structure and function. One day after insonation, the avascular area in each treated group increased compared to the avascular area immediately after insonation, but the increase was small and was not statistically significant (1 min, p = 0.180; 2 min, p = 0.429; 3 min, p = 0.264; Fig. 5). There was also no significant change in the vascularity of the control group (p = 0.176). The normal perfusion of tissues adjacent to the tumor was again observed.
Fig. 5.
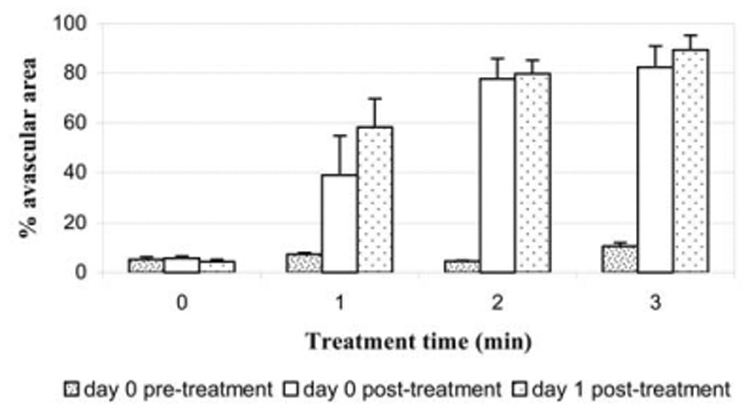
Tumor vascularity (data from all animals) before insonation, immediately after insonation and 1 day after insonation. The blocks represent the mean size of avascular area measured from cumulative histogram curves. Bars = standard error of the mean. At 1 day after insonation, the avascular area in each treated group increased compared to the avascular area immediately after insonation, but the increase was small and not statistically significant. There also was no significant change in vascularity of the control group.
The histopathologic studies (Fig. 6) showed that the effects of insonation were predominantly on the vascular structures within the tumor and correlated with the findings in the contrast-enhanced power Doppler ultrasonographic images. In each of the insonated mice, there was disruption of the walls of the tumor blood vessels with associated hemorrhage, vascular congestion and subsequent thrombosis; edema was also present. The hemorrhage was more prominent in tumors receiving 2 or 3 min of insonation. In each mouse, there were fewer tumor cells and cell necrosis had occurred in the areas of vascular congestion and thrombosis.
Fig. 6.
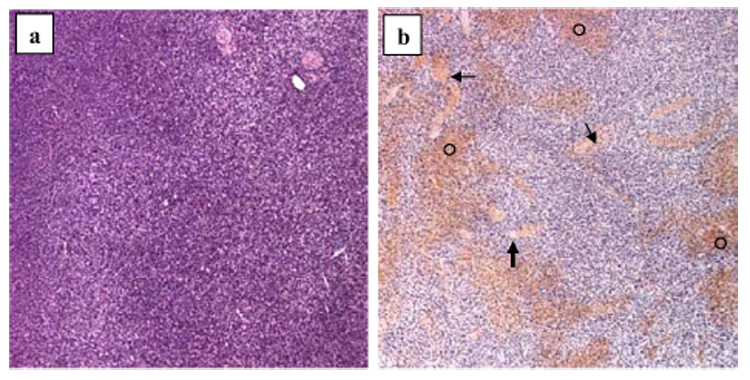
Histologic images (hematoxylin and eosin; magnification 5x) of murine melanomas. (a) In an untreated mouse, the tumor is characterized by tumor cell proliferation with scant edema, intact vasculature and no evidence of necrosis or hemorrhage. (b) In tumor receiving 3-min insonation, there is extensive interstitial hemorrhage (○), vascular congestion (thin arrows) and thrombosis (thick arrow).
DISCUSSION
A commercially available physiotherapy US machine was used to insonate the murine tumor. Such machines produce an US beam with a low intensity, are used as a routine in clinical practice and no adverse bioffects on human tissues have been reported. Our power Doppler and histopathologic observations showed that tumor blood vessels were disrupted by the beam of low-intensity US. Doppler observations on the day after insonation demonstrated a continuing reduction in tumor vascularity, suggesting that the damage to the tumor blood vessels was long lasting. Also, the postinsonation tumor cell necrosis was probably secondary to ischemia because it occurred in the areas of vascular congestion and thrombosis. The fragile, poorly functioning tumor vessels, whose formation is activated by the tumor’s “angiogenic switch,” are likely to be more sensitive to insonation. Vascular congestion, thrombosis and rupture similar to that found in our study were reported in murine thigh tumors heated to 44°C in a water bath for 30 min (Nishimura et al. 1988), and also in rat gliomas treated with combretastatin A-4 (Eikesdal et al. 2001). Recent studies have shown that the maturity of blood vessels within a tumor varies and that the more immature vessels are more sensitive to antivascular therapies (Gee et al. 2003). Because the US-induced antivascular effects are unlikely to be dependent upon specific biochemical pathways used by various drug therapies, it is conceivable that US could be used to disrupt vessels of differing maturities. Additional studies are required to determine if other types of tumors respond to insonation in a manner similar to that found with the melanomas in this study; any differences in response could, in part, be related to the maturity of the tumor vasculature.
Because the morphologic changes observed in this study are similar to those caused by hyperthermia and combretastatin (not involving heat), it is not yet feasible to determine if the observed antivascular activity is of thermal origin only. Other bioeffects, including cavitation, radiation pressure and other nonlinear effects, may also have had a role in disrupting tumor vascularity and reducing its cell numbers (Barnett et al. 1997, 2000), and also in the blanching of the overlying skin. Thermal effects, however, explain the postinsonation clinical and histologic changes observed in the skin overlying the tumor. US is also likely to have been reflected from the rear skin surface and to have contributed to the heating of the tumor. Whether the increase in temperature of the tumor is caused by reflected or transmitted US is not known and requires further investigation. Absorption of the US beam at a bone-soft tissue interface would also have had a heating effect and resulted in the observed localized muscle necrosis adjacent to the femur. Optimization of the beam size, frequency, duty cycle and intensity may further enhance the observed effects on the tumor, while minimizing damage to the surrounding healthy tissues.
In considering the development of cancer therapies, Folkman (2001) proposed that a tumor should be considered to have two cellular compartments, one containing the tumor cells and the other, the endothelial cells of the vascular structures within the tumor. For anticancer therapy to be effective, each compartment may be selectively targeted. We found that low-intensity US particularly targeted the vascular structures within the tumor, but the variable effects on the tumor cell compartment appeared to be secondary to the resultant ischemia. This raises the future possibility of combining insonation with other forms of therapy that specifically target the neoplastic cell compartment of the tumor. Such a combination of therapies may result in a more comprehensive and effective cancer therapy than if either treatment was used alone.
Acknowledgements
This work was supported by the US NIH (grant no. EB001713).
APPENDIX A
Cumulative histogram analysis of contrast-enhanced power Doppler US images
The cumulative histogram is a variation of the conventional histogram, in which each data point of the curve represents the counts (or fraction) of events for the histogram bin plus counts of the all the bins of smaller values. The fraction for a given bin in the cumulative histogram is determined by dividing the number of events for that bin by the total number of events. In this study, a conventional histogram was constructed by measuring the number of colored pixels for each color level from 0 to 100; the bin size in each histogram was one. The conventional histogram was normalized by dividing the number of colored pixels in each bin by the number of pixels enclosed within the ROI (tumor in the US image). The cumulative histogram was constructed by adding the fraction of colored pixels for each bin in the conventional histogram to the sum of the fraction of colored pixels from all the bins of lower values. Figure 7 shows a family of cumulative histograms in which (a′), (b′), (c′) and (d′) correspond to conventional histograms (a), (b), (c) and (d). Figure 7 demonstrates how the shape of the cumulative histogram curve and the magnitude of the area under the curve change with the nature of the conventional histogram.
Fig. 7.
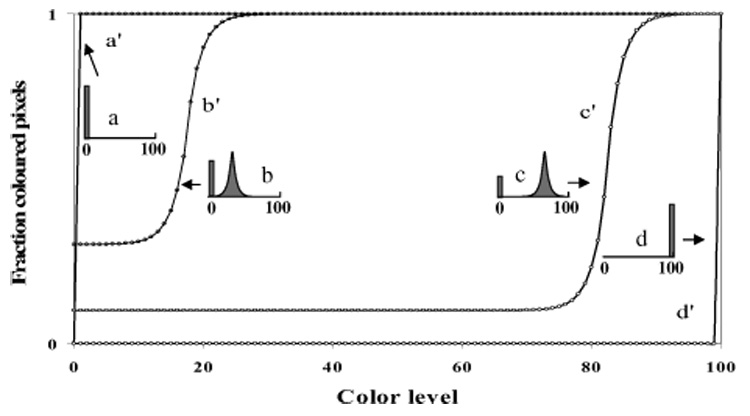
Cumulative histogram analyses of contrast-enhanced power Doppler US images, illustrating the conceptual relationships between the cumulative histograms (curves a′, b′, c′ and d′) and various corresponding normalized conventional histograms (inserts a, b, c and d).
When all the pixels within the ROI are grey-scale pixels (color level = 0; Fig. 7, conventional histogram [a]) and the tissue is thus completely (100%) avascular, the cumulative histogram curve follows the y-axis until it reaches a maximum value (fraction = 1) and then follows the horizontal path (Fig. 7, curve [a′]). The area under the cumulative histogram curve for this 100% avascular condition is equal to the area bound by the rectangle (0,0), (0,1), (1,100), and (100,0) and has a value of 100.
As the ROI in the image becomes vascular, the fraction of pixels with a color level > 0 will increase, whereas the fraction with the grey-scale level (color level = 0) will decrease (Fig. 7, conventional histogram [b]). The cumulative histogram for the conventional histogram will exhibit a slow increase in the curve before leveling off to fraction = 1 (Fig. 7, curve [b′]). In this case, the area under the cumulative histogram curve has some value (x), whereas the area above the curve has a value 100 − x. That is, as the ROI becomes more vascular, the avascular component represented by the area under the cumulative histogram curve decreases.
A further increase in tumor vascularity (or reduction in avascularity) shifts the conventional histogram to higher color levels (Fig. 7, conventional histogram [c]). The corresponding cumulative histogram also shifts accordingly (Fig. 7, curve [c′]) and the area under the curve (avascular component) decreases, whereas that above the curve (vascular component) increases.
In the limiting case, when each pixel representing the tumor has maximum vascularity, all the pixels will have maximum flow (color level = 100; Fig. 7, conventional histogram [d]). In this case, the cumulative histogram follows the curve (d′) in Fig. 7. The area under the cumulative histogram curve (avascular component) reduces to zero, whereas that above the curve (vascular component) increases to a value of 100.
Thus, the cumulative histogram curve derived from the contrast-enhanced power Doppler image can be viewed as a curve that partitions the vascular and avascular components of the ROI in the imaged tissue. The area under the curve represents the avascular fraction and the area above the curve represents the vascular fraction.
REFERENCES
- Baker KG, Robertson VJ, Duck FA. A review of therapeutic ultrasound: Biophysical effects. Phys Ther. 2001;81:1351–1358. [PubMed] [Google Scholar]
- Barnett SB, Rott H-D, ter Haar GR, Ziskin MC, Maeda K. The sensitivity of biological tissue to ultrasound. Ultrasound Med Biol. 1997;23:805–812. doi: 10.1016/s0301-5629(97)00027-6. [DOI] [PubMed] [Google Scholar]
- Barnett SB, ter Haar GR, Ziskin MC, et al. International recommendations and guidelines for the safe use of diagnostic ultrasound in medicine. Ultrasound Med Biol. 2000;26:355–366. doi: 10.1016/s0301-5629(00)00204-0. [DOI] [PubMed] [Google Scholar]
- Carmeliet P, Conway EM. Growing better blood vessels. Nat Biotechnol. 2001;19:1019–1020. doi: 10.1038/nbt1101-1019. [DOI] [PubMed] [Google Scholar]
- Carmeliet P, Jain RK. Angiogenesis in cancer and other diseases. Nature. 2000;407:249–257. doi: 10.1038/35025220. [DOI] [PubMed] [Google Scholar]
- Chomas JE, Pollard RE, Sadlowski AR, et al. Contrast-enhanced US of microcirculation of superficially implanted tumors in rats. Radiology. 2003;229:439–446. doi: 10.1148/radiol.2292020536. [DOI] [PubMed] [Google Scholar]
- Clement GT. Perspectives in clinical uses of high-intensity focused ultrasound. Ultrasonics. 2004;42:1087–1093. doi: 10.1016/j.ultras.2004.04.003. [DOI] [PubMed] [Google Scholar]
- Demmink JH, Helders PJM, Hobaek H, Enwemeka C. The variation of heating depth with therapeutic ultrasound frequency in physiotherapy. Ultrasound Med Biol. 2003;29:113–118. doi: 10.1016/s0301-5629(02)00691-9. [DOI] [PubMed] [Google Scholar]
- Diederich CJ, Stafford RJ, Nau WH, et al. Transurethral ultrasound applicators with directional heating patterns for prostate thermal therapy: In vivo evaluation using magnetic resonance thermometry. Med Phys. 2004;31:405–413. doi: 10.1118/1.1639959. [DOI] [PubMed] [Google Scholar]
- Eikesdal HP, Bjerkvig R, Raleigh JA, Mella O, Dahl O. Tumor vasculature is targeted by the combination of combretastatin A-4 and hyperthermia. Radiother Oncol. 2001;61:313–320. doi: 10.1016/s0167-8140(01)00450-9. [DOI] [PubMed] [Google Scholar]
- Fleischer AC. Sonographic depiction of tumor vascularity and flow: From in vivo models to clinical applications. J Ultrasound Med. 2000;19:55–61. doi: 10.7863/jum.2000.19.1.55. [DOI] [PubMed] [Google Scholar]
- Folkman J. Tumor angiogenesis: Therapeutic implications. N Engl J Med. 1971;285:1182–1186. doi: 10.1056/NEJM197111182852108. [DOI] [PubMed] [Google Scholar]
- Folkman J. Angiogenesis. In: Braunwald E, Fauci AS, Kasper DL, et al., editors. Harrison’s textbook of internal medicine. New York: McGraw-Hill; 2001. pp. 517–530. [Google Scholar]
- Forsberg F, Ro RJ, Potoczek M, et al. Assessment of angiogenesis: Implications for ultrasound imaging. Ultrasonics. 2004;42:325–330. doi: 10.1016/j.ultras.2003.12.026. [DOI] [PubMed] [Google Scholar]
- Gee MS, Procopio WN, Makonnen S, et al. Tumor vessel development and maturation impose limits on the effectiveness of anti-vascular therapy. Am J Pathol. 2003;162:183–193. doi: 10.1016/S0002-9440(10)63809-6. [DOI] [PMC free article] [PubMed] [Google Scholar]
- Haroon ZA, Peters KG, Greenberg CS, Dewhirst MW. Angiogenesis and oxygen transport in solid tumors. In: Teicher BA, editor. Antiangiogenic agents in cancer therapy. Totowa, NJ: Humana Press; 1999. pp. 3–21. [Google Scholar]
- Hazle JD, Diederich CJ, Kangasniemi M, et al. MRI-guided thermal therapy of transplanted tumors in the canine prostate using a directional transurethral ultrasound applicator. J Magn Reson Imaging. 2002;15:409–417. doi: 10.1002/jmri.10076. [DOI] [PubMed] [Google Scholar]
- Hynynen K, Pomeroy O, Smith DN, et al. MR imaging-guided focused ultrasound surgery of fibroadenomas in the breast: A feasibility study. Radiology. 2001;219:176–185. doi: 10.1148/radiology.219.1.r01ap02176. [DOI] [PubMed] [Google Scholar]
- Jain RK. Tumor angiogenesis and accessibility: Role of vascular endothelial growth factor. Semin Oncol. 2002;29 Suppl. 16:3–9. doi: 10.1053/sonc.2002.37265. [DOI] [PubMed] [Google Scholar]
- Jin ZH, Miyoshi N, Ishiguro K, Umemura SI, et al. Combination effect of photodynamic and sonodynamic therapy on experimental skin squamous cell carcinoma in C3H/HeN mice. J Dermatol. 2000;27:294–306. doi: 10.1111/j.1346-8138.2000.tb02171.x. [DOI] [PubMed] [Google Scholar]
- Kamotani Y, Lee WMF, Arger PH, Cary TW, Sehgal CM. Multigated contrast-enhanced power Doppler to measure blood flow in mice tumors. Ultrasound Med Biol. 2003;29:977–984. doi: 10.1016/s0301-5629(03)00054-1. [DOI] [PubMed] [Google Scholar]
- Krix M, Kiessling F, Vosseler S, et al. Comparison of intermittentbolus contrast imaging with conventional power Doppler sonography: Quantification of tumour perfusion in small animals. Ultrasound Med Biol. 2003;29:1093–1103. doi: 10.1016/s0301-5629(03)00060-7. [DOI] [PubMed] [Google Scholar]
- Madersbacher S, Kratzik C, Marberger M. Prostatic tissue ablation by transrectal high intensity focused ultrasound: Histological impact and clinical application. Ultrason Sonochem. 1997;4:175–179. doi: 10.1016/s1350-4177(97)00026-6. [DOI] [PubMed] [Google Scholar]
- Melodelima D, Lafon C, Prat F, et al. Trans-esophageal ultrasound applicator for sector-based thermal ablation: First in vivo experiments. Ultrasound Med Biol. 2003;29:285–291. doi: 10.1016/S0301-5629(02)00701-9. [DOI] [PMC free article] [PubMed] [Google Scholar]
- Nishimura Y, Hiraoka M, Jo S, et al. Microangiographic and histologic analysis of the effects of hyperthermia on murine tumor vasculature. Int J Radiat Oncol Biol Phys. 1988;15:411–420. doi: 10.1016/s0360-3016(98)90023-2. [DOI] [PubMed] [Google Scholar]
- Paterson RF, Barret E, Siqueira TM, Jr, et al. Laparoscopic partial kidney ablation with high intensity focused ultrasound. J Urol. 2003;169:347–351. doi: 10.1016/S0022-5347(05)64124-9. [DOI] [PubMed] [Google Scholar]
- Palussiere J, Salomir R, Le Bail B, et al. Feasibility of MR-guided focused ultrasound with real-time temperature mapping and continuous sonication for ablation of VX2 carcinoma in rabbit thigh. Magn Reson Med. 2003;49:89–98. doi: 10.1002/mrm.10328. [DOI] [PubMed] [Google Scholar]
- Robertson VJ, Baker KG. A review of therapeutic ultrasound: Effectiveness studies. Phys Ther. 2001;81:1339–1350. [PubMed] [Google Scholar]
- Sehgal CM, Arger PH, Rowling SE, et al. Quantitative vascularity of breast masses by Doppler imaging: Regional variations and diagnostic implications. J Ultrasound Med. 2000;19:427–440. doi: 10.7863/jum.2000.19.7.427. [DOI] [PubMed] [Google Scholar]
- Shattuck DP, von Ramm OT. Compound scanning with a phased array. Ultrason Imaging. 1982;4:93–107. doi: 10.1177/016173468200400201. [DOI] [PubMed] [Google Scholar]
- Uchida T, Sanghvi NT, Gardner TA, et al. Transrectal high-intensity focused ultrasound for treatment of patients with stage T1b-2N0M0 localized prostate cancer: A preliminary report. Urology. 2002;59:394–399. doi: 10.1016/s0090-4295(01)01624-7. [DOI] [PubMed] [Google Scholar]


