Abstract
This paper presents a three dimensional edge operator aimed at the detection of anatomical structures in medical imaging. It uses the spatial moments of gray level surface and operates in three dimensions with any window size. It allows to estimate the location and the contrast surface as well as the surface orientation. The computation of the discrete version is reported. Bias and errors due to the spatial sampling and noise are analysed both at a theoretical and experimental level The moment-based operator is compared with other well known edge operators on simple shaped primitives for which the analytical solution is known. The 3D rendering of real data is then provided by merging the operator in a ray tracing framework.
Keywords: Artifacts; Humans; Image Interpretation, Computer-Assisted; methods; Image Processing, Computer-Assisted; methods; statistics & numerical data; Mathematics; Observer Variation
I. INTRODUCTION
Advanced imaging systems enable the users in medicine, biology, and other areas to acquire a true 3D information in the form of densely sampled contiguous volume elements (voxels). Understanding volume data necessitates effective tools to display, manipulate, enhance and analyse the underlying structures while preserving their full dimensionality [1]. A number of segmentation techniques have been reported in the 2D case which operate either by discontinuity detection or by region formation. The first approach consists mainly of edge detection procedures while the second is characterized by region growing, labelling techniques and texture analysis. In computer vision as well as in medical imaging, the first approach far outnumbers the second and is increasingly used.
Edge detection techniques have been investigated in depth in the literature. Sobel’s, Prewitt’s operators and their alternate versions [2], moment-based operator [3], facet model approach [4], Canny’s method [5], Laplacian-of-Gaussian (LOG) [6], and difference of recursive filtering(DRF) [7] are among the most well known solutions. Some of the 2D approaches have been generalized by several authors. The 3D surface operators proposed by Zucker & al.[8] and Morgenthaler & al.[9] belong to facet model approaches and make use of polynomial surface fitting. The 3D extension of LOG proposed by Bomans et al. [10] looks only for the surface location. In 3D medical imaging, the standard techniques are the gray-scale gradient and the magnitude thresholding methods [11,12,13]. These simple techniques have led to attractive results in the display of 3D objects.
However, quantitative characterisation of anatomic structures remains one of the major issue in medicine. Automated and partly automated measurements require functionally correct, accurate and computationally efficient segmentation procedures. The present work was mainly motivated by this need for an accurate 3D edge operator with higher performance [13] [14]. The moment properties have been largely used as a tool to describe the object shape and feature informations, and to classify image regions. Various moment forms have been reported such as spatial moments, gray-scale and Legendre moments [15] for detection purpose. A 3D moment-based edge operator is proposed and discussed in this paper. Initially designed for the estimation of surface normal [13] it can be seen as a 3D generalization of the 2D edge operator, reported by Lyvers & al. [16], emphasizing additionnal capabilities to compute the position and the contrast of a surface with subvoxel precision.
In Section II, the basic features of the moment set are given. The section III presents the mask computation problem for an efficient implementation. The error due to the voxel sampling effect and its correction, the performance of the operator on noisy data are discussed Section IV. Finally, some results are provided on simulated and real data and compared to other detection schemes (Section V).
II. BASICS
Let f(x,y,z) be a 3D continuous gray-level image containing an object, and W be a spherical window with radius R close to a surface point. The choice of a spherical window allows to have a full symmetry. W contains a segment of the surface which can be theoretically considered as a plane if W is small. This plane divides the window W into two regions, the background region with an intensity value a and the object region with an intensity value a+b. The normal to the plane can be specified by a unit vector defined as a function of (α,β) (Figure 1). The distance from the window center to the plane is denoted by h. Five parameters define the ideal surface within a spherical window: (a, b, h, α, β). These parameters are derived below from the spatial moment set computed in a spherical neighboring window.
Figure 1.
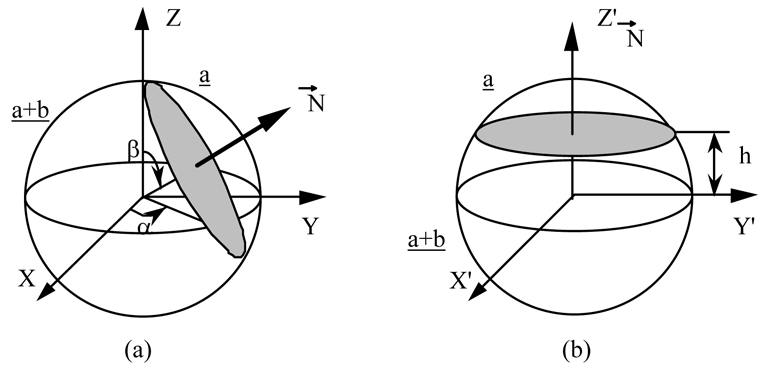
The ideal surface in a spherical window and the parameters set (a, b, h, α, β) before (a) and after (b) rotation.
Recall that the moments of order (p+q+r) of a continuous function f(x,y,z) are defined by
| (1) |
and a closed moment set of order n is invariant with respect to the geometric operations, rotation, translation and scaling, and consists of original moments of order n and lower. In order to simplify the problem statement, two rotations around the window center are applied to the window W to align the normal vector to the z-axis. The combined rotation matrix is given by:
| (2) |
and the rotated moments can be written as follows:
| (3) |
From the above equations, we can obtain the rotated moment set up to the second order:
| (4a) |
| (4b) |
| (4c) |
| (4d) |
| (4e) |
| (4f) |
| (4g) |
| (4h) |
| (4i) |
| (4j) |
II. 1 Surface Orientation
The surface orientation can be derived from surface geometric information such as its depth derivatives. However the derivative operator is very sensitive to noise and depends on the surface detection step. It is of interest to estimate the surface orientation independently and directly on the gray-scale image. The integrative nature of the moment based operator can increase the accuracy in case of digital image (see section IV).
Due to the symmetry of the rotated window W about z-axis, we have M′100 =0 and M′010 = 0 and by solving the equations:
| (5a) |
| (5b) |
we can obtain:
| (6a, 6b) |
Obviously, (α, β) can uniquely determine the direction of the normal vector. From Figure 1, we have:
| (6c, 6d) |
Where (nx,ny,nz) are the components of the normal vector
Comparing the above equations, we can compute the normal to the surface presented by the three first-order moments:
| (7) |
Note that if k=−1/M000, is a vector from the centroid of the spherical window W to its center, and if the gray-value in the object region is higher than that in the background, the vector coincides with the outer normal to the surface [13]. What we are interested in is merely the direction of , i.e. the sign of the factor k, so we can set k = −1.
II. 2 Surface Location and Strength
Based on Figure 1b, some moments (in 4a, 4d, 4j) can be obtained by integration in the corresponding regions:
| (8a) |
| (8b) |
| (8c) |
Some substitutions in equations (8) allow to find the surface translation h related to the window center and the surface strength (or contrast) b as follows:
| (9a, 9b) |
From the equations (4d) and (4j), we can describe the rotated moments by the unrotated moment set:
| (10a) |
| (10b) |
So, the surface translation h and the surface strength b can be obtained according to the moment set computed in a spherical window:
| (11) |
| (12) |
The parameter h gives the translating distance of a surface point (xs,ys,zs) to the window’s center (iojoko. Considering the conversion between the spherical coordinate system and the Cartesian coordinate system, the surface point is defined by:
| (13a) |
| (13b) |
| (13c) |
The last terms in these equations determine the edge location with a subvoxel accuracy.
Equation (12) shows that the surface strength b is proportional to Mb. If h is set to zero, the computation of b can be simplified. In practice, Mb is used as a confidence measure of the edge (detecting the presence of a surface element) which is in fact the magnitude of the vector defined by the three first order moments and defining the surface normal, and then the computation can be refined by using the complete formulas.
III. COMPUTATION OF THE DISCRETE MOMENT SET
A 3D digital image f(x,y,z) is represented by a matrix of voxels, each voxel is a small cubic region of f(x,y,z), and has a gray-value equal to the average value of all points throughout this region:
| (14) |
So within each voxel, Vijk, the gray-value is a constant, d(i,j,k). On the other hand, the computation is carried out within a spherical window, each voxel belonging to the cube bounding the spherical window W has different contributions to the moments due to the cube-aperture sampling. To take into account these contributions, a weighting function, Cpqr(i,j,k), is used to carry out the discrete integrations:
| (15) |
and Cpqr(i,j,k) can be defined as follows:
Let Aijk be the volume part of the voxel Vijk within the spherical window (Figure 2), so
Figure 2.

2D and 3D illustrations of the discrete computation of the masks with a 3×3×3 window.
| (16) |
and hence the moment can be written:
| (17) |
and
| (18) |
The weighting functions Cpqr(i,j,k) (or masks) can be found by means of an approximation of the integrals. We adopt here a finite element approach. Each voxel in a n×n×n cubic window is subdivided into m×m×m subvoxels within a spherical window of radius of R, so the subvoxel size is and has a volume of . Then in each region Aijk, the integrals can be computed at a subvoxel level:
| (19a) |
where Δx = Δy = Δz, ΔV = Δx3, and (i′.j′,k′) denotes the subvoxel position within the window, so the masks can be written:
| (19b) |
and one needs only to compute the coefficients:
| (20) |
(i′,j′,k′) are integers on a different scale from (i,j,k).
These masks are easily implemented and their precision only depends on the sub-sampling, m.
Figure 3 provides a mask set computed with m=200, n=3, R=l and Figure 4 the mask set corresponding to m=200, n=5, R=1. The complete mask set can be defined from these masks through the rotations:
where the rotations around the x,y,z axes are:
Figure 3.
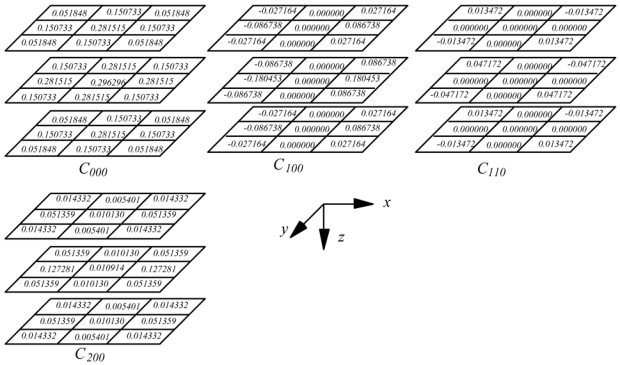
Moment masks in an unit sphere (R=l) centered in a 3×3×3 neighboring window (n=3), computed by resampling each voxel into 2003 subvoxels (m=200).
Figure 4.
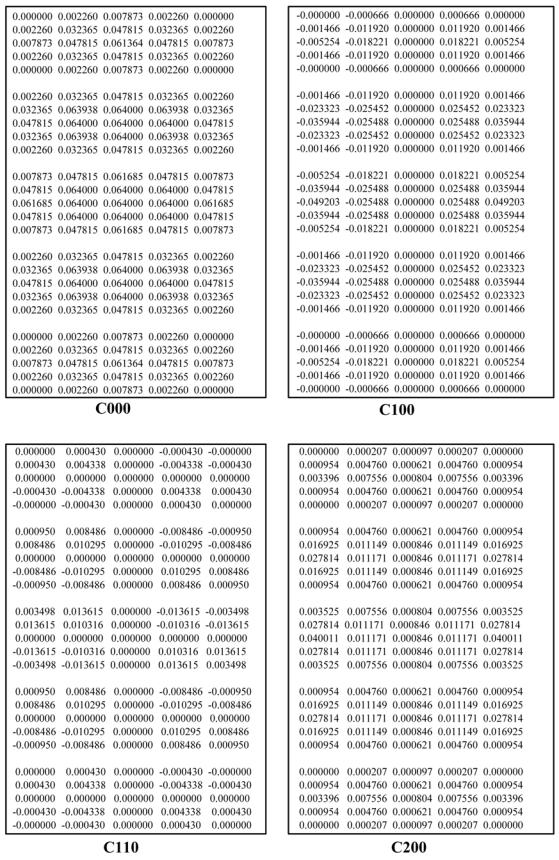
Moment masks with R = 1, m = 200, n = 5. c010, C00l can be obtained by symmetry from C100 C101, C011 from C110 and C020 C002 from C200
Once the masks are computed for a given window size, they can be stored and used as a look-up table in the surface estimation process.
IV. ANALYSIS OF BIAS AND ERRORS OF THE OPERATOR
The proposed approach consists to fit an ideal edge by using the spatial moments in a continuous and noise-free domain. However, in real images, the noise, the spatial sampling and the gray-value quantization have direct and indirect effects on the estimation of the five parameters of the surface and generate bias and errors.
The ramp edge problem was discussed by many authors of edge detection methods. This is a real problem in computer vision due to the inhomogeneity of light distribution in the scene. In medicine, the imaging modalities often provide step-wise contrasts between anatomical structures although the partial volume effect due to the sampling leads to edge smoothing. This section focusses on the step-like transition but the study can also be extended to the ramp case.
IV. 1 Spatial sampling effects
To illustrate the spatial sampling effects on the operator, we have used a synthetic image consisting of a 7×7×7 matrix with a plane separating the image volume into the object region and the background. The orientation of the plane is defined by the angles α, β and its equation when passing through the origin of the local coordinate system (e.g. the center of the voxel V444), is given by:
| (21) |
A subvoxel description (1/20) is then achieved with respect to:
| (22) |
and each voxel is assigned the average value of all subvoxels values (a or a+b) within it.
Most of the edge detection approaches use the edge geometry information to define the edge orientation. The edge orientation is not important in 2D case, but it has a determining importance in the 3D case where normal vector to the surface is not only used for 3D object shading and rendering, but also for object manipulation and recognition.
The test has been performed with a = 50, b = 100, h = 0 and for different plane orientations. The differences between the estimated parameters (h̃, b̃, α̃, β̃) and the true values related to the central voxel are plotted (Figure 5) versus the angles (α, β). The calculation has been conducted over [0,355°] and [5°,175°] for α and β respectively, with dα = dβ = 5°. Note that there is a symmetry about α = 45° and β = 45°.
Figure 5.

Errors on the surface parameters when the operator is applied to the simulated plane (window size (ws) equal to 5).
IV. 2 Noise Analysis
In the noisy case, we assume that independent, identically distributed Gaussian noise is added to the voxel gray values.
The noisy surface can be modeled as:
| (23) |
| (24) |
Therefore, the random moment can be viewed as a random part added to a deterministic one. Ñpqr is simply the weighted sum of independent, zero mean and gaussian random variables such that:
- the mean of the resulting density is zero,
- its variance is:
| (25) |
where σ2 is the variance of the noise.
Although, the moments M̃pqr are gaussian random variables, the rotated moments are not, with exception of . Then, noise analysis is quite complex, and the probability density of some surface parameters are impossible to determine.
It can be shown that the moment weightings cause M̃′100, M̃′010, M̃′001 to be independent of each other.
IV. 2.1 Effect of noise on edge orientation
a)
α̃ is simply the quotient of two independent, gaussian random variables, with the added transformation of arctangent.
The density function for α̃ [16] [17] is:
| (26) |
where
σ: the standard deviation of the numerator and the denominator.
Using the transformation,
fα̃ can be written:
| (27) |
It can be seen that this density function is symmetrical about (the mean value of α̃ is ϕ).
b)
In the β̃ case, the arctangent transformation is applied to the quotient of two independent random variables, with a gaussian denominator and non gaussian numerator.
After a fair amount of mathematical manipulations [18], the density function in an integral form is given by:
| (28) |
where:
It is quite difficult to develop more than this (a full development is available in [19]).
IV. 2.2 Effect of noise on the edge contrast and translation
The same study can be done to evaluate the effect of noise on the contrast and the translation. These two parameters are given as a quotient obtained by combining ten random variables and their density functions are impossible to find analytically.
Instead, empirical noise analysis was done. The data consisted of zero mean gaussian random noise added to the plane used in the deterministic case. The standard deviation of the noise samples was determined by the signal-to-noise ratio as:
| (29) |
where σs and σn are the standard deviations of the signal and the additive noise respectively. Figures 6 and 7 illustrate the error of the spatial moment operator when compared to the exact solution. For each SNR, 100 different noise sequences were added to the sample surface. The estimated values closely matched the analytical ones as soon as the signal-to-noise ratio is higher than 20dB.
Figure 6.
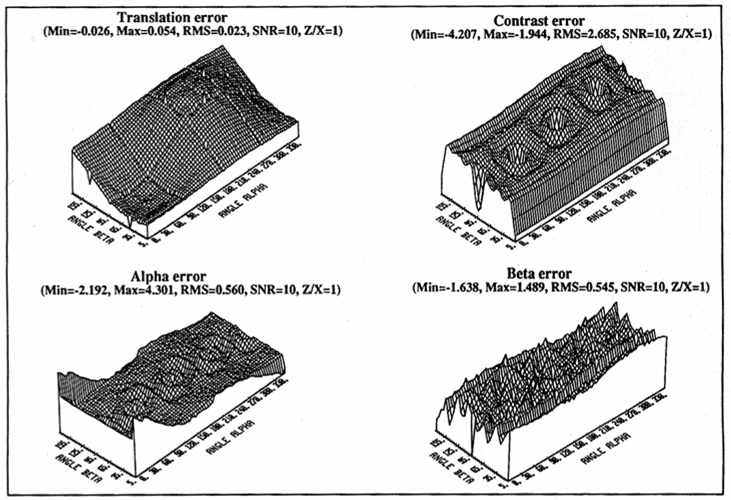
Error plotting for the geometric moment operator applied to the simulated plane with SNR =10 dB, ws=5.
Figure 7.
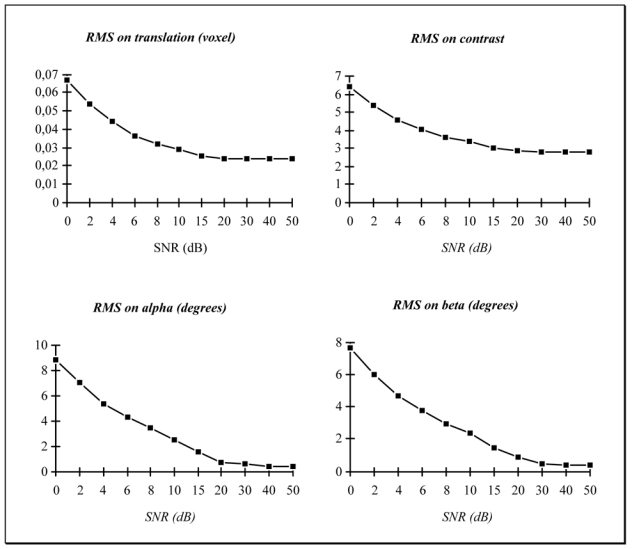
RMS of the operator errors on the plane surface parameters versus the SNR.
V. RESULTS AND DISCUSSION
Several experiments have been conducted on simulated and real 3D data. They include the comparison between analytical and estimated surface normal of simple geometrical shapes in presence of noise and the comparison of the moment-based operator with other surface detection procedures. Surface tracking and ray tracing techniques [1] [20] have been used to carry out the calculations and the 3D rendering.
V. 1 The moment operator compared with other detectors
This comparative study [19] has been performed in 3D with the Prewitt (or gray level gradient) and Sobel’s operator, the Zucker and Hummel’s operator, the Canny/Deriche’s detector [21][22] and the gradient of gaussian. The two first operators have been generalized to the 3D space by using the separability property in the frequency domain. The coefficients of the masks can be computed by Taylor’s development of the partial derivatives. The two others are obtained in 3D by means of spatial separability. A truncation has been performed to deal with the implementation constraints of the ray tracing technique. The control coefficient γ of the Canny’s operator and the standard deviation σ of the gaussian have been set according to the corresponding window size (ws). They have been varied, but only the best suited values will be shown here. Notice that only the moment-based method allows to estimate directly the surface location within a voxel. Other methods [23] make use of local interpolation to provide a surface with subvoxel precision.
The size of the data base was 90×90×90. The object consists of a sphere intersected by a plane (the plane equation is: 2x + 3/2y + z = R, where R is the sphere radius). This volume has been sampled at a subvoxel resolution equal to 1/10. Each surface voxel of the object is defined by its gray level, the theoretical values of the surface normals. The contrast has been set to 200. The differences in position, contrast and normal orientation have been quantified by means of the root mean square (RMS) and the maximum error (ME). The evaluation has been achieved on the sphere and the plane before considering the truncated sphere. This choice allows to clearly identify the deviations introduced at the intersection between the two primitive shapes.
The simulated data base used by Tiede & al [24] has also been implemented, but additionnal geometrical elements (cone, pyramid) were not necessary at this stage.
Table I depicts the results obtained in a noise free situation for the normal estimation. The RMS shows clearly the better behavior of the moment operator and the good performance of the Canny’s and the gradient of gaussian methods (they are in fact very close together). No significant differences appear when the surface discontinuities (truncated sphere) are introduced but the degradation is very high (Image 1). The deviations shown on noisy data (additive white gaussian noise) confirm these observations (Table II). The three above mentioned operators work well up to a signal to noise ratio equal to 10 dB. A qualitative representation is displayed in Image 1 which allows to have a full view of the object and to emphasize the performance of the moment based method in noise free conditions.
Table I.
Comparison of the surface normal estimation with the analytical normal computed from different operators. Maximum error (ME) and RMS (in degrees) are given for a window size equal to 5.
| Operators ws=5 | Sphere | Plane | Truncated sphere | ||||
|---|---|---|---|---|---|---|---|
| Max | RMS | Max | RMS | Max | RMS | ||
| Moments | 0.912 | 0.420 | 0.612 | 0.411 | 39.349 | 6.108 | |
| Prewitt 3D | 7.331 | 4.719 | 3.436 | 3.194 | 37.139 | 7.690 | |
| Sobel 3D | 9.185 | 5.735 | 4.848 | 4.472 | 40.219 | 7.550 | |
| Zucker | 5.596 | 3.543 | 2.723 | 2.521 | 37.179 | 7.065 | |
| Canny | γ=1.6 | 1.804 | 0.635 | 0.839 | 0.678 | 40.306 | 5.672 |
| Gradient of a gaussian | σ =1.0 | 1.416 | 0.485 | 0.545 | 0.404 | 39.608 | 5.638 |
Image 1.

Deviations between analytical and estimated surface normals. The larger differences appear at the intersection of the primitive objects.
Table II.
Surface orientation error (degrees) in the presence of additive gaussian noise (window size = 5) (Half sphere model).
| Sphere | Plane | Truncated sphere | |||||
|---|---|---|---|---|---|---|---|
| SNR | Operators ws=5 | Max | RMS | Max | RMS | Max | RMS |
| 0dB | Moments | 34.307 | 10.303 | 23.941 | 8.804 | 52.529 | 11.012 |
| Canny γ=1.6 | 39.596 | 11.812 | 29.498 | 10.419 | 54.864 | 11.992 | |
| Gaussian σ=1 | 39.008 | 11.654 | 28.136 | 10.169 | 54.112 | 11.786 | |
| Zucker | 24.321 | 9.127 | 19.925 | 7.659 | 48.331 | 10.386 | |
| Prewitt | 25.744 | 9.834 | 22.981 | 8.218 | 53.748 | 10.968 | |
| 10 dB | Moments | 10.206 | 3.228 | 7.053 | 2.740 | 39.076 | 6.751 |
| Canny γ=1.6 | 12.588 | 3.727 | 9.440 | 3.282 | 40.806 | 6.563 | |
| Gaussian σ=1 | 11.884 | 3.655 | 9.049 | 3.155 | 40.792 | 6.499 | |
| Zucker | 10.196 | 4.425 | 7.700 | 3.408 | 38.371 | 7.463 | |
| Prewitt | 11.969 | 5.451 | 9.023 | 3.995 | 38.560 | 8.089 | |
| 20 dB | Moments | 3.179 | 1.024 | 2.668 | 0.978 | 38.607 | 6.175 |
| Canny γ=1.6 | 4.628 | 1.286 | 3.359 | 1.197 | 39.968 | 5.750 | |
| Gaussian σ=1 | 4.224 | 1.202 | 3.049 | 1.025 | 39.329 | 5.711 | |
| Zucker | 7.023 | 3.635 | 4.170 | 2.645 | 36.736 | 7.106 | |
| Prewitt | 8.791 | 4.797 | 4.948 | 3.289 | 37.530 | 7.731 | |
| 30 dB | Moments | 1.368 | 0.499 | 1.096 | 0.467 | 39.299 | 6.111 |
| Canny γ=1.6 | 2.113 | 0.713 | 1.450 | 0.744 | 40.253 | 5.675 | |
| Gaussian σ=1 | 1.814 | 0.579 | 1.180 | 0.488 | 39.571 | 5.639 | |
| Zucker | 5.966 | 3.556 | 3.014 | 2.532 | 37.079 | 7.068 | |
| Prewitt | 7.741 | 4.727 | 3.741 | 3.208 | 37.253 | 7.694 | |
The contrast estimation is directly available from the moment operator. It can be computed for the others by calculating the edge strength through different norms (L□, L1, L2). The latter leads to a better approximation and is used here. All the methods provide relatively significant differences and a better contrast estimation with a larger window size (Table III). The results of the moment-based approach depend on the subvoxel sampling. It does not show any improvement for the surface contrast computation.
Table III.
Surface contrast error for different operators and window sizes (Half sphere model).
| Operators | Sphere | Plane | Truncated sphere | |||
|---|---|---|---|---|---|---|
| Max | RMS | Max | RMS | Max | RMS | |
| Moments ws=3
ws=5 |
39.97
16.14 |
26.74
10.89 |
34.25
11.77 |
27.07
10.26 |
67.60
36.87 |
27.48
11.84 |
| Zucker ws=3
ws=5 |
23.09
14.62 |
6.68
5.90 |
20.64
13.63 |
10.63
8.39 |
83.71
64.84 |
11.37
10.98 |
| Canny ws=3
γ=1.6 ws=5 |
16.96
14.24 |
8.18
4.32 |
12.49
10.93 |
9.54
5.29 |
77.22
71.94 |
10.57
8.02 |
| Gradient of gaussian ws=3
σ=l. ws=5 |
19.31
12.04 |
6.18
6.36 |
15.79
9.91 |
8.32
6.61 |
79.89
67.86 |
9.53
8.57 |
V. 2 Moment-based detection and ray tracing technique
The previous operators have been implemented within a ray tracing framework. The simplest way to search for an intersection between the rays and an object remains the thresholding technique. However, a better determination of the surface location could lead to significant improvements for quantitative image study. The results are reported in Table IV, where only the gray level gradient and the moment operator are compared with the analytical solution (the other operators exhibit a same behavior). It can be seen that a high precision is obtained. The RMS error is less than 0.4 and 0.2 for spherical and planar surfaces respectively.
Table IV.
Comparison of surface location estimation with the analytical solution (window size = 5) using ray tracing technique.
| Operators ws=5 | Sphere | Plane | Truncated sphere | |||
|---|---|---|---|---|---|---|
| Max | RMS | Max | RMS | Max | RMS | |
| Moments | 0.849 | 0.365 | 0.310 | 0.187 | 1.172 | 0.291 |
| Gray level gradient | 2.858 | 0.881 | 0.500 | 0.307 | 2.858 | 0.694 |
Image 2a (moment) and Image 2b (gradient) display the resulting 3D rendering by means of ray tracing. The histogram of surface location errors shows different modes due to the spatial sampling effect related to the plane orientation. These images confirm the better performance of the moment approach. Its application to real data leads to enhance small details and structures. The first example (Image 3) depicts an isotropic database (resolution 128×128×136, 8 bits) corresponding to an excised heart provided by the Mayo Clinic. The rendering gives a better view of the vessels lying on the muscle surface as well as an improved detection of the thin structures at the upper part of the heart when compared to the gradient application (Image 3a). The second example is shown Image 4. The test has been performed on MRI data with a resolution 256×256×109, 8-bits voxels. In this example, the cortex has been previously segmented by making use of classical region growing technique. It is rendered with a moment based surface normal estimation. The window is linearly interpolated by a factor of 2 to provide a clear view of the small details of the gyri which are enhanced by means of the moment based operator. The integrative feature of the moment operator increases the robustness to noise.
Image 2.
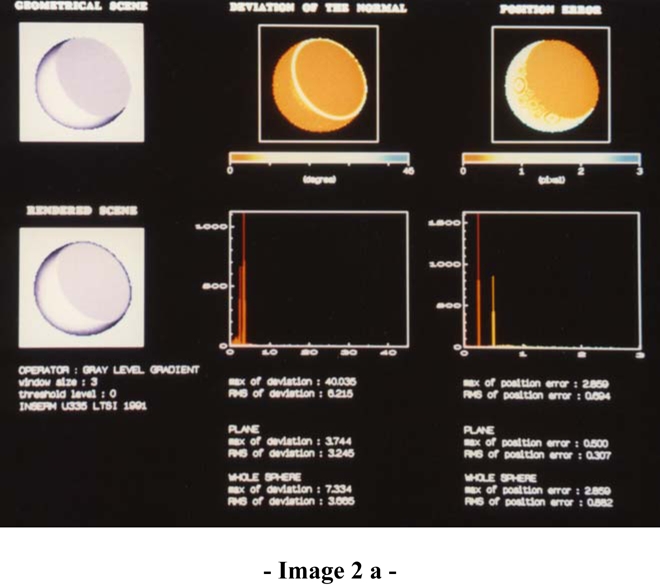

Surface normal and position errors using the moment-based operator (a) and the gray level gradient (b) implemented on the ray tracing technique. Upper left: Rendering from the analytical model. Below left: Surface display with the estimated normals. Upper middle: Deviations of the surface normals. Below middle: Histogram of the deviation. Upper right: Errors on the surface position. Below right: Histogram of the position errors.
Image 3.
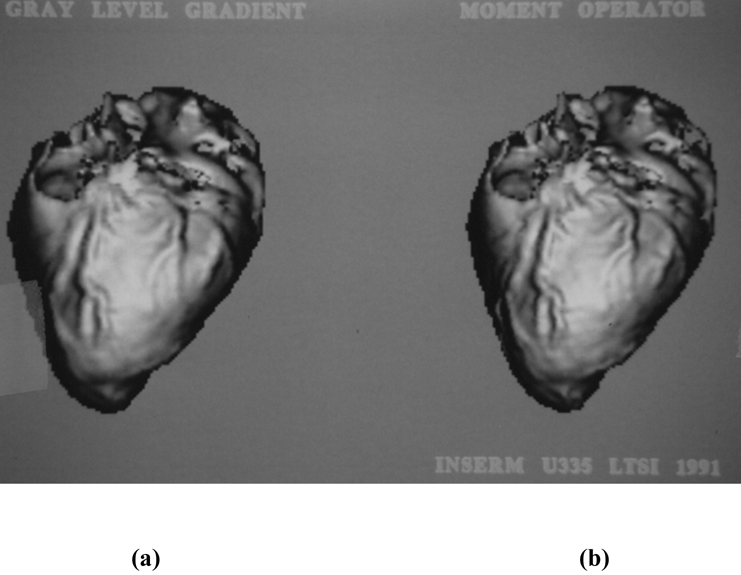
3D heart rendering with the gray level gradient (a) and the moment-based operator (b).
Image 4.
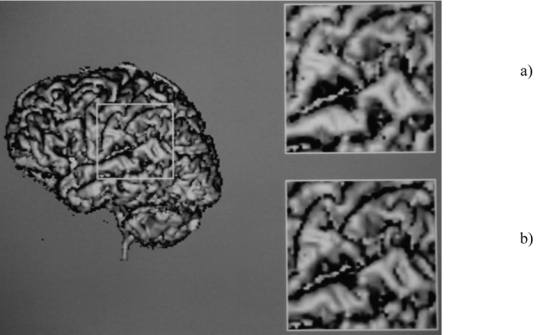
3D cortex rendering and a zoom window with the gray level gradient (a) and the moment-based operator (b).
These results show the benefits that can be expected by using the moment-based operator. The efficient and accurate detection of surfaces is required to produce high fidelity renderings of anatomical structures. Even if ideal processing is not feasible, since the acquisition device may loose some medically relevant information, it must preserve as much as possible the features of interest. Usual inspection by means of 3D display is not the ultimate goal and a number of works emphasize the need to increase the efficacy of quantification.
Of course a compromise has to be found between display quality, resolution, accuracy and processing speed according to the medical applications [25]. The method described in this paper could bring some improvements in these areas. Low and high resolution (e.g. low and high fidelity) images based on the moment-based approach can be combined to speed up the overall process (observer view point selection, rough and fine grain detection).
The influences of spatial sampling, noise, window size and primitive surface properties have been considered. Up to now, it has been assumed that the voxel were cubic. In medical practice, due to the limitations of image modalities, the spatial resolution in the axial direction may be lower than within the cross sections. In order to recover an isotropic description, a preprocessing, i.e. interpolation is carried out. It has been shown that this interpolation can also be performed “on the fly” when using a ray tracing scheme to render the data [26]. The non cubic voxel case can be directly handled within the moment based method. The corresponding masks result from integration over the spherical region sampled onto a rectangular grid. Today, however, many efforts are devoted to a direct isotropic 3D reconstruction of the organs in X-Ray and ultrasound devices. Single Photon Emission Tomography (SPET) and Magnetic Resonance Imaging (MRI) already have the capability to provide uniformly sampled volumes.
VI CONCLUSION
The need of efficient and accurate edge operators has been emphasized for a long time in medical imaging. The three-dimensional moment-based approach provides a subvoxel precision for the surface location and can improve the surface normal estimation. Its integrative nature allows to obtain a good behavior on noisy data. The tests performed on simulated and real data show that a better rendering can be achieved in 3D. It enhances small morphological surface changes and offers a suitable way to carry out qualitative and quantitative tissue studies.
References
- 1.Coatrieux JL, Toumoulin C, Hamon C, Luo LM. Future trends in 3D medical imaging. IEEE Eng Biol Magazine. 1990;9(4):33–39. doi: 10.1109/51.105216. [DOI] [PubMed] [Google Scholar]
- 2.Rosenfeld A, Kak A. Digital Picture Processing. Academic Press; New York: 1982. [Google Scholar]
- 3.Reeves AP, et al. A moment based two-dimensional edge operator. Proc IEEE Comput Vision & Patt Recogn. 1983:312–317. [Google Scholar]
- 4.Haralick RM. The digital step edge from zero crossings of second directional derivatives. IEEE PAMI. 1984;6(1):58–68. doi: 10.1109/tpami.1984.4767475. [DOI] [PubMed] [Google Scholar]
- 5.Canny JF. A computational approach to edge detection. IEEE PAMI. 1986;8(6):679–698. [PubMed] [Google Scholar]
- 6.Marr D, Hildreth EC. Theory of edge detection. Proc Roy Soc London, B. 1980;207:187–217. doi: 10.1098/rspb.1980.0020. [DOI] [PubMed] [Google Scholar]
- 7.Shen J. An optimal linear operator for edge detection. Proc IEEE Comput Vision & Patt Recogn. 1987 [Google Scholar]
- 8.Zucker SW, Hummel RA. A three-dimensional edge operator. IEEE PAMI. 1981;3(3):324–331. doi: 10.1109/tpami.1981.4767105. [DOI] [PubMed] [Google Scholar]
- 9.Morgenthaler DG, Rosenfeld A. Multidimensional edge detection by hypersurface fitting. IEEE PAMI. 1981 Jul;3(4):482–486. doi: 10.1109/tpami.1981.4767134. [DOI] [PubMed] [Google Scholar]
- 10.Bomans M, Höhne K, Tiede U, Riemer M. 3-D segmentation of MR Images of head for 3-D display. IEEE Trans Med Imaging. 1990;9(2):177–183. doi: 10.1109/42.56342. [DOI] [PubMed] [Google Scholar]
- 11.Liu HK. Two- and three-dimensional boundary detection. Computer Graphics and Image Processing. 1977;(6):123–134. [Google Scholar]
- 12.Udupa JK, Srihari SN, Herman GT. Boundary detection in multidimensions. IEEE PAMI. 1982;4(1):41–50. doi: 10.1109/tpami.1982.4767193. [DOI] [PubMed] [Google Scholar]
- 13.Luo LM. PhD thesis. Université de Rennes-I; 1986. Reconstruction tridimensionnelle en imagerie médicale à partir de coupes parallèles: application en imagerie Scanner-X et RMN. [Google Scholar]
- 14.Lyvers EP, Mitchell OR. Precision edge contrast and orientation estimation. IEEE PAMI. 1988;10(6):927–936. [Google Scholar]
- 15.Teh CH, Chin RT. On image analysis by the methods of moments. IEEE PAMI. 1988 Jul;10(4):496–513. [Google Scholar]
- 16.Lyvers EP, Mitchell OR, Akey ML, Reeves AP. Subpixel measurements using a moment-based edge operator. IEEE PAMI. 1989 Dec;11(12):1293–1309. [Google Scholar]
- 17.Papoulis A. Probability, random variables and stochastic processes. Mc Graw-Hill; 1965. [Google Scholar]
- 18.Gradshteyn TS, Ryzhik IW. Table of integrals series and products. Academic Press; 1965. [Google Scholar]
- 19.Hamitouche C. PhD thesis. Université de Rennes-I; 1991. Analyse d’images médicales tridimensionnelles: Application à l’extraction de structures anatomiques. [Google Scholar]
- 20.Barillot C, Gibaud B, Lis O, Luo LM, Bouliou A, Le Certen G, Collorec R, Coatrieux JL. Computer graphics in medicine: a survey. CRC Critical Reviews in Biomedical Engineering. 1988;15:269–307. [PubMed] [Google Scholar]
- 21.Canny JF. Techn Rep N° 720, MIT. 1983. Finding edges and lines in images. [Google Scholar]
- 22.Deriche R. Using Canny’s criteria to derive a recursively implemented optimal edge detector. International Journal of Computer Vision. 1987 May;1(2):167–187. [Google Scholar]
- 23.Udupa JK, Hung HM, Chuang KS. Surface and volume rendering in three dimensional Imaging: A comparison. Journal of digital Imaging. 1991;4:159–169. doi: 10.1007/BF03168161. [DOI] [PubMed] [Google Scholar]
- 24.Tiede U, Höhne KH, Bomans M, Pommert A, Riemer M, Wiebecke G. Investigation of medical 3D rendering algorithms. IEEE Comput Graph & Applic. 1990 Mar;:41–53. [Google Scholar]
- 25.Herman GT. A survey of 3D medical imaging techniques. IEEE Eng Med Biol Magazine. 1990;9(4):15–17. doi: 10.1109/51.105212. [DOI] [PubMed] [Google Scholar]
- 26.Dillenseger JL, Hamitouche C, Coatrieux JL. Visualisation d’images tridimensionnelles par lancer de rayons avec interpolation locale. Innov & Tech en Biol &Med. 1991;12(3):244–255. [Google Scholar]


