

Abstract
Oncomir-1 is an oncogenic cluster of microRNAs located on chromosome 13. Previous in vitro studies demonstrated that it is transcriptionally regulated by the transcription factor E2F3. In this report we combine expression profiling of both messenger RNA (mRNA) and micro RNAs (miRNA) in Wilms tumor (WT) samples to provide the first evidence that the E2F3—Oncomir 1 axis, previously identified in cell culture, is deregulated in primary human tumors. Analysis of RNA expression signatures demonstrated that an E2F3 gene signature was activated in all Wilms tumor samples analyzed, in contrast to other kidney tumors. This finding was validated by immunohistochemistry (IHC) on the protein level. Expression of E2F3 was lowest in early stage tumors, and highest in metastatic tissue. Expression profiling of miRNAs in WT showed that expression of each measured member of the Oncomir-1 family was highest in WT relative to other kidney tumor subtypes. Quantitative polymerase chain reaction (PCR) confirmed that these microRNAs were overexpressed in Wilms tumor relative to normal kidney tissue. These results suggest that the E2F3—Oncomir-1 axis is activated in Wilms tumor. Our study also demonstrates the utility of integrated genomics combining gene signature analysis with miRNA expression profiling to identify protein-miRNA interactions that are perturbed in disease states.
Keywords: Pediatric cancers, Gene expression profiling, Cancer genome anatomy: comparative expression patterns, Oncogenic transcription factors: leukemias/lymphomas/solid tumors
Introduction
Wilms tumor is associated with mutations and expression abnormalities in the transcription factor and putative tumor suppressor WT1. However, there has been a call for further investigation into other genes that participate in the development of Wilms tumor (WT) (1).
Here, we combined expression profiling of both messenger RNA (mRNA) and micro RNAs (miRNA) to identify expression patterns unique to WT. Microarray analysis is often plagued by poor signal to noise characteristics. We mitigated this challenge through the use of parametric gene set analysis (PGSEA). PGSEA increases the power of microarray expression analysis by analyzing sets of genes (curated from the literature) that have been empirically shown to change in expression in response to a defined stimulus. This approach has already been successfully employed by our laboratory in the context of adult renal tumors (2, 3).
Our results indicated that the E2F3 signature is strongly activated in WT samples—a phenomenon not consistently observed in other renal tumors. E2F3 is an activator of transcription that is amplified or over-expressed in several tumors, including those of the bladder (4), prostate (5) and lung (6). Interestingly, E2F3 has been demonstrated to drive the expression of Oncomir-1 in vitro (7). Oncomir-1 is an oncogenic cluster of microRNAs located on chromosome 13 that has been shown to play an important role in promoting tumor cell proliferation (8). Here, we demonstrate that both E2F3 and Oncomir-1 are overexpressed in vivo in WT. These results provide the first evidence that the E2F3—Oncomir-1 axis may be activated in a human tumor.
Materials and Methods
Tumor tissue samples
Gene expression was performed upon tissue specimens obtained from patients undergoing tumor resection at three collaborating institutions. Additional tissues were acquired from the Cooperative Human Tissue Network (CHTN). IHC validation of E2F3 protein expression was carried out using a Wilms tumor tissue microarray (TMA) assembled at the University of Chicago. For the TMA, 57 WT (39 primary and 18 metastatic) were identified along with corresponding clinicopathological data.
mRNA expression profiling
For each sample, mRNA was isolated by Trizol (Invitrogen, CA) extraction. Gene expression profiles were then generated using the Affymetrix HG-U133 Plus 2.0 GeneChip from 27 Wilms tumor samples, 10 clear cell renal cell carcinoma (CCRCC) samples, 6 chromophobe RCC samples, 7 oncocytoma samples, 17 papillary RCC samples and 12 samples of normal kidney tissue. Prior to data processing, probe set mappings were updated as described (9). Microarray data was uploaded to the Gene Expression Omnibus database, accession number GSE11024. Myc, E2F, SRC, RAS, b-catenin, synergistic HGF/VEGF, and Von Hippel-Lindau (VHL) gene signatures were obtained from the literature as previously described (3). HGF and VEGF signatures were generated using data from the Gene Expression Omnibus (GDS406 and GDS495, respectively). In addition, we analyzed a hypoxia gene signature obtained from the literature (10), and an angiogenesis gene set generated by our group.
PGSEA was applied to identify up- or down-regulated expression signatures in each sample (3, 11-13). The resulting dataset summarizing the relative up or down regulation of each pathway for each sample was then processed using the Limma Bioconductor package (14) to identify pathways whose expression was differentially expressed compared to normal kidney tissue. P-values for the Limma analysis were adjusted to control the false discovery rate at 5% (15).
Quantitative RT-PCR analysis of E2F3 isoforms
First-strand synthesis for each mRNA sample was performed using oligo(dT)18 primer and the High Capacity cDNA Archive kit (Applied Biosystems, CA). For each sample, 1 ug of total RNA was reverse transcribed into cDNA. For miRNA assays, 10 ng of total RNA was reverse transcribed using a sequence specific primer provided with the miRNA TaqMan assay (Applied Biosystems). Quantitative polymerase chain reaction (PCR) analysis was performed using TaqMan assays. The commercially available Taqman gene expression assay Hs01076037_m1, which spans the exon 1−2 boundary of E2F3a, was used to measure E2F3a levels. A custom TaqMan assay was designed to quantify E2F3b levels using forward primer TGCTTTCGGAAATGCCCTTACA, reverse primer GATGACCGCTTTCTCCTAGCT, and probe sequence CTTCGCTTTGCCTGCTGC. Expression levels were normalized to GAPDH levels (using Taqman gene expression assay Hs99999905_m1) by the delta-delta Ct method.
Immunohistochemistry (IHC)
Mouse anti-human E2F3 monoclonal antibody to E2F3 was purchased from Upstate UK (Park Leys, Botolph Claydon, Buckinghamshire, Cat 05−551) and diluted 1:100 in antibody diluent. Sections of the Wilms TMA were obtained at 4 micrometer thickness, transferred to slides, deparaffinized and rehydrated in the usual manner. Endogenous peroxidase was blocked with 3% H202. Microwave antigen retrieval was performed by boiling the sections 10mM EDTA buffer (pH 9.0) at low power for 12 minutes. After rinsing, sections were incubated with the primary antibody for 40 minutes at room temperature, and washed with Tris-buffered saline (TBS, 0.05 M Tris, 0.12 M sodium chloride, 0.05% Tween 20, pH 7.6). This step was followed by 30 minutes incubation with goat anti-mouse IgG conjugated to a horseradish peroxidase labeled polymer (EnVisionTM+, DAKO). Slides were then developed for 5 min with 3−3’-diaminobenzidine (DAB) chromogen, and counterstained with hematoxylin. To assess proliferating cells, we used Ki67 marker (clone Ki-S5, 1:50 dilution, DAKO) in a similar fashion. Negative controls were performed by substituting primary antibody with non-immune mouse immunoglobulins. Nuclear expression of E2F3 and Ki67 was quantified by using Automated Cellular Imaging System (Clarient, CA). The percentage of cells with positive staining were determined for each tissue core by a trained pathologist (MT) as described previously (16).
miRNA expression profiling
MicroRNA was isolated using the mirVana extraction kit (Ambion). Expression levels relative to pooled normal kidney miRNA were measured by microarray analysis performed by LC Sciences as described elsewhere (17). We compared the miRNA expression of WT samples to miRNA expression data for CCRCC and papillary RCC described in a separate report (17). Microarray data was uploaded to the Gene Expression Omnibus database, accession number GSE11016. Genes that were overexpressed in WT relative to other kidney tumor subtypes were identified by Kolmogorov Smirnov (KS) rank sum analysis (18).
Oncomir-1 expression levels were validated by quantitative RT-PCR, using commercial Taqman assays targeting human mir-17−5p, mir-18a, mir-19b, mir-20a, and mir-92. Expression levels of the miRNAs were normalized to the average expression of three endogenous controls, RNU6B, RNU49, and U47, using the corresponding TaqMan assays.
Results & Discussion
WT samples exhibit unique gene expression patterns as compared to other renal tumors
Unsupervised hierarchical clustering of genome-wide expression data revealed that WT specimens are more similar to each other in terms of gene expression than to other common types of kidney tumor or normal kidney tissue (Figure 1A). PGSEA was then employed in order to identify which biologically defined expression signatures are responsible for this unique gene expression pattern. Of the 11 malignancy-related pathways analyzed, two were identified whose expression deviated significantly from that of normal kidney tissue after p-value correction—those related to E2F3 and Ras, the more significant of which was E2F3. As shown in Figure 1B, PGSEA revealed that a set of genes previously identified as being upregulated by E2F3 in vitro was also upregulated in WT tumors relative to normal tissue. Consistent up-regulation of the E2F3 gene expression signature was unique to WT as compared to other renal tumors (Figure 1B).
Figure 1.

Gene expression profiling of WT samples and other kidney tumor subtypes. A. Unsupervised hierarchical average linkage clustering of global gene expression of WT samples compared to other renal tumor subtypes. B. PGSEA analysis of WT gene expression patterns. The E2F3 signature was upregulated in all WT samples, in contrast to other kidney tumor subtypes. Enrichment score represents a weighted t-test for the expression of all the genes in the signature for each sample relative to the global mean of those genes in normal kidney samples. As a control, the VHL deactivation signature is also shown. As expected, this signature is overexpressed in CCRCC samples, but not in WT samples. C. Quantitative RT-PCR analysis of expression levels of E2F3a and E2F3b levels in WT samples. Data is normalized to CCRCC to remove proliferation artifacts.
As a control for our analytic approach, we also assessed the expression of genes that were down-regulated by VHL in vitro. As expected, the VHL de-repression signature is evident in the CCRCC samples. As these are features unique to the CCRCC subtype, we expected that these changes would not be evident in the WT samples, and this was indeed confirmed.
The E2F3a isoform is preferentially upregulated in Wilms Tumor tissue
E2F3 has two isoforms—E2F3a and E2F3b—that have different first exons and are believed to be driven by different promoters. The relative mRNA expression of these two isoforms was quantified by quantitative RT-PCR. E2F3a and E2F3b expression in the Wilms Tumor sample was normalized to the mean expression of these isoforms in CCRCC samples. E2F3 is known to be regulated in a cell cycle dependant fashion. Therefore, it may be somewhat overexpressed in a non-specific fashion simply due to the relatively elevated rate of proliferation exhibited by tumor tissue. To control for this non-specific effect, we chose clear cell RCC samples as controls for this analysis as opposed to less-proliferative normal tissue. The expression of E2F3a in Wilms Tumor samples was on average 8 fold higher than in clear cell samples, where as the expression of E2F3b in Wilms Tumor samples was only 1.7 fold higher (Figure 1C), and this difference was significant by t-test (p = 0.01).
These findings demonstrate that in contrast to the evidence in bladder tumors, E2F3a appears to be preferentially upregulated in WT specimens (19).
E2F3 protein is overexpressed in Wilms Tumor, and exhibits nuclear localization
IHC was performed on a Wilms tumor tissue array to confirm that the E2F3 activation apparent from gene expression data corresponded to an increase in E2F3 protein expression. Normal kidney tissue exhibited limited or no E2F3 positivity by IHC, with the exception of medullary tissue which exhibited moderate positivity in some cells. Where present in normal tissue, the E2F3 staining was confined to the cytoplasm (Figure 2A). By contrast, WT tissue exhibits E2F3 expression localized to the nucleus.
Figure 2.
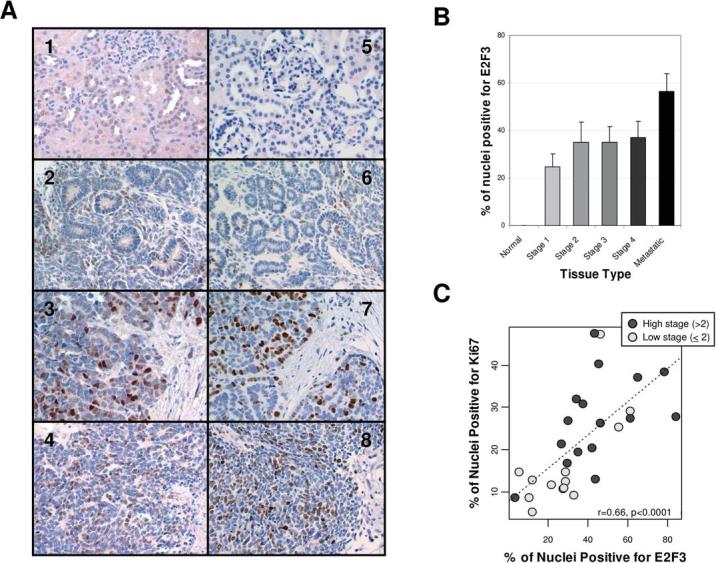
E2F3 protein expression in WT samples. A. Immunohistochemical analysis of E2F3 expression (subpanels 1−4) and Ki67 expression (subpanels 5−8). Subpanels 1 and 5 are normal kidney tissue. Subpanels 2 and 6 are sections from a low grade tumor, subpanels 3 and 7 are sections from a high grade tubular subtype WT, and subpanels 4 and 8 are sections from a high grade meduloblastic subtype WT. B. Quantitative counts of E2F3 positive nuclei by tumor grade. C. Quantitative counts of E2F3 positive nuclei vs. Ki67 positive nuclei.
E2F3 protein expression correlates with cell proliferation and is highest in metastatic tissue
No E2F3 positive nuclei were detected in the normal kidney samples, whereas up to 85% of nuclei were identified as E2F3 positive in tumor tissue, with the highest proportions of positive nuclei being found in high grade tumors and metastatic lesions (Figure 2B). These samples were also stained for Ki67 as a marker of cellular proliferation. The proportion of E2F3 positive nuclei was correlated with the proportion of Ki67 positive nuclei in these samples (r=0.66, p<0.0001, Figure 2C).
These results indicate that E2F3—previously known to be upregulated in bladder (4), prostate (5), and lung tumors (6)—is overexpressed on the mRNA and protein levels in WT. Its expression is highest in metastatic tissue, though it is unclear whether this is functionally related to the process of metastasis.
Oncomir-1, a regulatory target of E2F3, is also overexpressed in Wilms Tumor cells
Woods et al. have previously shown that E2F3 drives the expression of an oncogenic cluster of miRNAs termed Oncomir-1 (3). Therefore, we hypothesized that the E2F3 overexpression observed in our WT samples may also be associated with Oncomir-1 overexpression. We examined the expression of members of the Oncomir-1 in microRNA profiles generated by the laboratory.
First, unsupervised clustering of our microRNA data was performed to verify quality of the data. All the WT samples clustered together as compared to other types of renal tumors, based on global miRNA expression (Figure 3A). We then performed KS rank-sum analysis to identify those miRNAs that were uniquely overexpressed in WT samples relative to other subtypes. Consistent with our hypothesis, out of the five Oncomir-1 members assayed on the miRNA microarray, three were in the top 20 miRNAs uniquely overexpressed by WT (Table 1). For each of the five miRNAs of the Oncomir-1 members assayed on the miRNA microarray, the highest expression was observed among the WT samples (Figure 3B) as compared to other renal tumor subtypes.
Figure 3.
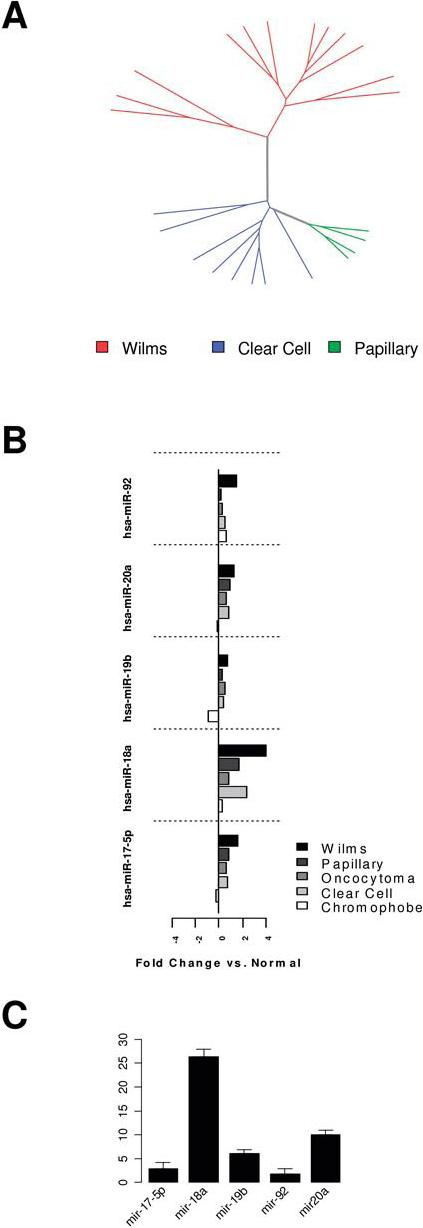
MicroRNA expression profiling of WT samples and other kidney tumor subtypes. A. Unsupervised hierarchical average linkage clustering of global miRNA expression of WT samples compared to other renal tumor subtypes. B. Expression levels of five members of the Oncomir-1 family of miRNAs as measured by microarray, by tumor type. For each member of the Oncomir-1 family, the highest expression as quantified by microarray was observed in Wilms tumor. C. Quantitative RT-PCR validation of expression levels of Oncomir-1 family members relative to normal kidney tissue.
Table 1.
List of microRNAs most over-expressed in WT samples relative to all other kidney tumor subtypes examined. Members of the Oncomir-1 family are in bold.
| Micro RNA | KS Score |
|---|---|
| mir-130a | 32.00 |
| mir-335 | 30.48 |
| mir-93 | 29.33 |
| mir-324−5p | 27.73 |
| mir-99b | 27.20 |
| mir-92 | 26.67 |
| mir-181b | 26.13 |
| mir-103 | 24.00 |
| mir-107 | 24.00 |
| mir-10b | 24.00 |
| mir-214 | 24.00 |
| mir-181a | 23.47 |
| mir-320 | 22.40 |
| mir-130b | 22.40 |
| mir-331 | 22.40 |
| mir-106a | 22.40 |
| mir-17−5p | 22.40 |
| mir-181d | 22.40 |
| mir-199a | 21.33 |
| mir-20a | 20.80 |
The gene expression data was validated by quantitative RT-PCR of five members of the Oncomir-1 family from Wilms tumor samples. Consistent with the microarray results, each of these miRNAs was overexpressed between 2 and 25 fold in Wilms tumor samples compared to normal tissue (p<0.05 for each miRNA).
Oncomir-1 has previously shown to promote proliferation in tumor cells (8), and Woods et al. (7) have demonstrated in vitro that its expression is positively regulated by E2F3. Our results providee the first data that this E2F3—Oncomir-1 axis is activated in a human tumor.
Conclusions
In this study we have integrated PGSEA analysis of mRNA expression data with miRNA expression profiling to identify novel features of WT. While the body of literature describing abnormalities in miRNA expression in cancer is rapidly growing, much remains to be determined about both the upstream causes and the downstream consequences of the miRNA abnormalities. We are confident that integration of mRNA and miRNA expression profiling will be a useful tool in elucidating these relationships, such as the activation of the E2F3—Oncomir-1 axis we have observed in WT.
Acknowledgements
The corresponding author gratefully acknowledges the generosity of the Van Andel Family, The Gerber Foundation, and the Hauenstein Foundation for their support on this project. We thank the Karolinska Institute & the Cooperative Human Tissue Network (CHTN) of the National Cancer Institute for providing samples. This work was supported in part by NIH grant HD046377-01A1 supporting E.J.K. We thank Sabrina Noyes for administrative support.
Abbreviations
- WT
Wilms Tumor
- PGSEA
Parametric Gene Set Enrichment Analysis
- miRNA
microRNA
- TMA
Tissue Microarray
References
- 1.Phillips JL, Hayward SW, Wang Y, et al. The consequences of chromosomal aneuploidy on gene expression profiles in a cell line model for prostate carcinogenesis. Cancer Res. 2001;61:8143–9. [PubMed] [Google Scholar]
- 2.Furge KA, Kort EJ, Yang XJ, Stadler WM, Kim H, Teh BT. Gene expression profiling in kidney cancer: combining differential expression and chromosomal and pathway analyses. Clinical genitourinary cancer. 2006;5:227–31. doi: 10.3816/CGC.2006.n.041. [DOI] [PubMed] [Google Scholar]
- 3.Furge KA, Cheng J, Koeman J, et al. Detection of DNA-copy number changes and oncogenic signaling abnormalities from gene expression data reveals MYC activation in high-grade papillary renal cell carcinoma. Cancer Res. 2007 doi: 10.1158/0008-5472.CAN-06-4571. In Press. [DOI] [PubMed] [Google Scholar]
- 4.Feber A, Clark J, Goodwin G, et al. Amplification and overexpression of E2F3 in human bladder cancer. Oncogene. 2004;23:1627–30. doi: 10.1038/sj.onc.1207274. [DOI] [PubMed] [Google Scholar]
- 5.Foster CS, Falconer A, Dodson AR, et al. Transcription factor E2F3 overexpressed in prostate cancer independently predicts clinical outcome. Oncogene. 2004;23:5871–9. doi: 10.1038/sj.onc.1207800. [DOI] [PubMed] [Google Scholar]
- 6.Cooper CS, Nicholson AG, Foster C, et al. Nuclear overexpression of the E2F3 transcription factor in human lung cancer. Lung cancer (Amsterdam, Netherlands) 2006;54:155–62. doi: 10.1016/j.lungcan.2006.07.005. [DOI] [PubMed] [Google Scholar]
- 7.Woods K, Thomson JM, Hammond SM. Direct regulation of an oncogenic micro-RNA cluster by E2F transcription factors. The Journal of biological chemistry. 2007;282:2130–4. doi: 10.1074/jbc.C600252200. [DOI] [PubMed] [Google Scholar]
- 8.Hayashita Y, Osada H, Tatematsu Y, et al. A polycistronic microRNA cluster, miR-17−92, is overexpressed in human lung cancers and enhances cell proliferation. Cancer Res. 2005;65:9628–32. doi: 10.1158/0008-5472.CAN-05-2352. [DOI] [PubMed] [Google Scholar]
- 9.Dai M, Wang P, Boyd AD, et al. Evolving gene/transcript definitions significantly alter the interpretation of GeneChip data. Nucleic Acids Res. 2005;33:e175. doi: 10.1093/nar/gni179. [DOI] [PMC free article] [PubMed] [Google Scholar]
- 10.Chi JT, Wang Z, Nuyten DS, et al. Gene Expression Programs in Response to Hypoxia: Cell Type Specificity and Prognostic Significance in Human Cancers. PLoS Med. 2006;3:e47. doi: 10.1371/journal.pmed.0030047. [DOI] [PMC free article] [PubMed] [Google Scholar]
- 11.Crawley JJ, Furge KA. Identification of frequent cytogenetic aberrations in hepatocellular carcinoma using gene expression data. Genome Biol. 2002;3:RESEARCH0075. doi: 10.1186/gb-2002-3-12-research0075. [DOI] [PMC free article] [PubMed] [Google Scholar]
- 12.Lindvall C, Furge KA, Bjorkholm M, et al. Combined genetic- and transcriptional profiling of acute myeloid leukemia with complex and normal karyotypes. Haematologia. 2004;89:1072–81. [PubMed] [Google Scholar]
- 13.Kim S, Volsky DJ. PAGE: Parametric Analysis of Gene Set Enrichment. BMC Bioinformatics. 2005;6:144. doi: 10.1186/1471-2105-6-144. [DOI] [PMC free article] [PubMed] [Google Scholar]
- 14.Smyth GK. Linear models and empirical bayes methods for assessing differential expression in microarray experiments. Statistical applications in genetics and molecular biology [electronic resource] 2004;3:Article3. doi: 10.2202/1544-6115.1027. [DOI] [PubMed] [Google Scholar]
- 15.Benjamini Y, Hochberg Y. Controlling the False Discovery Rate: A Practical and Powerful Approach to Multiple Testing. J Roy Stat Soc B. 1995;57:289–300. [Google Scholar]
- 16.Tretiakova M, Turkyilmaz M, Grushko T, et al. Topoisomerase IIalpha in Wilms' tumour: gene alterations and immunoexpression. J Clin Pathol. 2006;59:1272–7. doi: 10.1136/jcp.2005.031963. [DOI] [PMC free article] [PubMed] [Google Scholar]
- 17.Petillo D, Kort EJ, Teh B. MicroRNA profiling of Human Kidney Cancer Subtypes. 2008 doi: 10.3892/ijo_00000318. Submitted. [DOI] [PubMed] [Google Scholar]
- 18.Sandberg R, Ernberg I. Assessment of tumor characteristic gene expression in cell lines using a tissue similarity index (TSI). Proc Natl Acad Sci U S A. 2005;102:2052–7. doi: 10.1073/pnas.0408105102. [DOI] [PMC free article] [PubMed] [Google Scholar]
- 19.Hurst CD, Tomlinson DC, Williams SV, Platt FM, Knowles MA. Inactivation of the Rb pathway and overexpression of both isoforms of E2F3 are obligate events in bladder tumours with 6p22 amplification. Oncogene. 2007 doi: 10.1038/sj.onc.1210934. [DOI] [PMC free article] [PubMed] [Google Scholar]