Abstract
Finite element models of otoconia membrane (OM) were developed to investigate the effects of three geometric variables on static and modal response of the OM: (1) curvature of the macular surface, (2) spatial variation in thicknesses of three OM layers, and (3) shape of the macular perimeter. A geometrically accurate model of a turtle utricle was constructed from confocal images. Modifying values for each variable formed variants of this model: modeling the macula surface as flat, OM layer thicknesses as spatially invariant, and the macular perimeter as a rectangle. Static tests were performed on each modified OM model, and the results were compared to determine the effects of each geometric variable on static mechanical gain (deflection per unit acceleration). Results indicate that all three geometric variables affect the magnitude and directional properties of OM static mechanical gain. In addition, through modal analysis, we determined the natural frequencies and displacement modes of each model, which illustrate the effects of the three geometric variables on OM dynamics. This study indicates the importance of considering three-dimensional OM geometry when attempting to understand responses of the OM and, therefore, the modulation of hair cell signals to accelerations during head movements.
Keywords: utricle, finite element model, static mechanical gain, modal analysis
1. Introduction
The otoconial organs of vertebrates are dynamic as well as static sensors. They transduce linear acceleration and head tilt. The utricle, one of these otoconial organs, has a neuroepithelium containing the cell bodies of hair cell receptors. Each hair cell bears a hair bundle, composed of multiple stereocilia and a single kinocilium, on its apical surface. These hair bundles contact a complex gelatinous structure, the otoconial membrane (OM), which overlies the upper surface of the neuroepithelium (macula). The OM, in turn, is comprised of three layers (Fig. 1a): an otoconial layer (OL), a compact gel layer (GL), and a column filament layer (CFL). Accelerations and gravity act on the higher density OL, shearing the CFL and GL with a magnitude of displacement that is proportional to the component of the acceleration vector in the plane of the otoconial organ (actually the component of the vector sum of acceleration and gravity or gravitoinertial vector). Shearing of the CFL and GL (Fig. 1b) displaces the hair cell bundles. The hair cells then translate bundle displacement into receptor potentials that modulate neural signals to the central nervous system.
Fig. 1.
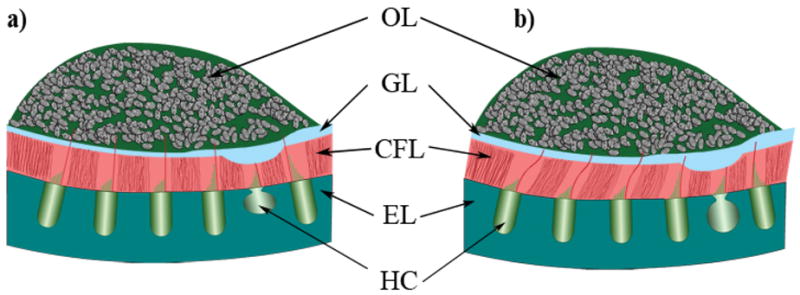
Schematic cross section of the layered structure of a utricular organ. This is a representative diagram of the layered structure in the lateral-medial transect of the utricle. From the top down, the layers are labeled: OL for the otoconial layer; GL for the compact Gel Layer; CFL for the Column Filament Layer; and EL for the Epithelial Layer. Also indicated in this figure are Hair Cells (HC), which reside in the epithelial layer. Figure 1a) shows an undeformed state with lateral to the right and medial to the left. Figure 1b) shows a deformed state of the utricle as the otoconial layer shears the column filament and compact gel layers. The striolar region is indicated here with the thickest GL and thinnest CFL. The striolar region also encompasses the line of polarity reversal.
Initially, otoconial organs were mathematically modeled as flat bodies with uniform OM layers, usually ignoring three-dimensional geometry in favor of two or even one-dimensional models [5, 17, 22]. The first model to describe the motion of an OM was a 2nd order lumped parameter model [5]. Studying the otoconial organs of a fish statically and dynamically, this model was used to estimate the stiffness of the OM-bundle complex in each otoconial organ (utricle, saccule and lagena) with a static test, and damping in the saccule with a dynamic test. Dynamic measurements for the saccule were deemed more reliable than those for the utricle and lagena due to larger displacements in the saccule.
The utricle has also been modeled as having a flat neuroepithelium, a single-layered OM, and a curved OL perimeter [17]. The OL perimeter, when seen from a top view, defines the perimeter of the utricular macula. Single fiber discharge rates from a utricle in response to static pitch (i.e. nose up and nose down) and roll (i.e., side up and side down) rotations, observed by Lowenstein and Roberts [25], were qualitatively matched in the gel layer deflections in this finite difference model: thus implying a connection between gel layer deflection and response of the hair cells in the utricle.
Distributed parameter dynamic OM models were developed that included the viscoelastic effects of the CFL and GL, viscosity of the surrounding endolymph, and buoyancy effects on the OL [13, 14, 16]. Treating the OM as a single degree of freedom model with uniform OM layer thicknesses and a neuroepithelium and OL that were flat and rigid, the full analytical partial differential equations describing its dynamic behavior were derived and solved. This analytical time domain solution was later transformed into the frequency domain so that different response-stimulation relationships could be investigated [15].
It was not until 2000, that material properties were determined from experiments on the bullfrog saccule. The CFL and GL from a bullfrog saccule were represented with a parallelepiped finite element (FE) model that considered separate but uniformly thick OM layers [21]. Displacements in this FE model were compared with the experimentally measured OM deflections from tests performed by Benser et al. [2]. The results of this comparison yielded Young’s moduli of the CFL (E=250 Pa) and GL (E=6.6 kPa) for the bullfrog saccule. A curved macular perimeter was later considered in an FE model of a guinea pig utricle; however, curvature of the macular surface and varying thicknesses of the individual OM layers were not included [22].
More recently, macular curvature of otoconial organs has been considered [18, 19]. While still modeling uniformly thick OM layers, these models of a human utricle and saccule are the first to include curvature of the macular surface. Curvature in a small region of the macular surface (300 μm length × 300 μm width) with uniformly thick OM layers above the curved macula was considered in Jaeger et al.’s [18] work. They concluded that local curvature of the macular surface reduces the amplitude of displacement within the organ over the frequency range investigated. These models of the utricle and saccule did not consider curvature of the whole macular surface.
The objective of this study is to analyze the effects of three-dimensional macular and OM geometry on the global and regional response of the OM to linear accelerations, such as those that are generated by head movements and gravity. It is important to understand these phenomena because macular and OM geometry influence the deflection and therefore stimulation of hair bundles. We investigate the influence of three geometric variables on displacements in the OM: 1) curvature of the macular surface, 2) varying thickness of the OM layers, and 3) macular perimeter (estimated from the perimeter of the OL as seen from above). We developed a detailed FE model of a turtle utricle directly from confocal images, and modified the model to investigate the effects of changing these three geometric variables.
We show in this study that including such geometric details can affect how the OM deforms in shear and, therefore, can affect the stimulus applied to hair cell bundles. The results of changing the geometry are manifest in the static and modal response of the OM models. Statically, we see effects on the magnitude of OM static mechanical gain, and on its maximum and minimum deflection directions. The effects of these geometric variables are observed in changes to the modal response: natural frequencies and displacement modes.
2. Methods
2.1 Specimen Preparation
We used utricles from two turtles (carapace lengths 4.74 and 5.5 inches) to quantify dimensions of the otoconial membranes. We sacrificed turtles via intramuscular injection of 0.5 ml Euthasol followed by intracardiac perfusion. We followed the guidelines of the Ohio University Animal Care and Use Committee in all experiments. Otoconial membranes are bathed in artificial endolymph in vivo. To retain as closely as possible the in vivo condition, we used 0.065 mM CaCl2 artificial endolymph (AE) in all stages of tissue processing (KCl: 140 mM; CaCl2: 0.065 mM; K-HEPES: 5 mM; Glucose: 4 mM; adjusted to pH 7.4 with HCl; [4]). Following a brief intracardiac rinse with AE, we perfused turtles for 30 minutes with formaldehyde solution (170 ml AE with 40 ml 37% formaldehyde), bisected the head, exposed the labyrinth, and immersed it in this fixative overnight.
We prepared one utricle as a whole-mount (Fig. 2). Following overnight fixation, we removed the utricle, pinned it in a dish filled with AE, opened the vestibule, and removed the falx that overlies the lateral macula [7]. We visualized otoconial membranes by staining them for 3 days using wheat germ agglutinin (WGA) conjugated to Oregon Green 488 (Molecular Probes; 0.1 mg in 1 ml AE).
Fig. 2.
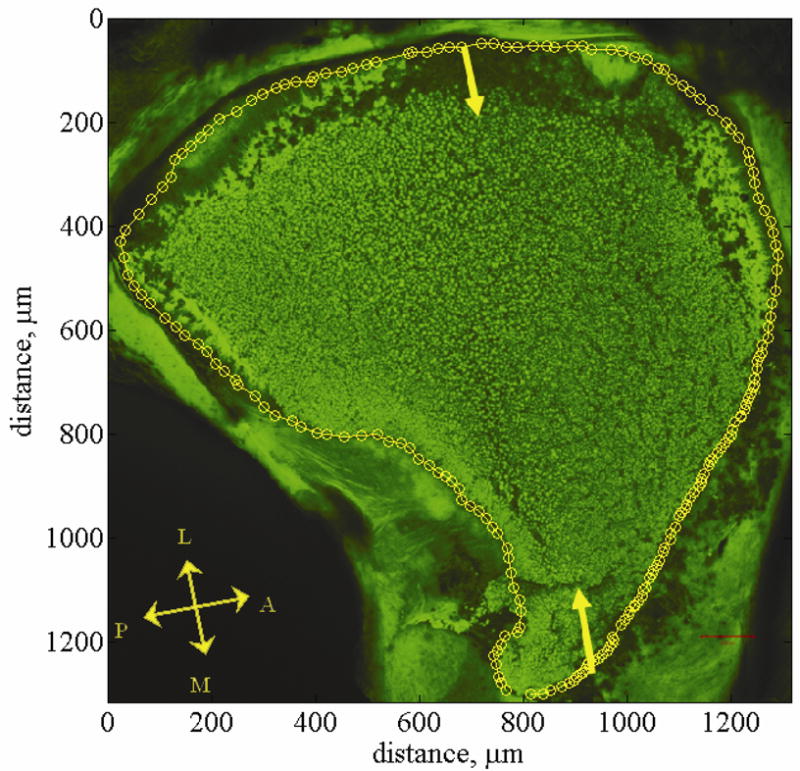
Utriclar whole-mount. This figure shows a confocal image of a utriclar whole-mount [34]. This whole-mount provides a top down view of the left utricle. The falx overlying the lateral macula is removed but the otoconial layer left in tact. The otoconial layer is stained green using WGA. Yellow arrows indicate the lateral-medial transect. Yellow circles indicate the outline of the macular surface. This outline is called the macular perimeter. The macular perimeter is used as a guideline for placement of cross sections in model generation. Anatomical directions are indicated with the double headed arrows. The letters L, M, A, and P indicate the Lateral, Medial, Anterior, and Posterior directions respectively. The striola is a region about 75 microns wide and starts about 100 microns in from the lateral edge. It is arched from anterior to posterior following the curve of the lateral edge of the utricle. The lateral extrastriolar region is lateral to this arched region. The medial extrastriola region is medial to this arched region.
2.2 In Vivo Dimensions
We used two strategies to ensure that measurements reflect in vivo conditions as closely as possible. First, our tissue was fixed with formaldehyde but not dehydrated. Aldehyde fixation alone causes no significant dimensional changes in auditory tectorial structures [6]. Second, our tissue was only exposed to appropriate electrolites with correct osmotic concentrations, at the proper pH: artificial turtle endolymph with 65mM Ca2+ at physiological pH [4]. This is important because inappropriate concentrations, especially elevated calcium concentrations or extreme pH levels, can cause swelling or shrinkage of tectorial structures in several vertebrates including reptiles [9–11, 32].
2.3 Imaging
We used utricular slices to visualize macular curvature and to measure the thickness of the three otoconial membrane layers. We removed both utricles from one turtle and embedded them using 4% low melting point agarose (Bio Rad) in AE. We sliced the left utricle in the plane designated by yellow arrows in Fig. 2. This slice is called the lateral-medial (LM) transect (Fig. 3). Measurements of otoconial membrane thickness were taken from a single, 100 μm thick slice along this line [7].
Fig. 3.
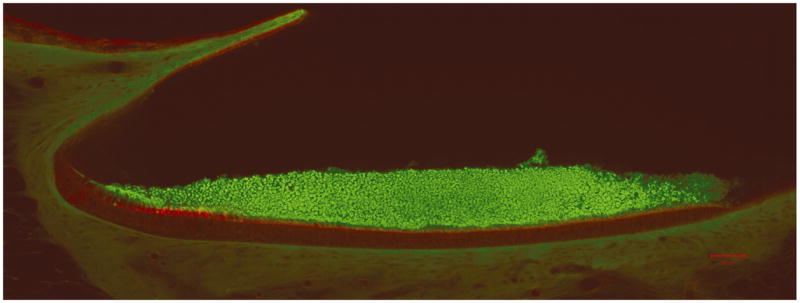
Confocal image of lateral-medial transect. This figure shows a confocal image of the lateral-medial transect of the left utricle (scale bar = 50 μm) [34]. The otoconial layer is stained green and the epithelial layer is stained red. Clearly visible in this image is the curvature of the LM transect. This figure was enlarged and the epithelial layer was curve fit by hand to determine curvature in this plane. Fig. 5 is used to determine individual layer thicknesses in the LM transect.
To determine macular curvature and the shape of the OM across the surface of the utricle, we sectioned the right utricle serially, in a plane perpendicular to the LM transect, i.e., approximating the anterior-posterior (AP) plane. A representative slice is shown in Fig. 4. These slices are called the orthogonal cross sections. We stained all utricular slices with WGA as described above, followed by phalloidin-Alexa Fluor 633 (Molecular Probes; 10μl of stock solution (300 U/1.5 ml methanol) in 400 μl AE) for 1 hour to visualize hair bundles.
Fig. 4.
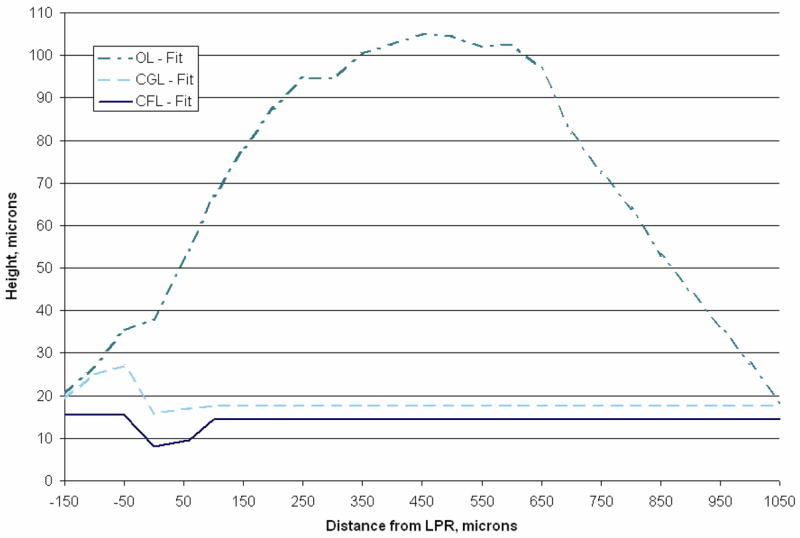
Lateral-medial transect layer thickness. Plotted in this figure are curve fits of lateral-medial transect layer thickness data from [34]. This blue line (solid) represents the column filament layer thickness relative to the epithelial layer. The striolar region is clearly visible here from negative 50 μm to positive 25 μm, and is the thinnest region in the CFL. The cyan line (dashed) represents the thickness of the compact gel layer. And finally the aqua line (dash-dot) represents the thickness of the otoconial layer along the lateral-medial transect. Layer thickness data between 950 and 1050 μm was linearly extrapolated from [34] to accommodate the 12 orthogonal cross sections (see Fig. 5) that were collected from the right utricle at 100 μm increments. Each discretized layer is used to construct the finite element models. The Quasi-2D model set layer thicknesses are based on this figure.
We imaged utricular whole-mounts and slices using an upright Zeiss LSM 510 confocal microscope. We used a Plan-Neofluar 10x objective for low magnification images of the utricular whole-mount and all slices, and a Zeiss C-Apochromat 63× water immersion objective (N.A. = 1.2) to collect high magnification images of the transect. We used Zeiss LSM 510 software (ver 3.0) to measure the relative thickness of the three otoconial membranes across the LM transect.
3. Finite Element OM Models
3.1 Model assembly
First we constructed an anatomically correct and dimensionally accurate OM model directly from the confocal images. This process was performed using a custom Graphics User Interface written in Matlab™ (ver. 7.2.0.232). This model is labeled the CV3D model. This label indicates that the model includes: 1) a curved macular surface–C, 2) varying OM layer thicknesses–V, and 3) a macular perimeter in three-dimensional space–3D. The CV3D OM model accurately describes the geometry of the turtle utricle. Modifications to this model, used to investigate the effects of different geometric configurations, are discussed later.
We arrived at the CV3D OM model by first fitting a curve to the neuroepithelium of the LM transect. This provided curvature of the macula in the lateral-to-medial direction. Then we added data on OM layer thicknesses from the LM transect (Fig. 4). Next, we fit a curve to the neuroepithelium in each of the 12 orthogonal cross sections, which provides macular curvature in approximately the anterior-to-posterior direction, and to the upper boundary of the OL (Fig. 5). Finally, we fit the approximate perimeter of the OL as seen in a whole-mount (Fig. 2), which was used to define the macular perimeter. The resulting profile is typical of utricular macula in this species [35].
Fig. 5.
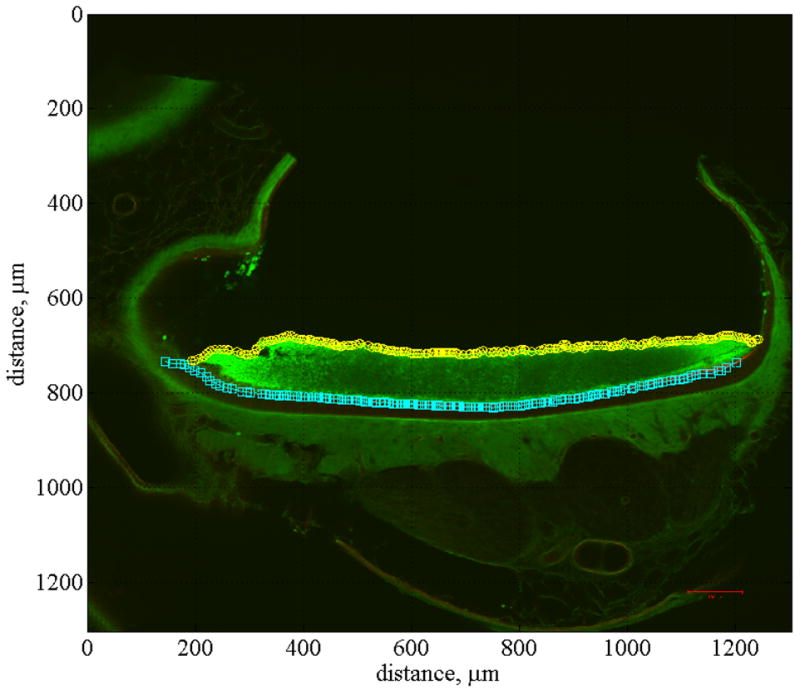
Anterior-posterior cross section. This figure shows a confocal image of anterior-posterior cross section number 6 of the right utricle. All of the anterior-posterior cross sections (12 total) were sliced at 100 μm increments. They are numbered sequentially from 1, indicating the lateral end of the utricle to 12, indicating the medial end. Also displayed in this figure is the curve fit used to locate the EL, identified with cyan squares, and the top of the OL, identified with yellow circles.
The confocal sections with their associated curve fits were assembled in a “fishbone” fashion (LM transect as the “back bone” and the orthogonal cross sections as “ribs”). An example of this is shown in Fig. 6. With the whole-mount providing a guideline for placement, the LM transect was placed appropriately on this whole-mount view (yellow arrows in Fig. 2). Each of the 12 orthogonal cross sections were then placed perpendicular to the whole-mount view and adjusted in the horizontal plane until their OL margins were aligned with the OL margins of the whole-mount. Then the neuroepithelium from each orthogonal cross section was aligned with the neuroepithelium of the LM transect. We then used linear interpolation between the aligned curve fits to create surfaces representing the neuroepithelium and the superior margin of the OL. Finally, we assumed that the measured thicknesses of the CFL and CGL along the LM transect were representative of thicknesses along any other radial transect through the macula. This places the 75 μm-wide striolar region along an arc from anterior to posterior following the curve of the lateral edge of the utricle.
Fig. 6.
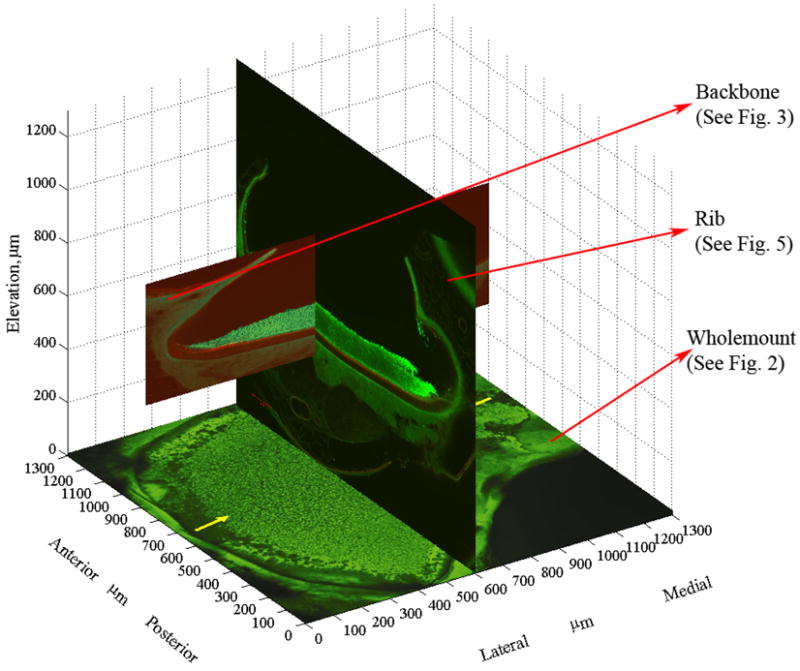
Fishbone Assembly. Figures 2, 3, and 5 are used to illustrate how the utricle model is assembled from the curve fits of each section. This represents the fishbone architecture. The placement of the LM transect (backbone) and one of the 12 AP sections (ribs) is shown. The whole-mount is fixed in its location. It is primarily used to adjust the AP sections anteriorly and posteriorly. Once the AP sections are adjusted within the utricle outline, their elevation is adjusted to match the EL of the LM transect to the EL of the AP section (Note: Elevation origin is arbitrarily defined in this image). This is repeated for all of the 12 AP sections. Linear interpolation between the AP sections is used to create the surfaces representing the neuroepithelium and the superior margin of the OL.
Previous models usually assume the macular surface to be flat [13, 14, 21–23]. However, this is not the case with the turtle: the macular surface is curved. We define the best-fit plane to the macular surface as the macular plane. The planar fit was defined by minimizing the distance between the fit plane and all of the points defining the macular surface.
3.2 Otoconial Membrane Model variations
Next, we modified the anatomically accurate (CV3D) OM model (Fig. 7a) to examine the influence of two geometric variables on the response of the OM: 1) curvature of the macular surface and 2) spatial variation in OM layer thicknesses. We modeled the neuroepithelium as a flat surface and/or used average thickness for each of the OM layers across the entire macula (i.e., no spatial variation in layer thickness). Macular perimeter remained constant in these models. The resulting OM models are named as follows (Figs. 7b–7d): Curved macular surface with Constant layer thickness 3 Dimensional (CC3D) OM model, Flat macular surface with Varying layer thickness 3 Dimensional (FV3D) OM model, and Flat macular surface with Constant layer thickness 3 Dimensional (FC3D) OM model.
Fig. 7.
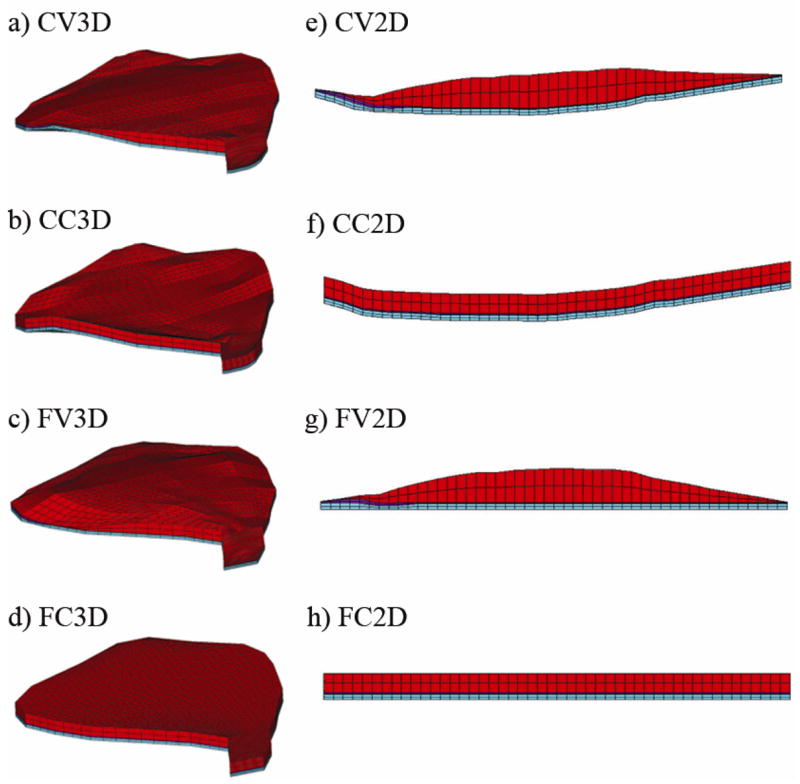
Three dimensional and quasi-two dimensional models. In a) the most accurate representation of the turtle utricle is shown: the Curved macular surface with Varying layer thickness 3 Dimensional (CV3D) model. Each of the variations within the 3D set either removes the curvature from the macular surface or averages the layer thickness of each of the layers, while holding the macular perimeter as a constant. The remaining 3D models are the: b) Curved macular surface with Constant layer thickness 3 Dimensional (CC3D) model; c) Flat macular surface with Varying layer thickness 3 Dimensional (FV3D) model and; the d) Flat macular surface with Constant layer thickness 3 Dimensional (FC3D) model. In e) the model that is based solely on the LM transect is shown with lateral to the left and medial to the right. This is the first of the Quasi-2D models set. The macular perimeter that was used with the 3D models has now been removed to create the Quasi-2D models. Each of the variations within the Quasi-2D set either removes the curvature from the macular surface or averages the layer thickness of each of the layers. The remaining 2D models are the: f) Curved macular surface with Constant layer thickness 2 Dimensional (CC2D) model; g) Flat macular surface with Varying layer thickness 2 Dimensional (FV2D) model and; h) Flat macular surface with Constant layer thickness 2 Dimensional (FC2D) model. Figures 7e through 7f also represent the lateral-medial transects of their 3D counterparts: Figures 7a through 7d, respectively.
To compare the results from the 3D OM model set to those typically seen in the literature, we created what we call the Quasi-2D OM model set (Figs. 7e–7h). These OM models are not literally two dimensional, but they are based solely on the geometry of the LM transect. This set differs from the 3D OM model set in that a curved macular perimeter is not included (i.e.: the macular perimeter is rectangular) and there is no variation of curvature in the orthogonal (anterior–posterior) direction. The first of the four models, Curved macular surface with Varying layer thickness Quasi-2 Dimensional (CV2D) OM model, is formed by simply extruding the LM transect in the orthogonal direction (Fig. 7e) until the mass of the OL is the same as the mass in the 3D OM models. The remaining Quasi-2D OM models (CC2D, FV2D, FC2D; Figs. 7f-7h) were created in the same manner as the 3D OM models: removal of curvature of the neuroepithelium and/or spatial variability in the thickness of each layer.
Careful attention was paid to maintain the same total mass of the OL (5.442E–8 kg) between all of the OM models. Depth of the 2D models was not of concern here. The important issue here is the equal OL mass as it provides inertia that allows accelerations to shear the CFL and GL. Thus the effects on displacements of varying OM layer thickness are due to changes in OL mass distribution, not the total mass of the OL. If the OL mass was not held constant between models, deflections with the same static stimulus would yield results that may not be entirely due to the variables we are trying to study. The same is true for the mode frequencies.
In addition, juxtaposing the Quasi-2D and 3D OM model sets demonstrates how the curved macular perimeter effects displacement of the OM. Within the Quasi-2D or 3D OM model sets we can isolate the effects of adding either macular curvature or varying OM layer thickness.
3.3 Material Properties
The GL and CFL have been described as having a “jelly-like” consistency [5] and are viscoelastic [14]. These layers are saccharide gels and have the potential to behave nonlinearly, in addition to having anisotropic and viscoelastic material properties. These material properties have all been observed in the tectorial membrane, which has similar saccharide structure; however, the GL and CFL behavior has not been experimentally measured [8]. The CFL, for example, consists of a network of interconnected filaments which has been described as visually anisotropic [20]. However, due to lack of available material property information on these layers, they have previously been modeled as linear elastic [19, 21] and linear viscoelastic [14, 15].
Because we do not know the material deformation properties of the OM layers in the turtle utricle, we used results from Kondrachuk’s modeling efforts, shown in Table 1 [21, 22]. These are the only results that isolate the material properties of the CFL and GL utilizing animal experimental tests [2, 21]. Modeling Benser et al.’s experiment on the bullfrog saccule, Kondrachuk arrived at material properties for the GL (6600 Pa – See Table 1) and the combined CFL and hair bundles (250 Pa – See Table 1).
Table 1.
Material properties of utricle layers
| Modulus (Pa) | Density (kg/m^3) | Poisson’s Ratio | |
|---|---|---|---|
| CFL | 250 | 1000 | 0.45 |
| GL | 6,600 | 1000 | 0.45 |
| OL | 6,600,000 | 2400 | 0.45 |
Material deformation properties for the OL are difficult to estimate due to variability in the crystal-gel ratio and mineral composition of crystals across species [29]. The OL has been assumed to be much stiffer than the gel layer due to the combination of otoconia crystals and gel. It has been estimated that an increase of stiffness between 20 times [19] and 3 orders of magnitude [24] over that of the GL is sufficient to ensure that its motion is simulated as a rigid body. A modulus of 6.6 MPa was used here, which is 3 orders of magnitude higher than the modulus of the GL, to ensure rigid body motion and because this is the value successfully utilized by earlier work. [24]
Lateral anchoring attachments between the periphery of the OM and the epithelium, whose postulated purpose is to hold the OM in place, have been seen in some species [27]. These attachments are not explicitly included in these models, although they would add additional stiffness and reduce deflections. We assumed these effects are incorporated into the moduli of the CFL and GL as measured by Benser et al. [2] and Kondrachuk [21].
The densities and Poisson’s ratios for the CFL and GL used in this study are shown in Table 1. These layers are treated as incompressible with a density of water ([12, 16, 18, 19, 21]). We tested values for Poisson’s ratio equal to 0.45, 0.49 and 0.499 with no change in the results. A value of 0.5 makes a material incompressible, however, the equations of elastic deformation are undefined at this value and cannot be used. A value for Poisson’s ratio of 0.45 was used in all models to ensure numerical stability in the calculations. It should be noted that no numerical instabilities were observed at the 0.499 value. The OL density is based on the 3:1 ratio of calcite (2710 kg/m^3) and aragonite (2930 kg/m^3) [3] and the approximately 4:1 ratio of crystal to gel [29] seen in turtles. The resulting OL density is 2400 kg/m3.
3.4 Finite Element Mesh & Boundary Conditions
We used ANSYS™ 11.0 for meshing and solving each of the OM model displacements, mode shapes and natural frequencies. ABAQUS™ 6.5 was also used to double check solutions. Each of the OM models was meshed with 8 node brick elements having 3 degrees of freedom per node, yielding mass and stiffness matrices describing the discretized properties of the utricle. The 3 degrees of freedom account for deflections in each Cartesian direction. We were only concerned with deflections in the models because the utricle primarily deforms in shear. Rotational degrees of freedom, usually used in bending analysis, would have added 3 additional degrees of freedom per node, increasing the computational costs, not increasing the accuracy of the model, and producing no additional benefit.
Each of the eight OM models was tested under the same boundary conditions. For static testing: the neuroepithelium was fixed and a body force of 1G acting in the macular plane was applied to the OL. Because of buoyancy effects from surrounding endolymph fluid, the body load acts only on the much denser OL, reducing its effective density by that of the endolymph fluid, 1000 kg/m3 [15, 16]. Displacements of the OM were obtained by solving equation 1:
| (1) |
where [K] is the stiffness matrix, [M] is the mass matrix, {x} is the resulting displacement vector, of the discretized OM, and {G} is the applied gravitational vector. Recall (as discussed in section 3.2), that for each of the OM models, careful attention was paid to keeping the total mass of the OL constant between the models. This is important, as the deflections of the OM, obtained from equation 1, are dependent not only on the total mass, but also on the distribution of mass within the structure.
The G vector was rotated in the macular plane at 15-degree increments. Displacements at the CFL-GL interface, below the center of mass (COM) of the OL, were used for each application of the G vector. These displacements were divided by the applied load, and this result is referred to as the Static Mechanical Gain. It should be noted that the location of the COM is not necessarily the same in these models. However, the displacement below the COM of the OL is a good way to represent the global motion of the OL as it affects hair bundles. Figure 8b shows the location of the COM in the various models studied here. Results from each model illustrate how the stimulus to hair bundles is affected by macular curvature and spatial variation in OM layer thickness. Although the CFL-GL interface is not exactly where all hair bundles contact the OM [20, 31], determining the movement of this interface is an important step into understanding the overall motion of the organ. This will then lead to an understanding of how hair bundles respond to the motion of the OL.
Fig. 8.
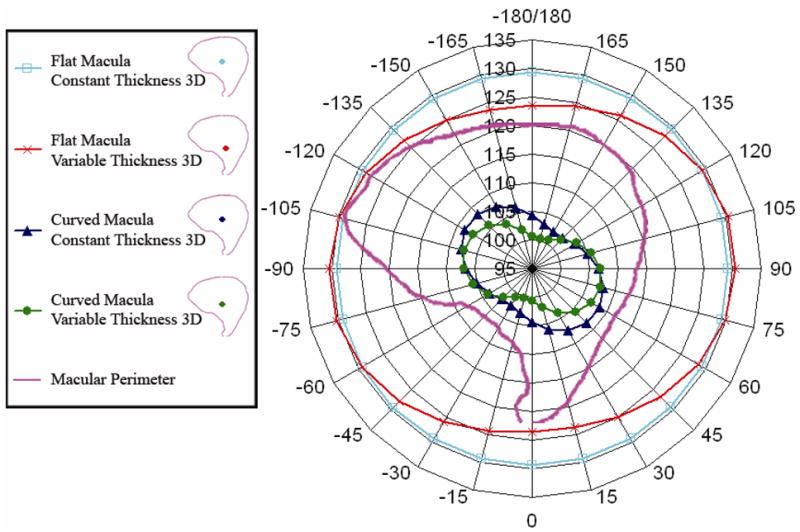
Static Mechanical Gain (nm/G) for all 3D models. This image shows a polar plot of the static mechanical gain for the four three dimensional models. The scale is from 95 nm/G at the center, to 135 nm/G. This scale is chosen to visually enhance the variation in the gain. The variation in the flat models is similar to the curved models in that they do have a “peanut shape” although the variation between maximum and minimum gain is slight. The macular perimeter is shown as a reference for orientation. From this plot we can conclude that curvature of the macular surface does contribute to decreasing the static gain in all directions. We may also conclude that variable thickness also contributes to the changing gain by rotating maximum and minimum directions. Location of the Center of Mass (COM) for the four 3D models used in the study are shown in the legend.
We also investigate the effects of macular curvature, OM layer thickness, and macular perimeter on the modal response of the utricle. Results from modal analysis are the undamped natural frequencies and displacement modes of vibration of a mechanical system. Even though the utricular system is highly overdamped, these results are useful to understand the complex nature of the displacement results. In the case of the utricle model, undamped natural frequencies of displacements within the OM are proportional to eigenvalues (λ) and the eigenvectors ({Ψ}) represent the magnitude and direction of these displacements (i.e., displacement modes of vibration; see below) when the neuroepithelium is fixed. Eigenvalues and eigenvectors are solved for using equation 2, where: [M] −1 is the Inverted Mass matrix (from equation 1), and [I] is an identity matrix. Setting the determinant of equation 2 equal to zero one may solve for all of the eigenvalues.
| (2) |
Eigenvectors are determined by directly solving equation 2.
Each FE model used in this analysis was meshed with over 13 thousand nodes having three degrees of freedom per node, i.e., three possible directions of displacement per node. In addition, each model has as many natural frequencies (eigenvalues) and characteristic displacement modes of vibration (eigenvectors) as degrees of freedom in the model [30]. Each displacement mode represents a linearly independent combination of displacements at nodes in the model. The phase relationship of nodal movement can be represented by modes, which describe the relative magnitude and direction of each nodal displacement with respect to other nodal displacements in the model [26]. For example, if the whole structure moves in-phase, as in a low frequency mode, all of the nodes would be moving in approximately the same direction at the same time.
Low frequency displacement modes represent the largest whole-body-in-phase displacements of a structure. This is a result of the amplitude of displacement being inversely proportional to the square of the frequency. High frequency displacement modes represent motion in which parts of the structure move out-of-phase with respect to other parts of the structure [26]. We are interested in low frequency displacement modes for two reasons. First, low frequency displacement modes are easily excited (they require less energy to excite) and are therefore most frequently excited. Secondly, in our OM models these low frequency displacement modes represent shear displacement of the OL, i.e., the characteristic natural motion of the OM. Higher order displacement modes represent more complicated, non-characteristic, non-normal motions of the OM. For example, the third displacement mode of the CV3D model represents torsional rotation of the OL over the macular surface about a point near the center of the OM. This displacement mode, as well as other remaining higher frequency displacement modes, are probably not excited under normal physical conditions due to: 1) displacements in high frequency modes generally being of small amplitude (as mentioned earlier) and 2) damping in the structure attenuating the displacement.
4. Results
The displacement field for the utricle models examined was complex and presenting these results in a meaningful way was difficult. The otoconial layer moved as rigid body, however, its linear displacement was combined with a slight rotation. This rotational component added complexity to the otoconial layer movement and the change in gel and column filament layer thickness added additional displacement differences at the hair cell level. The displacement results are presented in two ways to provide understanding of the overall response. First, static mechanical gain below the center of mass of the otoconial layer is used to represent the global response. And second, we utilized modal analysis to extract information about the more complex behavior of the otoconial layer, which relates to not only global response but also addresses the overall displacement field results. Finally, a few comments on hair cell displacements are made.
4.1 Static Results
We use static mechanical gain (nm/G) defined as magnitude of displacement (nanometers) of the CFL-GL interface below the mass center of the OL per unit acceleration (G) to quantify the global static results. This was used because it captures the global behavior of the OM at a region in which many hair bundles interact with the OM. Static gain was also used so that the results could be scaled to any acceleration since the model is linear and scaling is appropriate.
Asymmetry of the 3D macular perimeter and thickness variation of the OM models (e.g.: CV3D OM model) produce two significant results. First, there were changes in static gain over the surface when the stimulus acceleration was in a specific direction, and the maximum variation observed in the model was 15 nm/G. Second, these asymmetries also produce different gains with specific stimulus accelerations directions. This variability, later explained with the displacement mode shapes, is avoided by using mass center measures. Thus, static mechanical gain is a good representation of displacement per unit acceleration in the OM at a height pertinent to hair bundle stimulus.
We determined that static mechanical gain changes with stimulus direction and these results are shown in Fig. 8. Static mechanical gain of each 3D OM model, when plotted in polar coordinates, outlines a peanut shape in the macular plane, having orthogonal maximum and minimum gains. These plots are similar to the maximum response figures shown by Jaegar et al. [18].
In order to determine if minor errors in the curve fitting or tissue preparation of the OM may affect results of the static mechanical gain, we increased the density of the OL in different regions of the utricle. These tests indicate that static mechanical gain increases due to an increase in the overall mass of the OL, as would be expected, but the orientation and shape of the static mechanical gain remains unaffected.
Static mechanical gain results indicate that magnitude and orientation vary with 3D OM geometry. For example, the OM model with flat macular surface and spatially varying OM layers (FV3D; Fig. 8, red crosses) has the greatest maximum gain of all the OM models (see Table 2). The OM model with flat macular surface and constant OM layer thickness (FC3D; Fig. 8, blue squares) has a slightly lower maximum gain (reduced by about 1 nm/G) but this OM model’s direction of maximum gain has rotated at least 60 degrees in the macular plane from the FV3D OM model. The change in orientation of the OM maximum static mechanical gain is due to spatial variation of the thickness of the OM layer thickness.
Table 2.
Maximum static mechanical gains and corresponding angles for each model
| Quasi 2D Models | 3D Models | |||
|---|---|---|---|---|
| Macular Surface | OM Layer Thickness | Max. Static Mechanical Gain (nm/G) [LM Transect] | Max. Static Mechanical Gain (nm/G) | Corresponding Angles (degrees) |
| Flat | Constant | 131.02 | 129.31 | 15 & –165 |
| Flat | Variable | 132.94 | 130.53 | 90 & –90 |
| Curved | Constant | 122.77 | 108.55 | 75 & –105 |
| Curved | Variable | 124.52 | 107.39 | 60 & –120 |
Macular curvature reduces the magnitude of maximum static mechanical gain by 17–18 percent. This is shown in Fig. 8 as a reduction in the maximum magnitude of the gain peanuts from about 130 nm/G to about 108 nm/G. Recall that this is the displacement per unit G at the height at which most hair bundles interact with the OM, and therefore a 22 nm/G average reduction will affect a hair bundle’s activation. With the addition of macular curvature to the OM models, the effect of spatially varying OM layers is reduced, only changing the orientation of the maximum static mechanical gain about 15 degrees between (CC3D and CV3D) OM models.
The effect of macular perimeter on the direction of maximum static mechanical gain is evident in the 3D OM models. These results indicate the macular perimeter should be included in future OM models because it can effect the response of the OM. Tribukat et al. [33] have also reported that differences in the shape of the macular perimeter in human utricle affect the number of hair cells that respond to different directions of stimulation.
4.2 Modal Analysis Results
In addition to static mechanical gain, modal analysis was used to determine the nature of the OM response. In modal analysis the undamped natural frequencies and displacement modes (direction of vibration) of the OM are determined. These response modes were used to learn how the three geometric variables affect OM response. Recall that total mass is kept constant across all models, thereby eliminating total mass as an independent variable (see Section 3.2).
The first mode or lowest undamped natural frequencies of vibration for all the OM models are reported in Table 3. In the case of the Quasi-2D OM models, these frequencies correspond to displacement modes in which the rigid body displacement of the OL shears underlying CFL and GL along the LM transect. This is the only meaningful direction of displacement for these models, since they do not account for either macular perimeter or spatial geometry in the orthogonal directions.
Table 3.
Undamped natural frequencies of the OM models. In the case of the Quasi-2D OM Models these natural frequencies correspond to displacement modes in which the OM shears parallel to the LM transect. For the 3D OM models these natural frequencies are the lowest (i.e.: first), and correspond to the displacement modes shown in Figure 9.
| Quasi 2D | 3D | ||
|---|---|---|---|
| Macular Surface | OM Layer Thickness | ωn, Hz | ωn, Hz |
| Flat | Constant | 1389.76 | 1396.84 |
| Curved | Constant | 1436.09 | 1515.06 |
| Flat | Variable | 1377.90 | 1376.84 |
| Curved | Variable | 1426.88 | 1530.19 |
The displacement modes shown in Figs. 9a–d correspond to the natural frequencies of the 3D OM models listed in Table 3. These displacement modes also indicate a rigid displacement of the OL, thereby shearing the underlying layers of the OM. However, unlike the 2D OM models, the rigid displacement of the OL has a slight rotation in all of 3D OM models. The point about which the OL rigidly rotates in each mode is referred to as the center of rotation for that mode. This point is determined by calculating the location of the intersection of two lines perpendicular to the direction of displacement of two nodes in the OL for each mode. This is possible because of the rigid body motion exhibited by the OM due to its high modulus. The location for each center of rotation in each mode is indicated in Figs. 9a–d by a circled X. The color bar indicates the relative magnitude of deflection within each mode (red = largest magnitude and blue = lowest magnitude).
Fig. 9.
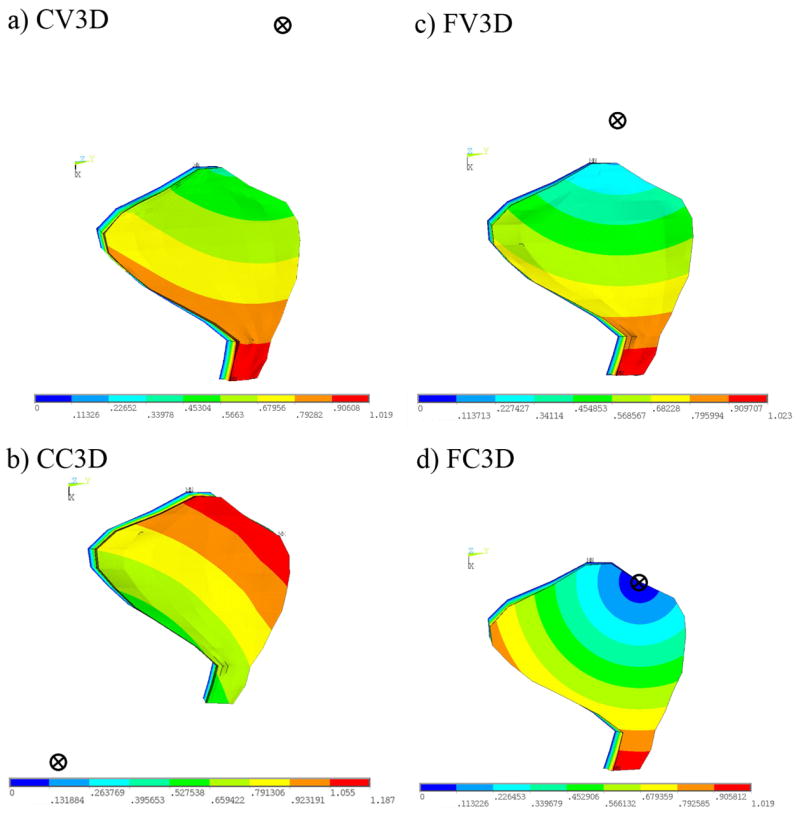
Mode shapes and centers of rotations corresponding to first natural frequency of 3D OM models. This figure indicates the displacement magnitude (red = large, blue = small) and the center of rotation (circle with an X) for each of the mode shapes corresponding to the 1st natural frequency for each of the 3D OM models. The deflection in the first mode causes a shearing of the CFL. This shearing, however, is no longer restricted to be parallel (or perpendicular) to the LM transect, as is the case in the 2D OM models. The center of rotation is located by calculating the intersection of two lines drawn in the macular plane and perpendicular to the directions of deflection of two points in the OL.
We also discover the direction of deflection of the center of mass in the first two undamped displacement mode shapes align with the maximum and minimum static mechanical gains. Spatial variation of OM layers does not affect the magnitude of the natural frequency significantly, just as it does not affect the magnitude of the maximum gain in the static analysis. However, redistributing the OL mass over the macular surface does shift the center of rotation of the OL in the macular plane. For example, the first displacement mode of the FC3D OM model indicates a maximum displacement of the OM (shown in red) at the medial extreme of this OM model. The minimum displacement of the OM (shown in blue) is located at the anterior-lateral portion of this OM model. This minimum displacement also coincides with the center of rotation of the OL for this displacement mode. While this displacement mode is similar to the first displacement mode of the flat macular surface and spatially varying OM layer model (FV3D OM model), in that the maximum and minimum displacements occur in similar regions of the OM, the difference between these displacement modes is the location of the center of rotation.
The center of rotation for the first displacement mode of the FV3D OM model is not located on the anterior-lateral portion of the utricle. It is located at a point lateral to the utricle. We also notice that the center of rotation for all the models except the CC3D model is towards the lateral side of the utricle. This is probably due to both the curvature of maculae and more OL mass in the lateral region of the CC3D model. These shifts in the centers of rotations are analogous to changing the directions of the maximum static mechanical gain. In fact, we discover close alignment between the direction of deflection of the center of mass in displacement mode 1 of each OM model when the center of rotation is not located within (or on) the macular perimeter (i.e.: all except the FC3D OM model).
This slight rotation of the OM in the lowest modal frequency (i.e.: the frequency closest to zero or static) is indicative of the influence of the first displacement mode shape on the static displacement and thus explains the slight (15 nm/G) variation in gain over the macular surface observed in the static test. A 15-nm/G variation in displacement is probably insignificant to the activation of MES hair bundles, due to their large operating range[1, 28]. However, there is a narrow operating range in striolar hair bundles [28], and thus a striolar bundle may be able to detect this small variation in gain.
Curvature of the macular surface, in addition to changing the location of the center of rotation of the displacement modes, also increases the natural frequency of the OM models. This indicates an increase in stiffness, as the square of the natural frequency is directly proportional to stiffness (see Eqn. 2). Thus, comparing the stiffness (i.e.: the square of the natural frequency) between models with and without curvature indicates an increase in stiffness of between 17 and 23 percent when curvature of the macular surface is included. This change in magnitude of stiffness is close to those calculated using static mechanical gain in the static analysis, in which model stiffness is directly proportional to displacement.
Finally, not including macular perimeter in the OM models geometrically restricts the displacement in the mode shapes. The only geometric variation in the Quasi-2D OM models is along the LM transect, therefore, the only meaningful displacement modes are parallel to this direction (see Table 3: Quasi-2D). Once asymmetry of the macular surface is introduced, with the inclusion of a curved macular perimeter, the meaningful mode shapes of the utricle are no longer restricted to just the lateral-medial directions (See Figs. 9a–d). In fact, we discover that the first mode of vibration, the easiest mode to excite, of the geometrically accurate OM model (CV3D) has an anterior-posterior component of deflection. These displacement modes are not apparent in OM models without macular perimeter.
4.3 Hair Bundle Displacement
It is important to keep in mind that hair bundles are the transducers of OM stimulus deflections. Contained in the CFL, bundle displacements are related to displacements of this layer, their points of attachment, and any deformation interaction that may be present between the bundles and GL or CFL. While geometry of individual hair bundles affect their own displacement, location on the macular surface may also affect hair bundle displacement. As the results show, this is potentially due to varying OM structure over different regions of the curved macular surface. Therefore, we investigated how static displacements along the LM transect of the CV3D utricle model under a static 1 G load (parallel to the LM transect) differ from one another. We focused on displacements in three representative regions: Medial Extrastriola (MES), Striola (STR), and Lateral Extrastriola (LES). The results are shown in Fig. 10, in which each curve represents the displacement profile thought the CFL and GL (relative to the neuroepithelium) for each representative region. The point of inflection in each curve indicates the transition between CFL and GL. These results indicate a bundle contacting the OM in the striolar (STR) region may experience twice as much angular deflection, due to the thinner CFL, than bundles contacting the OM in the extrastriolar (MES or LES) regions.
Fig. 10.
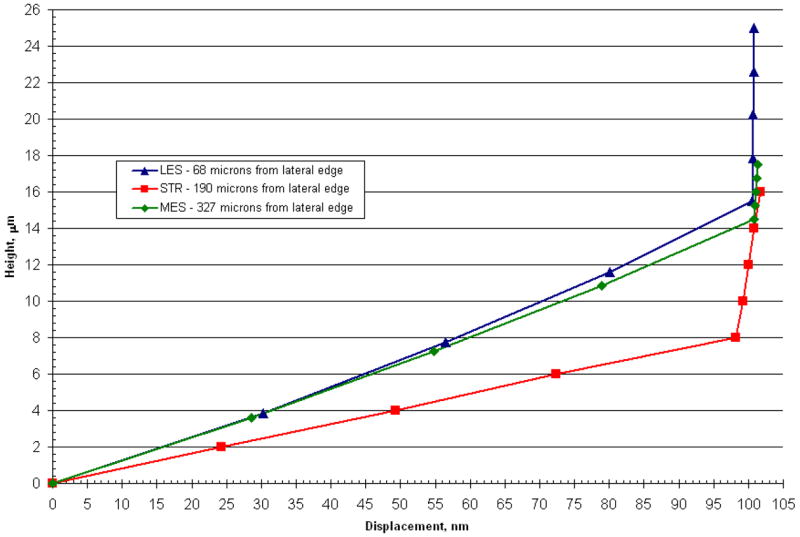
Displacement profile for 3 regions along the LM transect of CV3D OM (Utricle) model. This figure shows displacements through the GL and CFL for 3 regions along the LM transect in the CV3D model. Triangles represent the lateral extrastriola region (located 68 microns from the lateral edge), squares represent the striolar region (located 190 microns from the lateral edge) and diamonds represent the medial extrastriola region (located 327 μm from the lateral edge). Most of the shearing occurs in the more compliant column filament layer of the model. These displacement profiles are linear in a given region and reflect the general behavior throughout their region.
In addition, we discovered locations in LES of the CV3D OM model in which the displacement profile through the CFL does not follow the same linear profile as in other regions of the utricle. Possible reasons for these results are discussed in the following section. These regions (along the LM transect) and approximate distance from the lateral edge of the utricle are shown in Fig. 11.
Fig. 11.
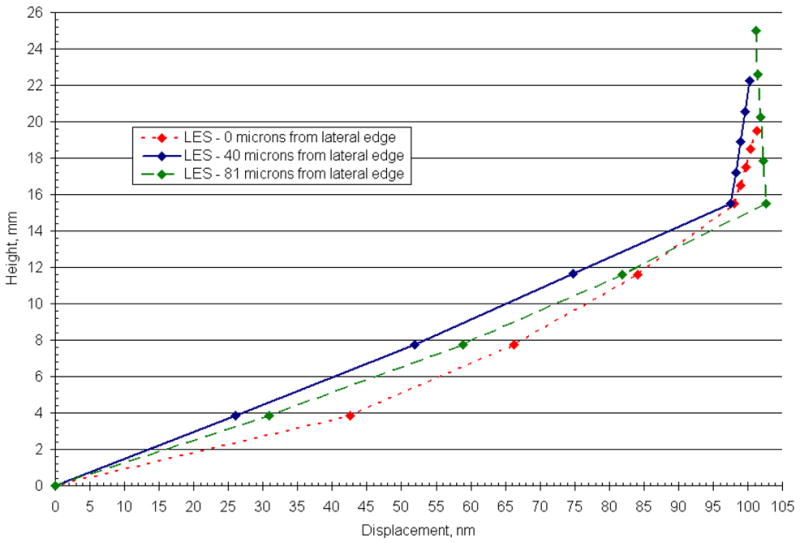
Displacement profile for 3 locations in the lateral extrastriola (LES) along the LM transect of the CV3D OM (Utricle) model. This figure illustrates the displacement profile of the GL and CFL for 3 discrete locations (0,40, and 81 microns from the lateral edge) in the LES. In the LES, displacement profiles arise in the CFL that depart from the linear profile observed throughout the interior region. These displacement profiles indicate that proximity to the lateral edge is not the only mechanism to disrupt the linear deformation profiles in this region. Additional suspected causes for this disruption are the thinning OL in this region and an increased curvature of the macular surface.
5. Discussion
5.1 Possible Function of Geometric Variables
The results of this investigation indicate that the structure of the utricle-OM complex can influence OM and presumably hair bundle deflections. The effect of each geometric variable (macular perimeter, macular curvature, and spatially varying OM layer thickness and resultant mass distribution) on the static and modal response of the OM was investigated. Static mechanical gain and modal analysis reveal similar effects of each variable. Curvature of the macular surface acts to stiffen the utricle. This can best and most easily be seen in the magnitude of static mechanical gain. Curved macular surface models have lower mechanical gains when compared to the models with flat macular surface. The increase in stiffness may also be seen in the increased OM modal frequencies of the flat versus curved macular surface models (FC3D and FV3D).
The most obvious effect arises from the redistribution of OL mass because of macular shape and variable layer thicknesses in the OM. Both variables combine with the effect of macular curvature to change the direction of static and modal OM displacements. In particular, spatial variation of the OM layers acts as a tuning mechanism for these directional changes: variation of the OM layer thicknesses provide minor adjustments to the direction (and magnitude) of maximum static mechanical gain. In addition, in the modal results, the centers of rotation of the displacement modes are changed through a redistribution of OL mass. Changes in structure of the OM clearly change the otoconial organ response to accelerations and most likely change the hair bundle’s response.
5.2 Loss of linearity in deflection profile in CFL of LES
The displacement profiles observed locally in the CFL of the LES region of the utricle are departures from linear displacement profiles (Fig. 11) observed in other regions of the utricle (Fig. 10). One possible reason for this observation is the lack of knowledge as to the effects of the lateral anchoring attachments observed in this region [27]. We also suspect these changes are influenced by two geometric changes in this region, illustrated in Fig 12: 1) the thinning OL and 2) the change in curvature of the macular surface. Because there is little or no OL mass to inertially shear the LES of the CV3D OM model, the displacement profile of the CFL, in this region, is a result of MES and Striola forcing the displacement in the CFL of this region (as shown in Figs. 11 & 12). This change in curvature, combined with the thinning OL, affect the overall stiffness and displacement throughout the CFL and GL of the utricle in this region.
Fig. 12.

Undeformed and deformed lateral extrastriola. Shown here are the undeformed and deformed lateral extrastriola (from bottom to top: CFL (cyan), GL (purple) and OL (red)) in the LM transect of the CV3D OM model. The boundary conditions are a fixed epithelium (yellow cross hatch) and a static 1G load applied parallel to the LM transect. Displacement in the deformed figure is magnified 100 times to illustrate the deformation. This figure also illustrates two possible reasons for the non-linear deflections observed in the LES (shown also in Fig. 11): (1) thinning OL and (2) increased curvature of the macular surface in this region.
5.3 Additional Influencing Variables
The three variables that we chose to test (curvature of the macular surface, varying OM layer thicknesses and macular perimeter,) are not the only variables that will contribute to changing deflection in the OM. Structure of each individual OM layer may also influence OM deflections. For example, the column filament layer consists of densely-packed-inter-connected filaments [20], for which we assume the overall material properties of this layer to be isotropic [15, 17, 18, 21]. There has been only one experimental measure of the elasticity of the CFL by Benser et al. [2], and one finite element model of these experiments, by Kondrachuk [21]. In each of these cases isotropy of the CFL was assumed. However, yet to be determined, is the influence of the interconnectivity and number of filaments on the material properties of this layer. The CFL could indeed be anisotropic, which may influence the displacement of these organs and therefore the force boundary conditions on hair bundles.
A similar example of a variable that could influence displacement of the OM are the channels or holes that have been reported in the GL in the striola region of the turtle utricle [34]. Hair bundles already sit in channels in the CFL. However, in the striola, these channels extend through the GL to the OL. This may decrease the stiffness of the GL in this region. This implies there would be a decrease in the magnitude of displacement transmitted to hair bundles in the CFL, assuming a rigid displacement of the OL, due to the weaker GL in this region sharing more of the load applied to the OM when compared to GL deflection in the MES region. Recall, from Fig. 10, that there is another mechanism that may affect stimulus applied to hair bundles: the thickness of the CFL. Hair bundles in the striola already experience twice the shear gradient through the thickness of the CFL than hair bundles in the extrastriola. This is due to the thinner CFL in the striola. Therefore a proposed purpose for GL holes in the striola may be a mechanism to protect hair bundles from damaging stimulus by reducing the magnitude of the stimulus transmitted striolar hair bundles.
6. Conclusion
Approximations have been made in past OM models that do not include detailed geometry of otoconial organs [14–16, 18, 21]. Including three dimensional geometry: (1) curvature of the macular surface, (2) spatially varying OM layers, and (3) curved macular perimeter; as in the CV3D model, contribute to a detailed understanding of displacement characteristics throughout the OM. This study reveals the importance of including accurate geometry in OM models. We discover the utricle does have directions of maximum and minimum static mechanical gain whose magnitude and direction can be regulated by the geometric variables included in the models. One and two-dimensional OM models may overlook these aspects of otoconial organs, yielding inaccurate results. The next step in understanding the overall transduction process is to investigate the interaction of the hair cell bundles with the CFL and GL. Each of the OM models discussed here help reveal how the utricle functions and it will lead to better definitions of displacement and force stimuli applied to hair bundles.
Acknowledgments
This work was supported in part by NIH NIDCD R01 DC 05063 and NIH NIDCD R01 DC 002290-12.
Abbreviations Used: Utricle Anatomy
- EL
Epithelial Layer
- CFL
Column Filament Layer
- GL
Compact Gel Layer
- LM
Lateral-Medial
- OL
Otoconial Layer
- HC
Hair Cell
- HCB
Hair Cell Bundle
- AP
Anterior-Posterior
Utricle Preparation
- AE
Artificial Endolymph
Model Nomenclature
- CV3D
Curved macular surface with Varying layer thickness and a macular perimeter in the horizontal plane
- CC3D
Curved macular surface with Constant layer thickness and a macular perimeter in the horizontal plane
- FV3D
Flat macular surface with Varying layer thickness and a macular perimeter in the horizontal plane
- FC3D
Flat macular surface with Constant layer thickness and a macular perimeter in the horizontal plane
- CV2D
Curved macular surface with Varying layer thickness based solely on the geometry of the 2D LM transect
- CC2D
Curved macular surface with Constant layer thickness based solely on the geometry of the 2D LM transect
- FV2D
Flat macular surface with Varying layer thickness based solely on the geometry of the 2D LM transect
- FC2D
Flat macular surface with Constant layer thickness based solely on the geometry of the 2D LM transect
References
- 1.Baird RA. Comparative transduction mechanisms of hair cells in the bullfrog utriculus. I. Responses to intracellular current. J Neurophysiol. 1994;71:666–684. doi: 10.1152/jn.1994.71.2.666. [DOI] [PubMed] [Google Scholar]
- 2.Benser ME, Issa NP, Hudspeth AJ. Hair-bundle stiffness dominates the elastic reactance to otolithic-membrane shear. Hear Res. 1993;68:243–252. doi: 10.1016/0378-5955(93)90128-n. [DOI] [PubMed] [Google Scholar]
- 3.Carlstrom DA. Crystallographic study of vertebrate otoliths. The Biological Bulliten. 1963:441–463. [Google Scholar]
- 4.Crawford AC, Evans MG, Fettiplace R. The actions of calcium on the mechano-electrical transducer current of turtle hair cells. J Physiol. 1991;434:369–398. doi: 10.1113/jphysiol.1991.sp018475. [DOI] [PMC free article] [PubMed] [Google Scholar]
- 5.De Vries H. The mechanics of the labyrinth otoliths. Acta Otolaryngol. 1951;38:262–273. doi: 10.3109/00016485009118384. [DOI] [PubMed] [Google Scholar]
- 6.Edge RM, Evans BN, Pearce M, Richter CP, Hu X, Dallos P. Morphology of the unfixed cochlea. Hear Res. 1998;124:1–16. doi: 10.1016/s0378-5955(98)00090-2. [DOI] [PubMed] [Google Scholar]
- 7.Fontilla MF, Peterson EH. Kinocilia heights on utricular hair cells. Hear Res. 2000;145:8–16. doi: 10.1016/s0378-5955(00)00068-x. [DOI] [PubMed] [Google Scholar]
- 8.Freeman DM, Abnet CC, Hemmert W, Tsai BS, Weiss TF. Dynamic material properties of the tectorial membrane: a summary. Hear Res. 2003;180:1–10. doi: 10.1016/s0378-5955(03)00073-x. [DOI] [PubMed] [Google Scholar]
- 9.Freeman DM, Cotanche DA, Ehsani F, Weiss TF. The osmotic response of the isolated tectorial membrane of the chick to isosmotic solutions: effect of Na+, K+, and Ca2+ concentration. Hear Res. 1994;79:197–215. doi: 10.1016/0378-5955(94)90141-4. [DOI] [PubMed] [Google Scholar]
- 10.Freeman DM, Hattangadi SM, Weiss TF. Osmotic responses of the isolated mouse tectorial membrane to changes in pH. Auditory Neuroscience. 1997:363–375. [Google Scholar]
- 11.Freeman DM, Hendrix DK, Shah D, Fan LF, Weiss TF. Effect of lymph composition on an in vitro preparation of the alligator lizard cochlea. Hear Res. 1993;65:83–98. doi: 10.1016/0378-5955(93)90204-e. [DOI] [PubMed] [Google Scholar]
- 12.Grant JW, Best WA. Mechanics of the otolith organ--dynamic response. Ann Biomed Eng. 1986;14:241–256. doi: 10.1007/BF02584273. [DOI] [PubMed] [Google Scholar]
- 13.Grant JW, Best WA, LoNigro R. Governing equations of motion for the otolith organs and their response to a step change in velocity of the skull. J Biomech Eng. 1984;106:302–308. doi: 10.1115/1.3138498. [DOI] [PubMed] [Google Scholar]
- 14.Grant JW, Cotton JR. A model for otolith dynamic response with a viscoelastic gel layer. J Vestib Res. 1990;1:139–151. [PubMed] [Google Scholar]
- 15.Grant JW, Huang CC, Cotton JR. Theoretical mechanical frequency response of the otolithic organs. J Vestib Res. 1994;4:137–151. [PubMed] [Google Scholar]
- 16.Grant W, Best W. Otolith-organ mechanics: lumped parameter model and dynamic response. Aviat Space Environ Med. 1987;58:970–976. [PubMed] [Google Scholar]
- 17.Hudetz WJ. A computer simulation of the otolith membrane. Comput Biol Med. 1973;3:355–369. doi: 10.1016/0010-4825(73)90002-4. [DOI] [PubMed] [Google Scholar]
- 18.Jaeger R, Haslwanter T. Otolith responses to dynamical stimuli: results of a numerical investigation. Biol Cybern. 2004;90:165–175. doi: 10.1007/s00422-003-0456-0. [DOI] [PubMed] [Google Scholar]
- 19.Jaeger R, Takagi A, Haslwanter T. Modeling the relation between head orientations and otolith responses in humans. Hear Res. 2002;173:29–42. doi: 10.1016/s0378-5955(02)00485-9. [DOI] [PubMed] [Google Scholar]
- 20.Kachar B, Parakkal M, Fex J. Structural basis for mechanical transduction in the frog vestibular sensory apparatus: I. The otolithic membrane. Hear Res. 1990;45:179–190. doi: 10.1016/0378-5955(90)90119-a. [DOI] [PubMed] [Google Scholar]
- 21.Kondrachuk AV. Computer simulation of the mechanical stimulation of the saccular membrane of bullfrog. Hear Res. 2000;143:130–138. doi: 10.1016/s0378-5955(00)00034-4. [DOI] [PubMed] [Google Scholar]
- 22.Kondrachuk AV. Finite element modeling of the 3D otolith structure. J Vestib Res. 2001;11:13–32. [PubMed] [Google Scholar]
- 23.Kondrachuk AV. Models of the dynamics of otolithic membrane and hair cell bundle mechanics. J Vestib Res. 2001;11:33–42. [PubMed] [Google Scholar]
- 24.Kondrachuk AV, Ross MD. Modeling of the otolith structure behavior under static loads (internal forces and endolymphmatic pressure). Association for Research in Otolaryngology - Midwinter meeting; 1997. [Google Scholar]
- 25.Lowenstein O, Roberts TD. The equilibrium function of the otolith organs of the thornback ray (Raja clavata) J Physiol. 1949;110:392–415. doi: 10.1113/jphysiol.1949.sp004448. [DOI] [PMC free article] [PubMed] [Google Scholar]
- 26.Meirovitch L. Elements of vibration analysis. McGraw-Hill; New York: 1986. [Google Scholar]
- 27.Money KE, Correia MJ. The vestibular system of the owl. Comp Biochem Physiol A. 1972;42:353–358. doi: 10.1016/0300-9629(72)90116-8. [DOI] [PubMed] [Google Scholar]
- 28.Nam JH, Cotton JR, Grant JW. A Computational Study of the Effect of Hair Bundle Shape and Loading Condition on the Mechanosensory Response. Society for Neuroscience. 2005 [Google Scholar]
- 29.Pote KG, Weber CH, Kretsinger RH. Inferred protein content and distribution from density measurements of calcitic and aragonitic otoconia. Hear Res. 1993;66:225–232. doi: 10.1016/0378-5955(93)90142-n. [DOI] [PubMed] [Google Scholar]
- 30.Reddy JN. An introduction to the finite element method. McGraw-Hill; New York: 1984. [Google Scholar]
- 31.Ross MD, Komorowski TE, Donovan KM, Pote KG. The suprastructure of the saccular macula. Acta Otolaryngol. 1987;103:56–63. doi: 10.3109/00016488709134698. [DOI] [PubMed] [Google Scholar]
- 32.Shah DM, Freeman DM, Weiss TF. The osmotic response of the isolated, unfixed mouse tectorial membrane to isosmotic solutions: effect of Na+, K+, and Ca2+ concentration. Hear Res. 1995;87:187–207. doi: 10.1016/0378-5955(95)00089-m. [DOI] [PubMed] [Google Scholar]
- 33.Tribukait A, Rosenhall U. Directional sensitivity of the human macula utriculi based on morphological characteristics. Audiol Neurootol. 2001;6:98–107. doi: 10.1159/000046815. [DOI] [PubMed] [Google Scholar]
- 34.Xue J, Peterson EH. Structure of Otolithic Membranes in Utricular Striola. Association for the Research in Otolaryngology - Midwinter Meeting; 2002. [Google Scholar]
- 35.Xue J, Peterson EH. Hair bundle heights in the utricle: differences between macular locations and hair cell types. J Neurophysiol. 2006;95:171–186. doi: 10.1152/jn.00800.2005. [DOI] [PubMed] [Google Scholar]


