

Abstract
We report here the presence of specific plasma membrane calcium pumps (PMCAs) in mouse olfactory sensory neurons. All 4 isoforms are present as shown by deconvolution microscopy, and the specific splice variants are identified by reverse transcriptase (RT)–polymerase chain reaction (PCR). The PMCAs are present on the cell body, dendrite, knob, and cilia, but the different isoforms of PMCAs are not identical in their distributions. The PMCAs are positioned to play a role in calcium clearance after stimulation.
Keywords: calcium, mouse, olfaction, pumps
Introduction
Calcium ions are ubiquitous second messengers that regulate diverse cellular processes from secretion to gene transcription. In order for Ca2+ to serve these functions, the resting intracellular free Ca2+ concentration typically is kept very low, <100 nM in contrast to ~1–3 mM in the extracellular environment (Carafoli 1994). In chemosensory cells, such as olfactory sensory neurons (OSNs), an increase in the free cytosolic calcium has a variety of important roles, including vesicular neurotransmitter release, activation of Cl− conductance, desensitization of cyclic nucleotide–gated ion channels, and regulation of enzymes in signal transduction pathways (Borisy et al. 1992; Wayman et al. 1995; Kleene 1999; Trudeau and Zagotta 2003).
There are several mechanisms by which cells maintain low intracellular calcium levels. Binding proteins, Na+/Ca2+ exchangers, mitochondrial uptake systems, the endoplasmic reticulum calcium pumps, and the plasma membrane calcium pumps (PMCAs) contribute significantly to the sequestration or extrusion of calcium (Carafoli 1991; Penniston and Enyedi 1998). Although the Na+/Ca2+ exchanger is thought to be a low-affinity and high-capacity extrusion mechanism, the PMCAs are of higher affinity and lower capacity in comparison. However, the PMCAs are not to be dismissed as inconsequential for calcium homeostasis (Carafoli 1991, 2002; Brandt and Vanaman 1998; Cartwright et al. 2005). The PMCAs can contribute up to 50% or more of the calcium extrusion from some cell types (Krizaj et al. 2002), including rat dorsal root ganglion neurons (Pottorf and Thayer 2002) and retinal bipolar neurons (Zenisek and Matthews 2000; Krizaj et al. 2002).
The mammalian PMCAs are derived from the expression of 4 genes, giving rise to approximately 25 major splice variants (Strehler and Zacharias 2001), which differ in their regulation by calcium/calmodulin, kinases, or acidic phospholipids (Zvaritch et al. 1990; Carafoli 1991, 1994). This variety serves cell-specific requirements to manage calcium levels in cellular microdomains. Therefore, establishing that a PMCA isoform is localized to a microdomain implies a specialized function of that PMCA to manage the local calcium levels and return them to basal levels in that microdomain following stimulation. For example, mouse retinal neurons have differential expression of PMCA isoforms in the rod and cone bipolar cells. This differential expression is most likely suited to the different requirements in these cells for calcium clearance (Carafoli 1991).
The Na+/Ca2+ exchanger is the major Ca2+ removal mechanism that has been examined in mammalian and Xenopus OSNs (Jung et al. 1994; Noe et al. 1997; Reisert and Matthews 2001), but the PMCAs have not been described. Therefore, the focus of the present study is to identify the presence of PMCA isoforms in the OSNs of the mouse. We show here that all 4 PMCA isoforms are expressed in OSNs and that the isoforms are not identically distributed, which suggest that specific isoforms may play different roles, for example, in calcium clearance after odor stimulation in the dendrite, cell body, and dendritic knob.
Materials and methods
Animals
All procedures were approved by the University’s Laboratory Animal Care and Use Committee and adhered to the National Institutes of Health Guide for the Care and Use of Laboratory Animals. Olfactory epithelia (OEs) were obtained from adult mice wild-type Black Swiss (courtesy of Gary Shull) or olfactory marker protein (OMP)–green fluorescent protein (GFP) transgenic mice, in which GFP is expressed from the OMP locus (courtesy of Peter Mombaerts). The animals were anesthetized and killed with CO2 asphyxiation followed by cervical dislocation.
Chemicals
Unless otherwise stated, all chemicals were obtained from Sigma (St Louis, MO).
Preparation of isolated mouse OSNs
The procedures were modified from those of Restrepo et al. (1993). Briefly, animals were euthanized using CO2 and cervical dislocation. The OE was removed from the animals and placed in 3 ml dissociation solution (in mM: 145 NaCl, 5 KCl, 1 pyruvic acid, 1 ethylenediaminetetraacetic acid, 20 Na–free N-[2-hydroxyethyl]piperazine-N′-[2-ethanesulfonic acid] [HEPES] at pH 7.2, with 0.125 mg/ml papain and 2 mM l-cysteine) where it was cut into small pieces. The small pieces were moved to a 5-ml glass tube where they were triturated with a wide-bore glass pipette. The solution was allowed to rest at room temperature for 14 min, after which 750 μl was removed (with most of the red blood cells). The olfactory neurons were detached from the supporting cells by gentle trituration through 3 different bore Pasteur pipettes and then filtered through nylon mesh to remove any bone and large pieces of tissue. The dissociated cells were mixed with 3 ml of stop solution (in mM: 145 NaCl, 5 KCl, 2 CaCl2, 1 MgCl2, 20 Na-free HEPES, 5 glucose, 1 mM pyruvic acid, 0.1 mg/ml leupeptin at pH 7.2) to stop the proteases used in dissociation. The dissociated cells were plated on concanavalin-A–coated cover slips for 10 min in Ringers.
Immunocytochemistry of isolated dissociated cells
All steps were carried out at room temperature. Plated OSNs were fixed in 4% (w/v) formaldehyde for 1 h, washed in phosphate-buffered saline (PBS) (1.8 mM NaH2PO4, 8.4 mM Na2HPO4, 150 mM NaCl, pH 7.4) (6 times for each 5 min), then incubated for 1 h in blocking buffer (PBS, 0.6% Triton X-100, 10% normal goat serum), and then incubated overnight in blocking buffer with anti-PMCA1, 2, 3, or 4 (1:250), anti–pan-PMCA (1:500), or anti–adenylyl cyclase III (1:250). The cells were washed in PBS (6 times for 5 min each) before the addition of fluorescent goat anti-rabbit secondary antibodies (Alexa Ig488 [green] or Alexa Ig656 [red], Invitrogen, Molecular Probes, Carlsbad, CA) at 1:250 for 60 min. The cells were washed in PBS (6 times for 5 min each) and visualized with deconvolution microscopy (DeltaVision, Applied Precision Life Science, Issaquah, WA).
Antibody sources were pan-PMCA antibody—Affinity BioReagents (ABR) (Golden, CO), catalog nr: MA3-914, host-mouse; pan-PMCA antibody—Alpha Diagnostics (San Antonio, TX), catalog nr: PMCA21-A, host-rabbit; pan-PMCA peptide—Alpha Diagnostics, catalog nr: PMCA21-P; PMCA1 antibody—ABR, catalog nr: PA1-914, host-rabbit; PMCA2 antibody—ABR, catalog nr: PA1-915, host-rabbit; PMCA3 antibody—ABR, catalog nr: PA1-916, host-rabbit; PMCA4 antibody—ABR, catalog nr: MA1-914, host-mouse; and adenylyl cyclase III—Santa Cruz (Santa Cruz, CA), catalog nr: sc-588, host-rabbit.
To determine specificity, the pan-PMCA antibodies were incubated for 5 h at room temperature in a total of 1 ml of either blocking buffer or blocking buffer with 40 μg of the commercially available peptide that was the antigen for antibody production (Alpha Diagnostics). The antibodies were then used in the deconvolution microscopy studies as described above.
Cell sorting and RT–polymerase chain reaction
The olfactory tissue was dissected from P20–P25 OMP–GFP mice, and the cells were dissociated in l-cysteine and papain (see “Preparation of Isolated Mouse OSNs”). Cells were then manually disrupted using wide-bore Pasteur pipettes and passed through a 150-μm filter. Papain activity was stopped with leupeptin. The suspension was then passed through a 53-μm mesh and the cells were spun at 600 × g for 5 min, and all but 1 ml of the supernatant was removed. Pelleted cells were then carefully resuspended, and bovine serum albumin was added (2% final concentration) to prevent the cells from sticking. The cells were then sorted via fluorescence-activated cell sorter into RLT buffer (Qiagen, Valencia, CA). RNA was extracted using the RNeasy MiniKit (Qiagen). A DNase treatment was performed directly on the Qiagen column, and the RNA was eluted using water. First-strand synthesis was performed using Thermoscript reverse transcriptase (Invitrogen). Sample quality was tested using a control sample without Thermoscript through real-time polymerase chain reaction (PCR). The internal control used was mouse glyceraldehyde-3-phosphate dehydrogenase. PCRs were performed at 55 °C or 60 °C (depending on primer requirements) for 1 min. The cDNA was diluted 1:10, and 45 cycles were run. PCR conditions were as follows: DNA was initially denatured for 5 min at 95 °C, followed by 45 cycles of 95 °C for 1 min, 60 °C for 1 min (except for PMCA3C where 55 °C was used), and 72 °C for 1 min. The final extension was for 15 min at 72 °C. Samples were run on a 1% agarose gel and stained using ethidium bromide. The primers (Table 1) were designed using known mouse PMCA sequences (www.informatics.jax.org) and primers published by Stauffer et al. (1993).
Table 1.
Primer sequences for RT-PCR of the PMCA cDNAs spanning the A and C splice sites of each gene
| Gene and splice site | Position in gene | Primer sequence |
|---|---|---|
| PMCA1A | 820-1034 | F: 5′-GTG GTC ACT GCT GTA GGT GTG-3′
R: 5′-TCA CCG TCC CCT CCT TCT TC-3′ |
| PMCA1C | 3041-3469 | F: 5′-TGG GCA CCT TTG TGG TGC AG-3′
R: 5′-GCT CTG AAT CTT CTA TCC TA-3′ |
| PMCA2C | 2908-3465 | F: 5′-AGA TCC ACG GCG AGC GCA AC-3′
R: 5′-CGA GTT CTG CTT GAG CGC GG-3′ |
| PMCA3C | 3097-3569 | F: 5′-TGT CCA CAG AAC AGT GGC TT-3′
R: 5′-ATG CCG CTG TCT ATG GCG TT-3′ |
| PMCA4A | 851-1185 | F: 5′-TCA CCC TCT TAG GAG CTA GTG A-3′
R: 5′-CCATTC TCG GCG CTG GAT CAC G-3′ |
| PMCA4C | 2950-3618 | F: 5′-CAA CGC TCG GAA GAT CCA CG-3′
R: 5′-TCA GAC CGG TGT CTC CAG GC-3′ |
Bands produced from PCR were cloned into TOPO 2.1 vector (Invitrogen). Positive colonies were isolated and sequenced to determine which splice variants were present in the neurons. Visual examination of the sorted cells showed that ~60–70% of the cells were OSNs. The sorting and RT–PCR analysis was repeated 4 times.
Results
Localization of PMCAs in isolated OSNs
To determine whether the PMCAs were expressed on the OSNs, we first treated dissociated olfactory neurons with pan-PMCA and adenylyl cyclase III antibodies to visualize the cilia and determine the general distribution of PMCAs (Figure 1A–C). The pan-PMCA antibody staining appears along the entire length of the cell from cilia to cell body, with the cilia highlighted by the anti–adenylyl cyclase III antibodies (Figure 1B,C, merge).
Figure 1.
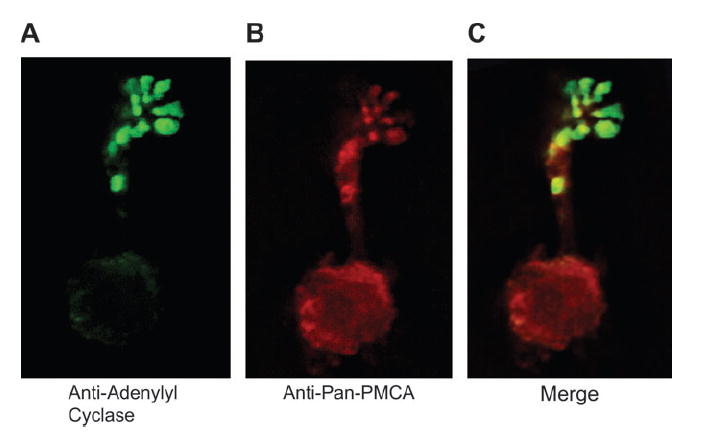
Immunofluorescence of isolated mouse olfactory neurons labeled with pan-PMCA antibody (red), anti–adenylyl cyclase III antibody (green), or both (A–C). Cells treated with secondary but not primary antibodies were used as control but are not shown. Scale bar = 10 μm.
To establish whether the antibody stainings were specific, we preincubated the antibodies with the antigen peptide against which the antibodies were produced. With this competition, the staining with the pan-PMCA antibodies is eliminated (Figure 2). These results match our unpublished results with OE analyzed on western blots.
Figure 2.
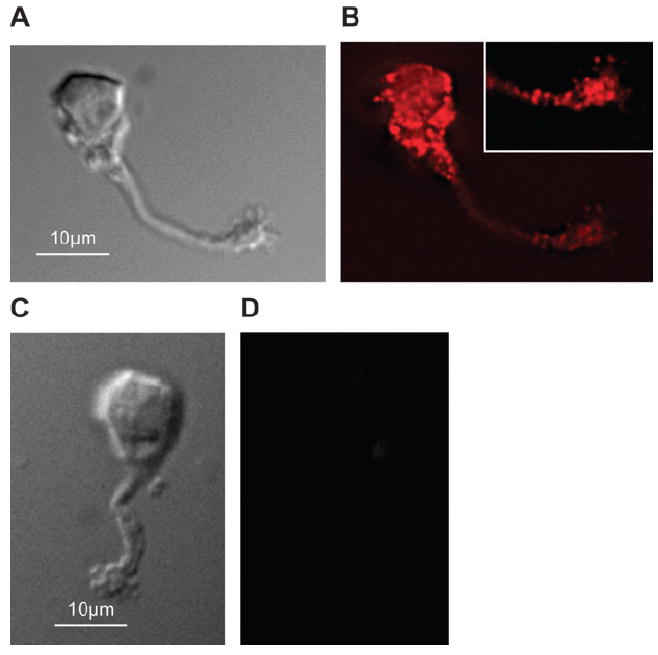
Immunofluorescence of isolated mouse olfactory neurons labeled with pan-PMCA antibody that was mock treated for control (B) or incubated with the cognate peptide (D) before incubation with the cells (A, C). Diffrential interference contrast (DIC) images of cells in (B, D). Inset is detail of cilia.
The PMCA isoform–specific antibodies (for isoforms 1–4) recognize epitopes on the cells as well (Figures 3 and 4). PMCA1 is expressed along the length of the OSN, with highest concentration in the cell body, especially where the dendrite enters (Figure 3A,B). PMCA2 consistently appears to be highly expressed in the cilia, dendritic knob region, and the soma of the OSN (Figure 3C,D). We believe that the immunoreactivity of the anti-PMCA2 antibody is specific because we observed no immunostaining with this antibody using OSNs from PMCA2 knockout mice (data not shown, mice are gift from Gary Shull). Antibodies for PMCA3 consistently stain the cell body, dendrite, and knob but not the cilia (Figure 3E,F). Antibodies for PMCA4 show reactivity in cilia, knob, and cell body but often not in the dendrite (Figure 4). No positive immunoreactivity is observed in control OSNs without the primary antibodies (data not shown).
Figure 3.
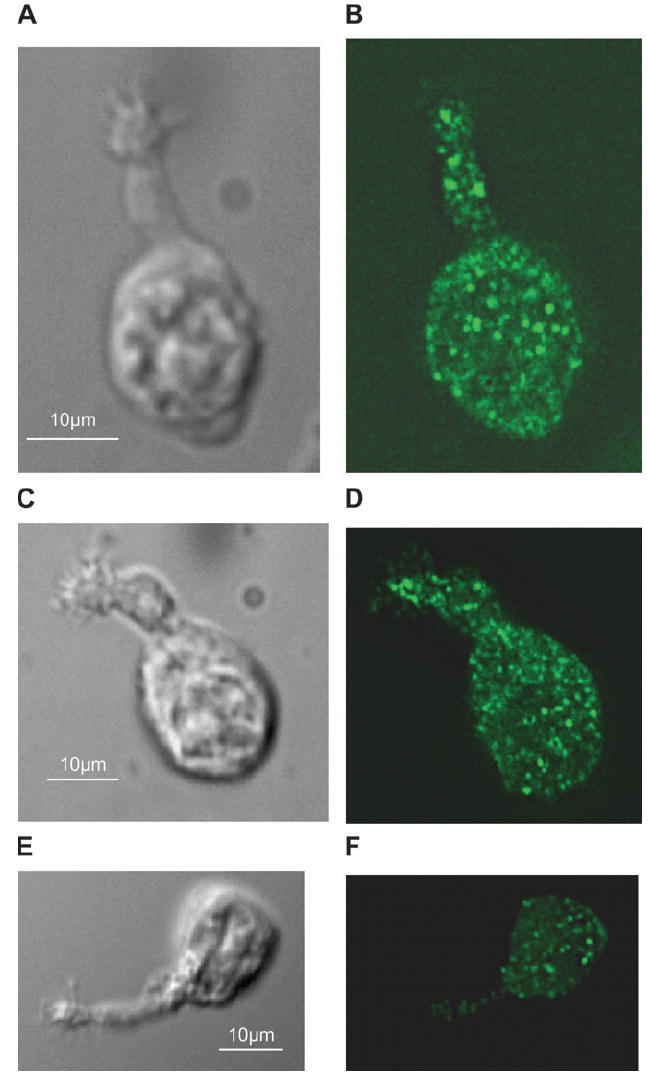
Immunofluorescence of isolated mouse olfactory neurons. (A, B) differential interference contrast (DIC) and anti-PMCA1 antibody fluorescence images of same cell. (C, D) DIC and anti-PMCA2 images of same cell. (E, F) Anti-PMCA3 and DIC image of the same cell. Controls in which the primary antibody was omitted showed no fluorescence and are not shown.
Figure 4.
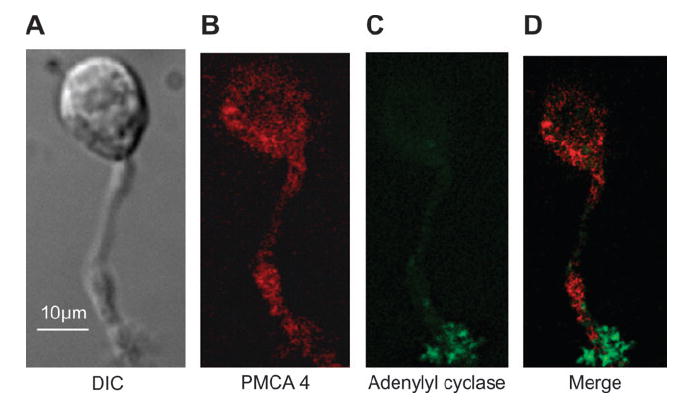
Immunofluorescence of isolated mouse olfactory neurons. (A) differential interference contrast image, (B) anti-PMCA4, (C) anti–adenylyl cyclase III, and (D) merged images.
RT–PCR of splice variants
We identified and isolated OSNs from the OE by sorting cells that express GFP from the OMP locus because OMP is a protein expressed in the OSNs and not in other cells of the OE. From the RNA of these cells, we produced cDNA to amplify the PMCA isoform–specific sequences at the 2 major splice sites, one in the N-terminal half (A site) and the other in the C-terminal half of the protein (C site). The sequenced amplification products allowed us to identify the splice variants of the PMCAs in the OSNs (Table 2). We were able to identify all the splice variants at the splice site of the 3′ half of the mRNA but only 2 of 4 splice variants of the splice site in the 5′ half of the mRNA. All the amplifications were successful in brain tissue mRNA, but after repeated attempts, we were unable to amplify the OSN 5′ half splice sites for PMCAs 2 and 3.
Table 2.
Splice variants of PMCAs expressed in OSNs
| Isoform | A site | C site |
|---|---|---|
| PMCA1 | X, N = 3 | b, N = 3 |
| PMCA2 | NA | b, N = 5 |
| PMCA3 | NA | b, N = 5 |
| PMCA4 | X, N = 3 | a, N = 5 |
NA, not yet determined; PMCA1AX, a 39-nucleotide intron remains within the sequence; PMCA1Cb, the entire 159-nucleotide intron is removed from the splice site; PMCA2Cb, both the 172-nucleotide intron and the 55-nucleotide intron are removed from the sequence; PMCA3Cb, a small 68-nucleotide intron and a 154-nucleotide intron are completely removed; PMCA4Ax, a 36-nucleotide intron remains in the finished sequence; and PMCA4Ca, a 175-nucleotide intron is excised from the final product. Splice variants of the four isoforms of PMCAs expressed in OSNs were determined by sequencing PCR products of cDNA from FACS sorted OSNs that express GFP. The PCR primers were chosen to amplify the regions of the variable splicing in the 5′ and 3′ portions of the cDNAs.
Discussion
In preliminary studies, we found strong expression of PMCAs using the pan-PMCA antibodies on OE and vomeronasal epithelium in the apical region where OSN dendritic knobs and cilia would be found (data not shown). These results suggested that the PMCAs were strategically placed to participate in clearance of calcium in apical ends of OSNs and vomeronasal sensory neurons. Therefore, we pursued a study of isolated OSNs to better determine the presence and distribution of the PMCAs. We found that the pan-PMCA antibodies stained the isolated OSNs from cilia to the cell body and that this staining could be competed with the peptide against which the antibodies were made. This led us to ask which among the 4 isoforms of PMCAs were expressed on the OSNs. The PMCAs showed different distributions of labeling along the OSNs surface. PMCAs 1 and 2 labeled cilia, dendritic knob, dendrite, and cell body (axon could not be visualized and probably is removed during isolation). PMCA3 showed similar labeling, with the exception of the cilia. PMCA4 consistently showed labeling of cilia, dendritic knob, and cell body with little staining of the dendrite.
The RT–PCR analysis of the transcripts for the PMCAs supports the immunofluorescence detection of all 4 isoforms in the OSNs, albeit with reservations that only 60–70% of the cells sorted were OSNs. The more important of the splice sites, which determine regulation by Ca/calmodulin or kinases, is the 3′ splice site, and the resulting splice variants are denoted by the letters a or b (Brandt and Vanaman 1998; Penniston and Enyedi 1998). PMCA1b is considered to be a “housekeeping” pump, and while it is activated by protein kinase A (PKA) and Ca/calmodulin, its affinity for Ca/calmodulin is relatively low (40–50 nM). PMCA2b is not known to be a substrate for PKA or protein kinase C (PKC), but it has the highest affinity for Ca/calmodulin (2–10 nM). PMCA3b is Ca/calmodulin independent, is constitutively active, and has an affinity for Ca/calmodulin that is lower than PMCA2. PMCA4a shows lower affinity for Ca/calmodulin (40–50 nM) and activates more slowly than PMCA2b and PMCA4b, but PMCA4a is activated by PKC.
A wave of Ca2+ begins at the cilia of the OSN and enters the dendritic knob following odor stimulation of the cilia (Leinders-Zufall et al. 1997), and the presence of PMCAs 1, 2, and 4 in the cilia and dendritic knob hints at their roles in returning the elevated Ca2+ levels back to the very low resting levels of about 50–60 nM (Restrepo et al. 1993; Bozza and Kauer 1998; Schild and Restrepo 1998) following odor stimulation of the cilia. The locations for PMCA4 are particularly consistent with the predictions of Jung et al (1994), who inferred that the PMCAs that function in addition to the high-capacity low-affinity Na+/Ca2+ exchanger in Xenopus OSNs will be located in the knob and soma.
The Na+/Ca2+ exchanger has a relatively low affinity for Ca2+ (Km 1–5 μM) but high capacity to extrude Ca2+ (Zvaritch et al. 1990; Carafoli 1994, 2002; Zenisek and Matthews 2000; Strehler and Zacharias 2001), which suggests to us that it acts to remove the peak levels of Ca2+ from the OSNs after stimulation. The PMCAs in general have much higher affinity for Ca2+ (Km 0.6 μM or less), making them appropriate to finish removing Ca2+ to the former resting levels (Hilfiker et al. 1994; Elwess et al. 1997; Brandt and Vanaman 1998). PMCA2 is the isoform that is most sensitive to Ca2+/calmodulin (Km 2–4 nM), which activates the pump activity, and PMCA2b is the variant with the highest affinity for Ca2+/calmodulin (Km 2.1 nM) (Hilfiker et al. 1994; Elwess et al. 1997; Brini et al. 2003). PMCA2 (splice variants a and b) remains activated at low Ca2+–calmodulin levels (nM range) and will still be able to extrude Ca2+ even when [Ca2+] falls below 100 nM (Hilfiker et al. 1994; Elwess et al. 1997; Penniston and Enyedi 1998; Strehler and Zacharias 2001; Brini et al. 2003). The array of PMCAs that we have located in the knob and cilia should have appropriate activity and affinity for Ca2+/calmodulin to reduce free calcium to resting levels.
Conclusion
We report for the first time the presence of PMCA isoforms in mouse olfactory neurons. The presence of PMCAs in the cilia and dendritic knob region of OSNs positions PMCAs 1, 2, and 4 to assist in returning Ca2+ to basal levels following odorant stimulation. The distribution of PMCA1 suggests a general homeostatic role for Ca2+regulation. The distribution of PMCA4 best fits the prediction by Jung et al. (1994) for a PMCA that functions in calcium clearance after olfactory stimulation.
Acknowledgments
We thank National Institutes of Health for grants R21 DC 006643, R01 DC 00721, R01 DC006939, NCI PHS22435 for sequence and RT–PCR analysis and P20 RR16435 for imaging assistance. We also thank Tim McClintock for advice on cell sorting and RT–PCR.
Footnotes
For permissions, please e-mail: journals.permissions@oxfordjournals.org
References
- Borisy RR, Ronnett GV, Cunningham AM, Juifs D, Beavo J, Snyder SH. Calcium/calmodulin activated phosphodiesterase expressed in olfactory receptor neurons. J Neurosci. 1992;12:915–23. doi: 10.1523/JNEUROSCI.12-03-00915.1992. [DOI] [PMC free article] [PubMed] [Google Scholar]
- Bozza TC, Kauer JS. Odorant response properties of convergent olfactory receptor neurons. J Neurosci. 1998;18:4560–9. doi: 10.1523/JNEUROSCI.18-12-04560.1998. [DOI] [PMC free article] [PubMed] [Google Scholar]
- Brandt PC, Vanaman TC. Calmodulin and ion flux regulation. In: Van Eldik L, Watterson DM, editors. Calmodulin and signal transduction. New York: Academic Press; 1998. pp. 397–471. [Google Scholar]
- Brini M, Coletto L, Pierobon N, Kraev N, Guerini D, Carafoli E. A comparative functional analysis of plasma membrane Ca2+ pump isoforms in intact cells. J Biol Chem. 2003;278:24500–8. doi: 10.1074/jbc.M300784200. [DOI] [PubMed] [Google Scholar]
- Carafoli E. Calcium pump of the plasma membrane. Physiol Rev. 1991;71:129–53. doi: 10.1152/physrev.1991.71.1.129. [DOI] [PubMed] [Google Scholar]
- Carafoli E. Biogenesis: plasma membrane calcium ATPase: 15 years of work on the purified enzyme. FASEB J. 1994;8:993–1002. [PubMed] [Google Scholar]
- Carafoli E. Calcium signaling: a tale for all seasons. Proc Natl Acad Sci USA. 2002;99:1115–22. doi: 10.1073/pnas.032427999. [DOI] [PMC free article] [PubMed] [Google Scholar]
- Cartwright EJ, Schuh K, Neyses L. Calcium transport in cardiovascular health and disease—the sarcolemmal calcium pump enters the stage. J Mol Cell Cardiol. 2005;39:403–6. doi: 10.1016/j.yjmcc.2005.04.007. [DOI] [PubMed] [Google Scholar]
- Elwess NL, Filoteo AG, Enyedi A, Penniston JT. Plasma membrane Ca2+ pump isoforms 2a and 2b are unusually responsive to calmodulin and Ca2+ J Biol Chem. 1997;272:17981–6. doi: 10.1074/jbc.272.29.17981. [DOI] [PubMed] [Google Scholar]
- Hilfiker H, Guerini D, Carafoli E. Cloning and expression of isoform 2 of the human plasma membrane Ca2+ ATPase. Functional properties of the enzyme and its splicing products. J Biol Chem. 1994;269:26178–83. [PubMed] [Google Scholar]
- Jung A, Lischka FW, Engel J, Schild D. Sodium/calcium exchanger in olfactory receptor neurones of Xenopus laevis. Neuroreport. 1994;5:1741–4. doi: 10.1097/00001756-199409080-00013. [DOI] [PubMed] [Google Scholar]
- Kleene SJ. Both external and internal calcium reduce the sensitivity of the olfactory cyclic-nucleotide-gated channel to cAMP. JNeurophysiol. 1999;81:2675–82. doi: 10.1152/jn.1999.81.6.2675. [DOI] [PubMed] [Google Scholar]
- Krizaj D, Demarco SJ, Johnson J, Strehler EE, Copenhagen DR. Cell-specific expression of plasma membrane calcium ATPase isoforms in retinal neurons. J Comp Neurol. 2002;451:1–21. doi: 10.1002/cne.10281. [DOI] [PMC free article] [PubMed] [Google Scholar]
- Leinders-Zufall T, Rand MN, Shepherd GM, Greer CA, Zufall F. Calcium entry through cyclic nucleotide-gated channels in individual cilia of olfactory receptor cells: spatiotemporal dynamics. J Neurosci. 1997;17:4136–48. doi: 10.1523/JNEUROSCI.17-11-04136.1997. [DOI] [PMC free article] [PubMed] [Google Scholar]
- Noe J, Tarelius E, Boekoff I, Breer H. Sodium/calcium exchanger in rat olfactory neurons. Neurochem Int. 1997;30:523–31. doi: 10.1016/s0197-0186(96)00090-3. [DOI] [PubMed] [Google Scholar]
- Penniston JT, Enyedi A. Modulation of the plasma membrane Ca2+ pump. J Membr Biol. 1998;165:101–9. doi: 10.1007/s002329900424. [DOI] [PubMed] [Google Scholar]
- Pottorf WJ, Thayer SA. Transient rise in intracellular calcium produces a long-lasting increase in plasma membrane calcium pump activity in rat sensory neurons. J Neurochem. 2002;83:1002–8. doi: 10.1046/j.1471-4159.2002.01221.x. [DOI] [PubMed] [Google Scholar]
- Reisert J, Matthews HR. Response properties of isolated mouse olfactory receptor cells. J Physiol. 2001;530:113–22. doi: 10.1111/j.1469-7793.2001.0113m.x. [DOI] [PMC free article] [PubMed] [Google Scholar]
- Restrepo D, Okada Y, Teeter JH. Odorant-regulated Ca2+ gradients in rat olfactory neurons. J Gen Physiol. 1993;102:907–24. doi: 10.1085/jgp.102.5.907. [DOI] [PMC free article] [PubMed] [Google Scholar]
- Schild D, Restrepo D. Transduction mechanisms in vertebrate olfactory receptor cells. Physiol Rev. 1998;78:429–66. doi: 10.1152/physrev.1998.78.2.429. [DOI] [PubMed] [Google Scholar]
- Stauffer T, Hilfiker H, Carafoli E, Strehler E. Quantitative analysis of alternative splicing options of human plasma membrane calcium pump genes. J Biol Chem. 1993;268:25993–6003. [PubMed] [Google Scholar]
- Strehler EE, Zacharias DA. Role of alternative splicing in generating isoform diversity among plasma membrane calcium pumps. Physiol Rev. 200181:21–50. doi: 10.1152/physrev.2001.81.1.21. [DOI] [PubMed] [Google Scholar]
- Trudeau MC, Zagotta WN. Calcium/calmodulin modulation of olfactory and rod cyclic nucleotide-gated ion channels. J Biol Chem. 2003;278:18705–8. doi: 10.1074/jbc.R300001200. [DOI] [PubMed] [Google Scholar]
- Wayman GA, Impey S, Storm DR. Calcium inhibition of type III adenylyl cyclase in vivo. J Biol Chem. 1995;270:21480–6. doi: 10.1074/jbc.270.37.21480. [DOI] [PubMed] [Google Scholar]
- Zenisek D, Matthews G. The role of mitochondria in presynaptic calcium handling at a ribbon synapse. Neuron. 2000;25:229–37. doi: 10.1016/s0896-6273(00)80885-5. [DOI] [PubMed] [Google Scholar]
- Zvaritch E, James P, Vorherr R, Falchetto R, Modyanov N, Carafoli E. Mapping of functional domains in the plasma membrane Ca2+ pump using trypsin proteolysis. Biochemistry. 1990;29:8070–6. doi: 10.1021/bi00487a012. [DOI] [PubMed] [Google Scholar]