Abstract
In this article, a novel protocol for mechanical testing, combined with finite element modeling, is presented that allows the determination of the elastic modulus of normal and fibrotic murine livers and is compared to an independent mechanical testing method. The novel protocol employs suspending a portion of murine liver tissue in a cylindrical polyacrylamide gel, imaging with a microCT, conducting mechanical testing, and concluding with a mechanical property determination via a finite element method analysis. More specifically, the finite element model is built from the computerized tomography (CT) images, and boundary conditions are imposed in order to simulate the mechanical testing conditions. The resulting model surface stress is compared to that obtained during mechanical testing, which subsequently allows for direct evaluation of the liver modulus. The second comparison method involves a mechanical indentation test performed on a remaining liver lobe for comparison. In addition, this lobe is used for histological analysis to determine relationships between elasticity measurements and tissue health. This complete system was used to study 14 fibrotic livers displaying advanced fibrosis (injections with irritant), three control livers (injections without irritant), and three normal livers (no injections). The moduli evaluations for nondiseased livers were estimated as 0.62±0.09 kPa and 0.59±0.1 kPa for indenter and model-gel-tissue (MGT) assay tests, respectively. Moduli estimates for diseased liver ranged from 0.6–1.64 kPa and 0.96–1.88 kPa for indenter and MGT assay tests, respectively. The MGT modulus, though not equivalent to the modulus determined by indentation, demonstrates a high correlation, thus indicating a relationship between the two testing methods. The results also showed a clear difference between nondiseased and diseased livers. The developed MGT assay system is quite compact and could easily be utilized for controlled evaluation of soft-tissue moduli as shown here. In addition, future work will add the correlative method of elastography such that direct controlled validation of measurement on tissue can be determined.
I. INTRODUCTION
Investigating the mechanical properties of soft tissue has an important impact on many application fronts within biomedical engineering. The nature of soft tissue is that of a composite material whereby collagen and elastin fibers contribute most substantively to its mechanical properties. Hepatic fibrosis is an example of a disease where the elastic properties generally increase as the disease progresses due to the elevated deposition of collagen. Though the distribution of the scar tissue within the liver will vary based on the cause of the fibrosis, the response is the same for all types; i.e. a cascade of events occurs that causes stellate cells to become activated, and in turn, contract and produce scar tissue. A process known as fibrogenesis degrades the liver’s normal matrix and releases cytokines, which cause inflammation. All of these effects result in disruption of the liver’s normal function.1,2 Quantifying the mechanical properties with novel testing assays or imaging techniques could be an excellent way to stage disease and outcomes. In recent years, noninvasive imaging techniques have been a very active area of research, i.e., the field known as elastography.3–7 Within this domain, some example applications using mechanical properties to assess organ health have been forthcoming, including breast,8–13 prostate,14,15 thyroid,16 and intravascular evaluations.17,18
While the recognition that mechanical properties may be important for tissue characterization, detailed quantitative experimental systems correlating imaging modality and independent assessment have been difficult with real tissue. For example, one popular method of mechanical property interrogation is compression testing and consists of compressing a known geometric sample between two plates and measuring the applied displacements and resulting forces.19 From these data, various mathematical constitutive models of the tissue can be generated that relate the stress, strain, and rates thereof. While this testing is quite routine, the tissue sample preparation can be a challenge, especially with respect to small irregularly shaped samples. Due to this restriction, mechanical indentation techniques have become a popular method for modulus assessment. A variety of different approaches to indentation testing have been cited in the literature.20–24 However, eliciting a modulus value from indenter testing requires significant experimental assumptions, the basis of which is dependent on many factors, such as sample size and shape, indenter type, and boundary conditions. This complexity in testing makes a uniform testing protocol for different tissue samples equally as challenging as the previous sampling issue. In addition, as the results in this article indicate, some variability between tests is possible based on the mechanism of disease onset. In any case, the need for controlled independent testing that can be directly verified with noninvasive imaging techniques is evident.
This article presents a novel ex vivo model-gel-tissue (MGT) assay system that combines mechanical testing, imaging, and finite element modeling to monitor the changes in mechanical properties of a murine liver fibrosis model. The purpose of this protocol was to provide an independent tissue evaluation system that could be adapted to a variety of applications and would assist in quantifying elastography techniques. The protocol calls for tissue samples to be embedded in a cylindrical gel that is used in compression testing for modulus analysis and is equally amenable to elastography evaluation. In order to develop this system, the ability of the assay to accurately assess the modulus of the embedded tissue must be verified. Thus, to qualify our results, separate indentation testing was performed and compared to the MGT assay technique. While many previous studies have been predominantly concerned with human or large animal evaluations, this protocol is focused on small animal models (i.e., rodent). The obvious advantage of targeting small animal applications is that it allows for rapid evaluation of many subjects, multimodal image registration (magnetic resonance, computed tomographic, positron emission tomography, bioluminescence, etc.), access to numerous disease models, and the ability to test pharmacological therapeutics within these systems. This article serves as a description of the testing protocol as well as an initial evaluation of its capabilities based on the modulus assessment of 14 fibrotic and six non-diseased livers. The separate indentation tests were consistent with the MGT assay results for control and normal livers. While stiffening of the tissue was measured by both MGT assay and indentation tests, there was inconsistency among the absolute values established for fibrotic livers (consistency for the normals/controls). Interestingly though, the offset between the values for fibrotic stiffness among the two testing methods was correlated. It is also shown that statistical differences in modulus values for fibrosis and controls can be detected in both the MGT assay and indentation tests. In addition, the results from the liver testing are similar to those found in the literature for normal and fibrotic human liver testing post mortem.2
II. METHODS
The complete testing framework used to evaluate fibrotic and nondiseased murine liver involves a series of steps as shown in Fig. 1. This three-pronged investigation sought to characterize liver tissue in three distinct ways: (1) Mechanical testing with an ex vivo MGT assay, (2) mechanical testing by indentation, and (3) tissue characterization for disease progression via histochemical staining. This system of tissue evaluation allows the investigation of the MGT assay as compared to traditional indentation testing, and correlation of elasticity measurements with histological data.
Fig. 1.
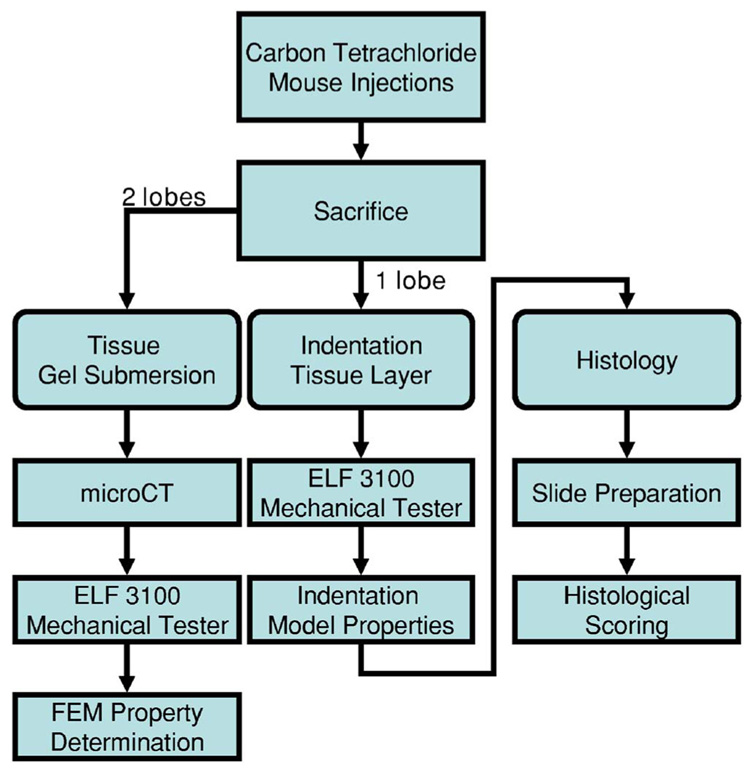
General testing framework for murine liver system.
II.A. Fibrosis model and disease scoring
Adult C57 mice (18–20 g, 8–10 weeks of age) purchased from Jackson Laboratory were housed in cages with a 12-h light/dark cycle (6 a.m. to 6 p.m.) and provided with rodent chow and tap water ad libitum. All animals received humane care in compliance with the institution’s guidelines, and animal procedures were approved by the Institutional Animal Care and Use Committee, which is certified by the American Association for Accreditation of Laboratory Animal Care. The animals were divided into three groups—fibrosis, controls, and normals. The first group of mice, the fibrotic group, consisted of 14 animals that received weekly intraperitoneal (IP) injections of carbon tetrachloride (Sigma Chemical, St. Louis, MO) mixed with olive oil (Sigma Chemical, St. Louis, MO) in a 1:4 ratio, respectively. Each dose of CCl4 was 1 ml/kg per injection. The second group of mice consisted of three animals and was the control group. This group received weekly IP injections of pure olive oil. The third group, the normal group, consisted of three animals and did not receive IP injections (of note these mice were several weeks older than groups 1 and 2). Diseased mice were sacrificed at variable time points between two and ten weeks of treatment. Using histological assessment, only mice that were of Ishak fibrosis scores of 3 or greater (advanced fibrosis) were selected for comparison. With respect to controls, a mouse was sacrificed after five, six, and eight weeks of treatment. The liver was removed and divided into three sections. The first and largest section consisted of two of the four lobes, and was embedded in the polyacrylamide gel. The third lobe was preserved for use in indenter testing and histological analysis, and the fourth lobe was frozen for future analysis.
Histological analysis of the liver tissue was performed using the liver lobe designated for indenter testing. After indenter testing, the tissue was fixed in 10% buffered formalin, dehydrated in graded ethylic alcohol, and embedded in paraffin. Sections were generated with a thickness of 5 µm and were stained with hematoxylin/eosin (H/E) or 0.1% Sirius red. The H/E stained sections were analyzed under light microscope for histopathological assessment. The Sirius red stained sections were used for fibrosis evaluation. These specimens were scored using Ishak (score 0–6) systems, which is commonly used in clinical pathology. The Ishak system grades mild fibrosis as 0–1, advanced fibrosis as 2–4, and cirrhosis as 5–6.25
II.B. Model-gel-tissue (MGT) assay construction
In order to provide a controllable evaluation technique, a system of embedding extracted murine livers in a cylindrical gel has been developed. This gel matrix provides a reference material for evaluation, provides a measurable contrast in elasticity between the gel and liver, and allows for use of true tissue shape by building a model based on microCT scans of the gel. In addition, the cylindrical gel could easily be utilized in multiple imaging modalities for possible elastography assessment. Given that the gel modulus is being used as the elastic reference for liver property assessment, the gel selection is of considerable importance. Two materials are commonly mentioned in literature as being utilized for phantom generation and submersion techniques: agarose (Research Products International Corp, Mt. Prospect, IL) and polyacrylamide (BioRad Laboratories, Hercules, CA). Our work required two key characteristics of the gel utilized for liver submersion: (1) the gel modulus must be variable and relatively simple to control, and (2) gel properties needed to be relatively static over time, i.e. shifts due to small protocol variations in testing time and ambient temperature needed to be minimized, and viscoelastic effects need to subside quickly. After evaluation of both gels, we found polyacrylamide to have a more favorable behavior in these areas.
In addition to stable gel properties, the gel-tissue samples also needed to be appropriately shaped for both imaging applications and material testing. In order to make our system amenable to compression testing, this meant a small sample size with a uniform shape. To achieve this, the gel samples were generated in Petri dishes that had a known diameter. This created a cylindrical shape with a measurable surface area and a consistent height. The process of tissue submersion involved a simultaneous tissue resection and mixing of base components of the polyacrylamide gel (BioRad Laboratories, Hercules, CA). The components were 1 molar Tris buffer, deionized water, and ammonium persulfate (APS). Graphite flakes (Sigma-Aldrich Chemie GmbH, Buchs, Switzerland) were also added to the base solution; these were necessary to provide ultrasound contrast for imaging although this will not be reported in this work at this time. During liver resection, the buffer solution was mixed as indicated in Table I. Once the liver was removed and sectioned, the portion dedicated to the gel sample was weighed using a digital balance. In order to generate the individual gel sample, the buffer solution and acrylamide/polyacrylamide were mixed in a Petri dish according to the proportions indicated in Table I. To provide a perceivable distinction between the liver and gel in the computed tomography (CT) scans for segmentation purposes, a CT contrast agent, Optiray (Mallinckrodt Inc, Hazelwood, MO), was included in the gel mixture. The liver sample was then suspended in the liquid gel using forceps and TEMED was added, which initiates the polymerization reaction to cause solidification of the gel. The solution was agitated during the solidification process, which required approximately 2 min, using pipette mixing; the agitation prevented settling of the graphite flakes. This process was performed for the fibrosis liver, the control liver, and the normal liver; gels with a fibrotic liver embedded are referred to as fibrosis gels, gels with a control liver embedded are referred to as control gels, and gels with a normal liver are referred to as normal gels. In addition, a reference gel was generated, which was produced as previously described, without the addition of the liver sample. This reference gel was utilized in material testing in order to evaluate the modulus of the polyacrylamide gel generated on the occasion of each liver evaluation. Fourteen fibrosis gels, three control gels, and three normal gels were generated over the course of the research.
TABLE I.
Polyacrylamide Gel Recipe.
| Polyacrylamide Gel Recipe | |
|---|---|
| Buffer Solution | Individual Gel Recipe (5% Polyacrylamide) |
| 38.2 mL deionized H2O | 6.67 mL buffer solution |
| 1.3 mL 1 M Tris buffer | 1.33 mL 30% |
| Acrylamide/Polyacrylamide | |
| 0.5 mL 10% APS solution | 0.2 mL Optiray CT contrast |
| 1.5 g graphite | 0.07 mL TEMED |
II.C. Imaging
After the gel had congealed, microCT scans were obtained using the Imtek microCAT II scanner (Concord/CTI, Knoxville, TN). The resolution of the microCT image voxel was 115 µm × 115 µm × 115 µm. These scans were later utilized for finite element model generation. The gel sample was placed on the scanner bed and made level by adjusting its positioning based on prescan information from the scanner. CT scans were obtained for fibrosis, control, and normal gels, as well as for the reference gels. After scanning, the gels were transferred to the material testing lab and immediately tested. The total time between sacrifice and testing ranged from 1–2 h.
II.D. Indenter and traditional compressive material testing
Individual liver lobes obtained during resection of the liver were placed in 0.9% NaCl and refrigerated until testing could be performed, which was less than one hour. Indenter tests were performed on the liver lobes in order to acquire an elasticity value to which results from the MGT assay could be compared. All material testing was performed utilizing the Enduratec Electroforce 3100 tester (Bose, Enduratec Systems Group, Eden Prairie, Minnesota). The material tester setup is shown in Fig. 2. A 50 g transducer (Honeywell Sensotec, Columbus, Ohio) was attached to the upper arm of the tester, the indenter tip was attached to the transducer using a coupling device manufactured for this purpose, and the tip was lubricated with nonstick oil-based lubricant spray. The indenter testing configuration is shown in Fig. 3. The indenter tip used in all tests was a spherical tip with a radius of 1.5 mm. A spherical tip was chosen in order to minimize damage to the tissue so that the liver lobes could subsequently be utilized for histological testing. The liver lobes were placed on the lower platen of the material tester, and the force and displacement values were zeroed prior to lowering the indenter. The indenter tip was manually lowered until it made contact with the liver surface, which was determined by visual inspection and by observation of a sudden increase in the force values registered by the transducer. Contact between the liver and indenter was regulated between specimens by maintaining a force value between 0.01 and 0.03 g at initial contact. The liver lobe was situated on the platen relative to the indenter so as to provide a uniform surface for indentation. The indentation occurred at the thickest portion of the liver, in an area where there were no steep surface gradients.
Fig. 2.
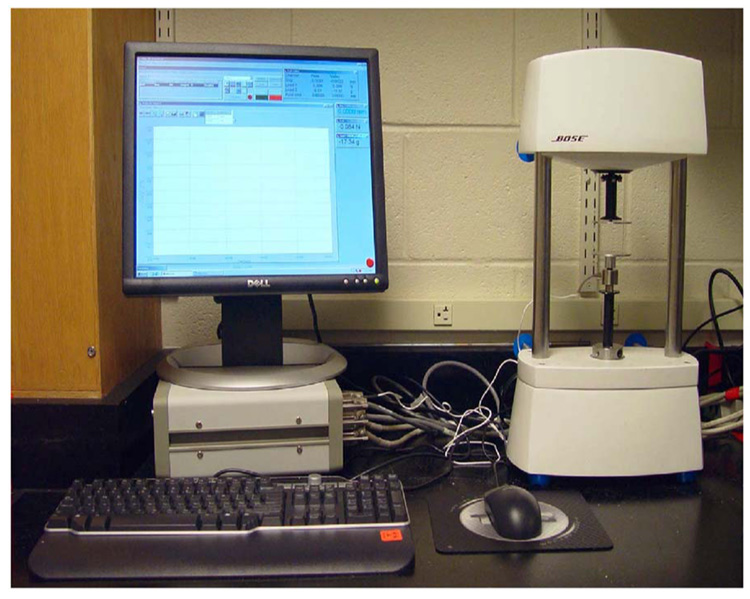
Material testing system used for gel and liver testing.
Fig. 3.
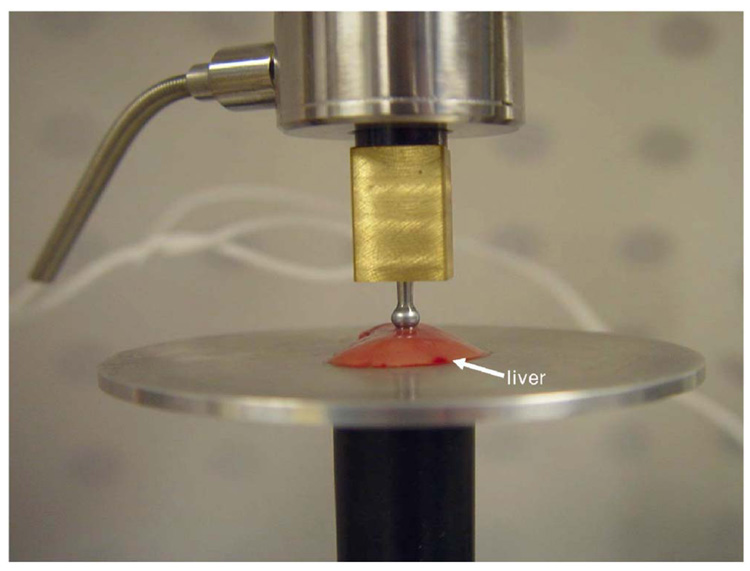
Close-up of liver indentation setup. The liver was positioned so that contact with the indenter occurred at a point where the liver was uniform in height.
Development of an indentation testing assay that correlated to the compression protocol was necessary in order to generate results that could be analyzed relative to one another. However, in indentation testing, it is necessary that the depth of indentation not exceed the radius of the indenter tip to prevent aberrant behavior of the indentation model. In order to remain within the confines of the indenter system, the indentation tests consisted of three indentations to a depth of 0.4 mm. Each indentation was held for a 60 second dwell period, which allowed the viscoelastic effects to dissipate, and then released. The indenter returned to zero position, and remained there for 60 s, at which point another indentation occurred in the same manner. In addition, each liver was measured after testing using a digital caliper to determine the thickness of the specimen at the region of indentation for use in modulus calculation.
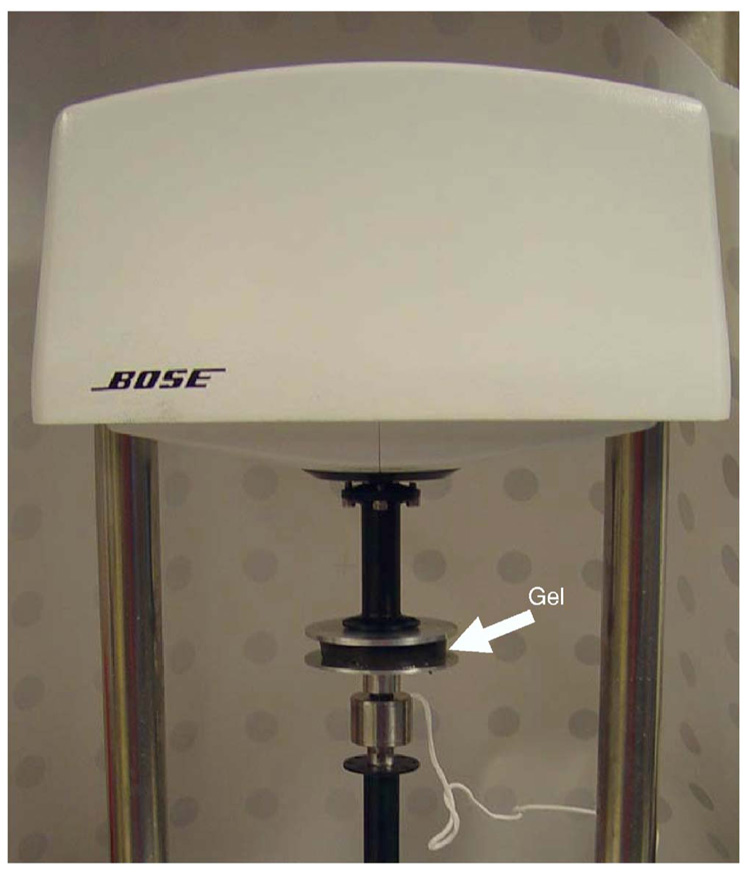
The gel-tissue cylindrical specimen was tested using traditional compression. Due to the increased size of the specimen, the load cell used was a 250 g transducer (Honeywell Sensotec, Columbus, Ohio). Figure 4 illustrates the setup for compression testing. Each gel was weighed using an analytical balance and measured using digital calipers (diameter and height) prior to testing. Both surfaces of the gel were lubricated, again using the nonstick oil-based lubricant spray. The material tester was zeroed after placing the gel specimen on the platen, so that the weight of the gel was not considered in the measured force. The platen was then lowered until initial contact with the gel surface. This was determined by visual cues as well as a negligible increase in the force reading. For the compression case, the initial force values were limited to between 1 and 2 g. A precompression of 0.3 mm was applied to each gel prior to testing in order to ensure full contact with the gel surface (~3% – 5% prestrain). The testing protocol consisted of a series of step compressions, applied in 0.05 mm increments, from 0.35 mm to 0.65 mm (~max strain 6.5%–9%). After each step, the compression dwelled for 60 s, as was implemented in the indentation, to allow the force to reach steady state. The test was performed twice for each gel.
Fig. 4.
Gel compression testing setup.
II.E. Computational model for indentation and modelgel-tissue assay
With respect to the indentation testing data, the mechanical properties were determined using the correlation model suggested by Stevanocić et al., which concerned the contact between a rigid sphere and an elastic layer bonded to a rigid substrate.26 Our assumption is that the boundary defined between the liver and the bottom platen experiences no-slip conditions, and hence the liver can be modeled as an elastic medium bonded to the rigid platen. Stevanocić et al. developed a set of equations that was able to normalize the data presented by Chen and Engel27 for a variety of varying modulus combinations by utilizing a dimensionless radius and layer thickness, which caused all of the curves to collapse onto one normalized curve. The correlation equation derived by Stevanocić et al. is
| (1) |
where c1, c2, and c3 are correlation coefficients, which, based on the analysis by Stevanocić et al. are defined as −1.73, 0.734, and 1.04, respectively, a represents the contact radius, aL is the contact radius corresponding to an infinitely thick elastic layer, and t is the layer thickness. The contact radius, a, for a spherical indenter can be calculated from:
| (2) |
where ρ is the radius of the spherical indenter tip and d is the penetration depth of the indenter. To calculate the contact radius for an infinitely thick elastic layer, the Hertz relation must be consulted:
| (3) |
where E denotes the elastic modulus of the medium, ν the Poisson’s ratio, and F the applied load. For this research, if a Poisson’s ratio is assumed for the tissue, all of the elements of Eq. (3) are known except for Young’s modulus of the tissue. In past work, we have found for general soft tissue organs that 0.45 has captured first order elasticity effects for liver and brain reasonably well.28–31 This value would correlate with a 9:1 ratio of the Lamé constants (λ:G with G the shear modulus, and λ the bulk modulus) which is reasonably below the convention for Poisson locking (sometimes called mesh locking and typically has λ≫G, or ν→0.5) which is important for the MGT assay. Substituting Eq. (2) and Eq. (3) into Eq. (1) and solving for the modulus gives:
| (4) |
The modulus for each liver lobe was calculated for each of the three indentations. The indentation depth and applied force were both calculated as the average respective value over the last 20 sampling points of the dwell, at which time the viscoelastic response had dissipated. The three calculated modulus values were then averaged to obtain the final elastic modulus value for each liver.
For the traditional compression test, a more complex model analysis was performed. Finite element analysis was combined with physical material testing to determine the modulus of interest. A critical component in this analysis was the selection of the model to represent the continuum of interest. In this work, we have chosen a Hookean elastic solid. This model assumes a symmetric isotropic specimen in equilibrium under small strains. These assumptions linearize the strain tensor and simplify Cauchy’s law from 36 stiffness constants to 2 (Young’s modulus E, and Poisson’s ratio ν) and use the traditional mechanical equilibrium equation. Similar to the indentation tests, Poisson’s ratio was assigned to be 0.45. However, sensitivity tests with respect to Poisson’s ratio and the models associated with indentation and model-gel analysis are summarized at the end of this section.
Based on the equations for linear elastic deformation, a finite element system was developed for the gel-tissue domain. The details of this analysis are given in the Appendix. An iterative matrix solver was used to solve the sparse FE system which used a biconjugate gradient solver with an incomplete LU preconditioner.32 To construct the domain, microCT image volumes were acquired prior to compression. In all experiments, the control, normal, and fibrosis gel systems were imaged and the gel and tissue were segmented using AnalyzeAVW (Mayo Foundation for Medical Education and Research, Rochester, MN). Due to the doping of the gel with CT contrast, it was relatively simple to extract the liver volume using the standard morphometric operations of threshholding and region growing. The segmented volumes were found to agree with estimated volumes based on an assumed liver tissue density and the measured mass of the tissue. Upon completion of the segmentation, a surface description was generated and used as a bounding description for a custom-built tetrahedral mesh generator.33 Figure 5 illustrates the geometric model construction process with Fig. 5(a) demonstrating a representative CT slice of the murine liver within a contrast-doped gel. Figure 5(b) illustrates a homogeneous gel tetrahedral mesh (as can be seen, small gel surface defects were even captured with the process) and Fig. 5(c) illustrates the extracted liver tetrahedral mesh within the gel system.
Fig. 5.
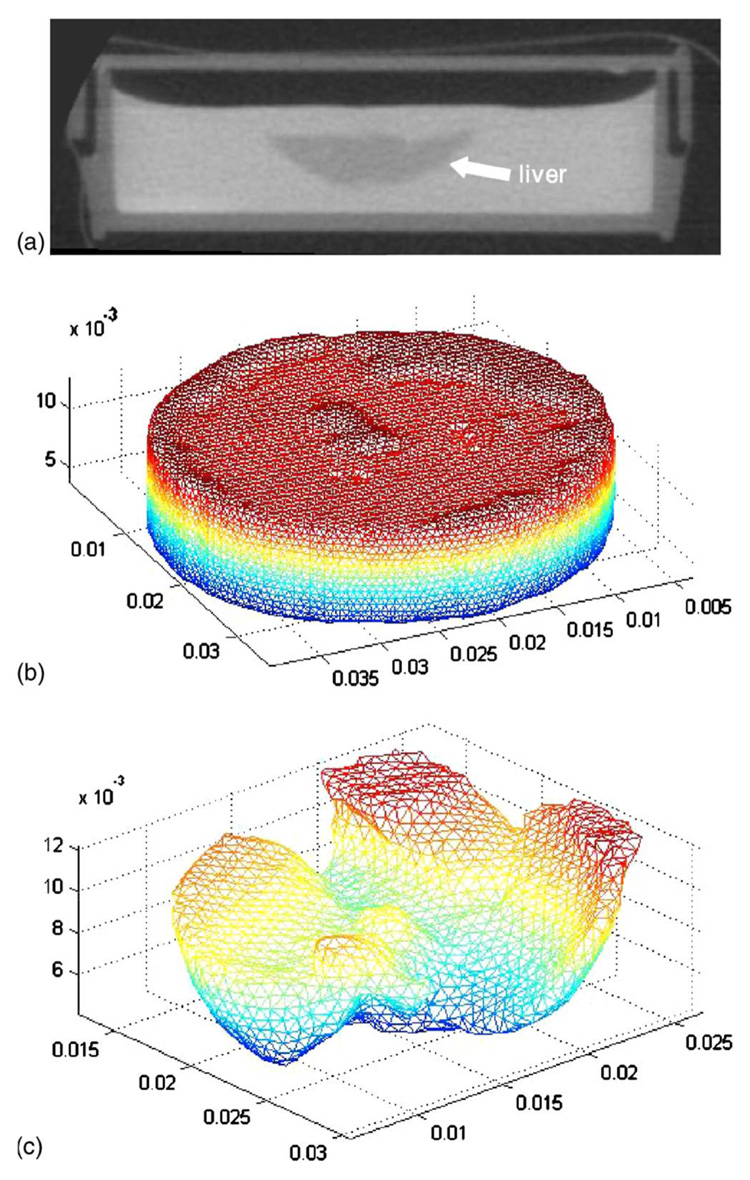
Computational domain construction with (a) liver microCT, (b) gel tetrahedral mesh, and (c) liver tetrahedral mesh extracted from gel/liver model.
The boundary conditions for the model reflected an unconfined compression that prescribed a fixed normal displacement (Dirichlet boundary conditions) on the majority of the top surface but was allowed to slip laterally (Neumann boundary conditions). This was achieved experimentally by placing a lubricant on the contact surfaces. More formally, the boundary conditions on the majority of the top surface were
| (5) |
where d is the fixed compressive displacement magnitude, u signifies a displacement, and σ signifies a stress. The subscript n indicates the normal direction and the subscript t indicates a tangent-to-the-surface direction (subscript 1 or 2 indicates the two tangent axes associated with a right-hand coordinate system). Similarly, at the bottom surface, the boundary conditions were,
| (6) |
In order to ensure solution uniqueness, at least one Dirichlet condition is required in the lateral directions. To achieve this, nodes on the top and bottom surface that were within approximately 15 µm of the center line (which translated to approximately ten nodes) were fixed on each surface to restrain their movement laterally. The remaining boundary conditions for the sides of the gel were stress free, i.e.,
| (7) |
This article serves to compare modulus estimates as provided by a novel MGT assay to that provided by indentation theory. In the model-based comparison method, the previous model is compressed in simulation to a degree that matches the physical compression of its mechanically tested physical counterpart. As mentioned previously, for each gel with embedded liver, a corresponding homogeneous (reference) gel is also constructed. From the mechanical tester, an average force applied to either gel surface (homogeneous or liver-gel system) is recorded. By measuring the contact surface area, an average stress can consequently be determined. Similarly, in our simulation, a compression is prescribed according to Eqs. (5)–(7). Once the boundary conditions are prescribed, a solution is calculated that is based on an initial estimate of the gel and liver properties for each of the gel systems (homogeneous and liver-gel systems). Once the displacement solution is calculated, the unused Galerkin (weighted residual finite element technique) equations associated with implementing Dirichlet conditions along the compressing surface can be used to estimate the local boundary stress (see Appendix). This stress is averaged and then compared to the mechanical tester result. The determination of the liver modulus occurs in two steps. The reference gel, which is made at the same time as gel-tissue suspensions, is tested in the mechanical tester, and the analysis to determine the modulus that matches the model to the mechanical testing output is performed. Once the reference gel modulus is determined, this is the assumed modulus of the gel for the heterogeneous liver-gel system. The properties of the liver are then determined by the same process of comparing measured to predictive average stresses.
As alluded to previously, Poisson’s ratio estimates were utilized in both the indenter modulus calculation and the finite element simulation for model modulus calculation. In order to assess the variability of the results based on Poisson’s ratio selection, a range of Poisson’s ratio in both calculations were tested. Based on previous experience, we assumed a value of 0.45 to be a reasonable estimation. From this assumption, we opted to test a range of Poisson’s ratio values from 0.43 to 0.49. For the indenter test calculations, the evaluation only required changing the Poisson’s ratio that was utilized in the calculations for the modulus value. Each Poisson’s ratio in the range was substituted into the equation and the resulting modulus value was recorded. This evaluation was performed for each of the tested livers (14 fibrotic, three control, and three normal). For the model calculation, the evaluation was performed using one of the sample fi- brotic livers (analysis for #11). The range of Poisson’s ratio values tested was from 0.43 to 0.48 (in the case of 0.49, conditioning in the stiffness matrix was poor). For the liver of interest, the previously described modulus evaluation technique was performed a total of six times, with each of the different Poisson’s ratios. The modulus value obtained for each ratio was recorded for comparison.
III. RESULTS
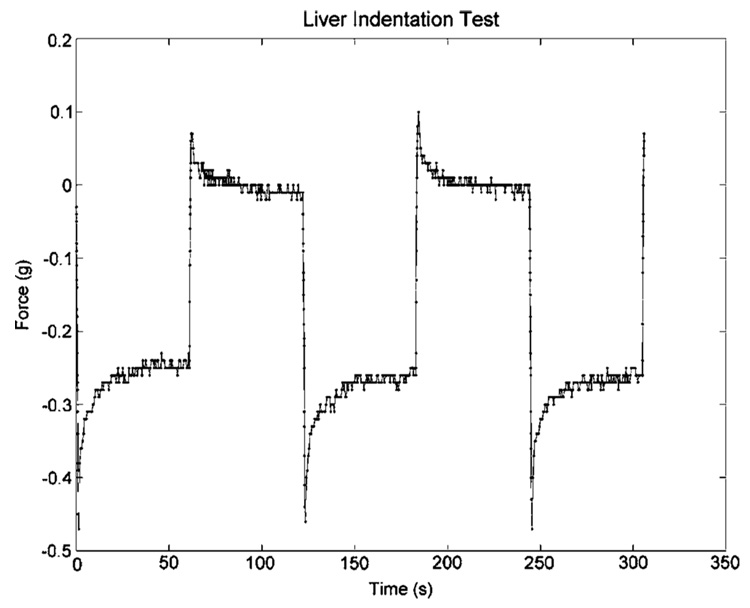
Figure 6 illustrates the average stress-strain behavior of the reference gels with the values extracted after the 60 second dwell period. Generating an estimate of the reference gel properties (which was created at the same time as the gel-tissue suspension) was important to the model-based characterization of mouse-liver properties. Figure 7 illustrates a similar stress-versus-strain application for a gel containing a murine liver, with data points again collected after the 60 second dwell. Figure 8 illustrates the excitation and dwell period of a typical indentation test.
Fig. 6.
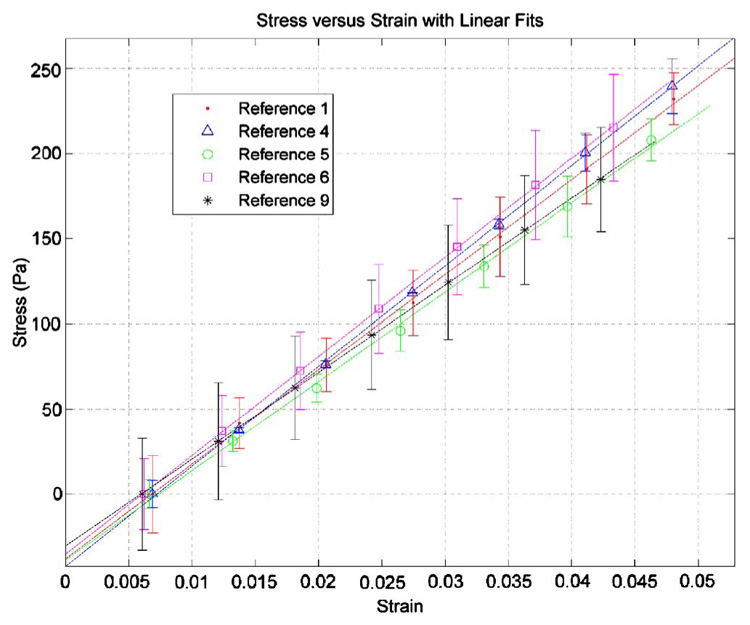
Stress-strain curves for a sampling of the reference gels from compression testing. A precompression from 3% to 5% strain (0.3 mm) was applied prior to testing. The values are average values for the two compression tests performed on each gel, with error bars indicating the standard deviation of the stress values from two tests.
Fig. 7.
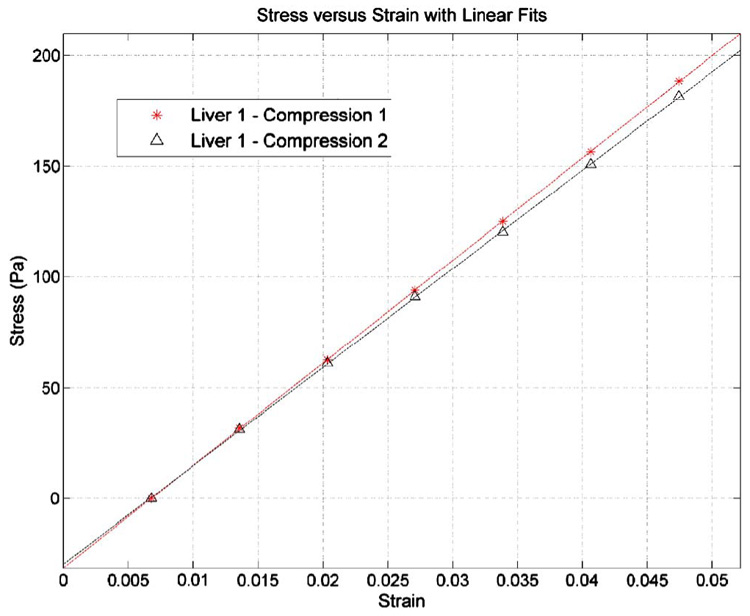
Stress vs strain behavior taken after the 60 s dwell for the gel-tissue system of a fibrotic specimen. The two curves represent the two compression tests.
Fig. 8.
Example of force data obtained from liver indentation test. The temporal decay of the force data during sustained compression indicates the viscoelastic nature of the tissue. However, the effect dampens and a steady state has been approximately established at the end of the 60 s dwell.
The results from the indentation testing of the liver lobes are given in Table II–Table IV. Table II contains the data for the fibrotic livers. The values are given as the average of the three indentations for each liver. Table III contains the average modulus values and the standard deviations for the indenter assessment of the fibrotic livers. Table IV contains the data for the control livers and the normal livers. The average value and standard deviation are given for the three controls, the three normals, and the nondiseased group, which contains all six control and normal livers. In each case, the standard deviation is small, indicating the variability of inter-sample moduli. The model-based calculation of fibrosis, control, and normal liver moduli are also given in Table II–Table IV. For the model-based simulations, the control liver from liver 2 was not available so model data from only two control livers were used to determine the control liver properties. In both the model-based and indenter cases, the control and normal moduli did not vary over the course of the experimentation. When considering the control/normal liver moduli as compared to the fibrosis liver moduli, both the indenter testing and the model results show a difference between groups. Fibrotic livers 6, 7, and 12 have indenter modulus values that are slightly lower than the others and are not distinct from the nondiseased average modulus, but the average fibrosis value for the indenter assessment is distinct from the average nondiseased value.
TABLE II.
Results from indenter material testing and model compression simulation for fibrosis and reference gels.
| Model-Compression |
|||||
|---|---|---|---|---|---|
| Liver number | Ishak grade | Indenter test modulus (kPa) | Fibrosis modulus (kPa) | Reference modulus (kPa) | Indenter percent of model modulus-fibrosis (%) |
| 1 | 4 | 1.56 | 1.53 | 6.12 | 101.9 |
| 2 | 4 | 1.26 | 1.70 | 6.52 | 74.3 |
| 3 | 4 | 1.64 | 1.88 | 6.69 | 87.5 |
| 4 | 4 | 1.18 | 1.53 | 6.67 | 77.5 |
| 5 | 4 | 0.85 | 1.42 | 5.84 | 59.9 |
| 6 | 3 | 0.70 | 0.96 | 5.84 | 73.1 |
| 7 | 4 | 0.72 | 1.05 | 5.84 | 69.0 |
| 8 | 4 | 1.06 | 1.39 | 5.79 | 76.3 |
| 9 | 4 | 0.95 | 1.10 | 5.79 | 85.9 |
| 10 | 4 | 1.07 | 1.31 | 5.52 | 81.8 |
| 11 | 4 | 0.87 | 1.05 | 5.66 | 82.6 |
| 12 | 3 | 0.60 | 0.97 | 5.66 | 61.1 |
| 13 | 4 | 1.07 | 1.50 | 6.20 | 71.3 |
| 14 | 4 | 1.08 | 1.60 | 6.20 | 67.8 |
TABLE IV.
Average modulus values and standard deviations from indenter material testing and model compression simulation for control gel.
| Indenter test modulus (kPa) | Model-compression modulus (kPa) | |
|---|---|---|
| Control average (kPa) | 0.69±0.06 | 0.66±0.13 |
| Normal average (kPa) | 0.55±0.04 | 0.55±0.06 |
| Average nondiseased modulus (kPa) | 0.62±0.09 | 0.59±0.10 |
TABLE III.
Modulus values from indenter material testing and model compression simulation for fibrotic livers.
| Modulus | Indenter (kPa) | Model (kPa) |
|---|---|---|
| Average | 1.04±0.3 | 1.36±0.3 |
| Maximum | 1.64 | 1.88 |
| Minimum | 0.60 | 0.96 |
A correspondence is suggested between indenter and MGT assays of modulus, as can be seen in Fig. 9 and in the last column of Table II. Figure 9 plots the model-based modulus for each fibrotic liver versus the indenter test modulus. A general trend exists between the two sets of measures, where as the indenter modulus increases, so does the model modulus. This is again represented in the last column of Table II, which gives the indenter modulus as a percentage of the model modulus. With exception of the liver 1 measurement, the modulus as measured by the indenter is consistently lower and an approximate mean of the ratio values is 76.4%±11.1%. As Fig. 9 indicates, a discrete least squares approximation generates a reasonably good linear fit between the two methods.
Fig. 9.
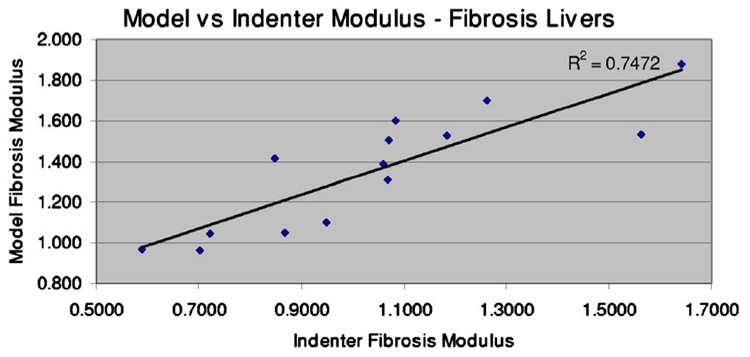
Model modulus as a function of indenter modulus. The correlation coefficient between the two sets (R) is 0.86, indicating a relationship between the two measures.
A test for normality was conducted on both the model and indenter modulus assessment data for the fibrotic livers. The Lilliefors test for normality was utilized, which allows analysis on continuous data with estimated mean and standard deviation.34 In both cases, the null hypothesis of a normal distribution could not be rejected. A t-test analysis was performed to assess the difference in means between the nondiseased group and the fibrosis group for both the indenter analysis and the model analysis. In both cases, a difference was detected at a significance level of 0.01. A t-test was also utilized to assess the difference in means between the indenter and model analysis for the fibrosis group. The analysis indicated that the average indentation modulus was lower than the average model modulus for the fibrosis group at the 0.01 significance level. The nondiseased results from the indenter analysis and the model analysis were compared using a t-test, and in this case, the null hypothesis of equal means could not be rejected. Finally, an outliers test was performed on the data point for liver 1, which is the only instance of the indentation modulus computed as larger than the model modulus. Grubb’s test was performed on the data for the ratio of the indenter test to the model test, and the data point for liver 1 was found to be an outlier. Removing the data point for liver 1 from the correlation curve (Fig. 9) increases the correlation between the two curves from 0.86 to 0.91, as shown next in Fig. 10.
Fig. 10.
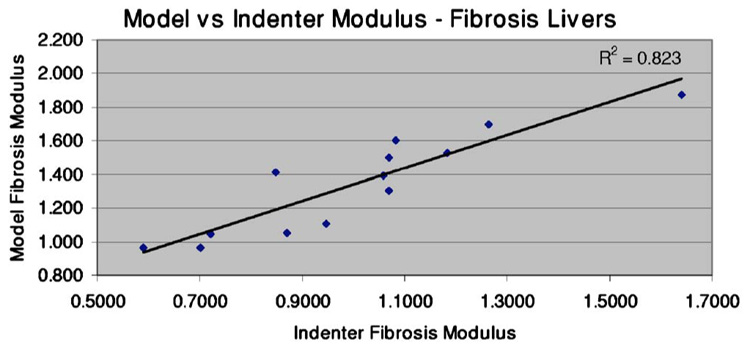
Model modulus as a function of indenter modulus. When the data point for liver 1 is removed, the correlation coefficient between the two sets increases to 0.91.
In the Poisson’s ratio evaluation, the effects were generally minimal from varying the Poisson’s ratio. In the indenter case, the maximum difference in modulus for any of the livers was approximately 75 Pa between Poisson’s ratio values of 0.43 and 0.49. In the model evaluation, the maximum modulus difference was approximately 255 Pa, between 0.43 and 0.48.
IV. DISCUSSION
Research has indicated that, in general, biological soft tissues are viscoelastic in nature, and, therefore, research commonly utilizes cyclic compressions to estimate the viscous reaction and to isolate their elastic nature.35 In contrast, some testing regiments institute a dwell period if they are concerned with factoring out such influences. When considering diagnostic processes such as elastography, in particular static-based methods which involve a prolonged state of compression, using the latter strategy to estimate properties would seem appropriate.7,36 When considering surgical loading conditions also, a static-based assessment is more suitable.28 Thus, for compatibility reasons with research directions within our laboratory, a dwell period was instituted to factor out transient behavior and data was analyzed at these approximate steady state times. The dwell period length was chosen as 60 sec for two reasons. First, this length of time was sufficient to approximate steady state as is indicated by Fig. 8, which shows the force curve for a sample liver indentation under the testing described above. Second, this time frame is relative to how long it takes to acquire an image in ultrasound elastography, or other elastography techniques, which is a current focus within our laboratory. There is little doubt that tissue is viscoelastic, and the force-to-displacement behavior will change with increasing load rate. However, as with any material testing protocol, the loading environment concerned with the application must be taken into account. In addition, the same dwell period was implemented for both the indenter and compression tests in order to provide uniformity to the investigation. These dwell periods may be adjusted in the future depending on the application or if certain information regarding diseased tissue can be uncovered by looking at different loading events temporally. We should also note that a linear regression was performed on the “steady state” data to establish stress-tostrain relationships at these time points, as indicated in Fig. 6 and Fig 7. In each case, a consistent correlation value of greater than 0.99 was determined thus indicating a reasonably robust analysis at this time point.
The main purpose of this research was to identify whether our assay could be utilized to measure the stiffness of an embedded piece of tissue. As indicated by the correlation between the indenter and model modulus evaluations, we were able to generate a testing protocol that delivered reasonable results for the elastic modulus of our trial samples. This is especially evident through the nondiseased analysis, in which case the model and indenter values are statistically indifferent. In addition, a chemically induced liver fibrosis model was used to determine whether intuitive changes in these properties could be monitored. The dual testing methodology allowed for independent confirmation of the MGT assay’s measurement. It is interesting to note that while the control/normal mice values were statistically the same between testing methods, the fibrotic liver comparison indicated statistically different but correlated moduli values. The controls/normals would indicate fidelity exists between the two methods. However, the fibrotic discrepancy indicates that there is something different with respect to the constituency of the tissue when performing indentation versus MGT. Statistical analysis among fibrotic livers indicated a difference in means between the indenter and MGT assay at a 0.01 level of significance, which may signify differing sensitivities in our model-based and indentation methods. One of the distinct differences between the two tests is the extent of the mouse liver used within each test. The two largest lobes are used in the MGT test, while one of the smaller lobes is used for the indentation. The other distinct difference is that indentation tests are measured on the surface of a liver lobe. It is quite possible that the outer parenchymal capsule associated with the liver may not have the same degree of fibrosis as the internal regions of the organ. Any heterogeneity with respect to the fibrosis in regions near the outer surface of the liver would inherently have a greater effect on indentation tests. The fact that the moduli values were less for these tests would be consistent with this assertion and the outer surface would be the most likely region to not have fully developed fibrosis. The MGT assay would be more representative of global organ fibrosis and the properties would reflect this.
There are several sources of error within our techniques that reflect limitations of the testing framework. All methods herein represent an ex vivo methodology. Without linking the in vivo and ex vivo properties, it will be difficult to use this as a quantitative metric for in vivo changes. Nevertheless, the methods and results represent reasonably robust techniques to monitor changes under like conditions. It is interesting though that our values correlate with other results within the literature for human liver. Yeh et al. measured normal and fibrotic livers in 19 fresh human cadaver livers using a standard compression test. At 5% strain, normal and fibrotic livers had moduli values of 640±80, and 1110±170 Pa, respectively. These are remarkably consistent with the values reported here. This may indicate that murine liver is a reasonably good model of human liver for mechanical properties. However, we should temper this by the fact that Yeh’s results were done 24–48 hours postmortem (tissue was preserved ) whereas our tests are done 1–2 h postmortem. Nevertheless, it is an interesting similarity.
Another possible source of error is the Poisson’s ratio selection. We choose to use a value of 0.45 based on two primary reasons. The first is that this value has been used in previous lab work and has proven successful in that application. The second is that this value provides a nearly incompressible description which is sufficiently elastic (as opposed to hyperelastic) to not invoke mesh locking in the finite element solution. Sensitivity tests for Poisson’s ratio values indicated relative insensitivity for indentations tests, with a somewhat elevated sensitivity using the MGT assay. Our analysis was performed using a Poisson’s ratio of 0.45. Other research has utilized values higher than this. It is important to note, however, that the same Poisson’s ratio was used in both analyses, which at the very least provides a very good relative comparison of moduli.
There are a myriad of other possible sources of error to include such as segmentation, tetrahedral element choice, variability in disease model, subjectivity of disease grading, and variability in precompression environment. However, the independent method testing performed herein does provide confirmation regarding the detection of disease. The results also suggest that indentation and the MGT assay may provide information regarding fibrosis at both a local and more global level. Furthermore, it should be noted that one advantage of the MGT assay is it would be amenable for calibrating elastography methods and conducting controlled experiments among different modalities.
V. CONCLUSIONS
Our MGT method yielded results that could be correlated to indenter testing of the individual liver lobes. The control/ normal liver modulus values are consistent for both the model and indenter tests. However, the fibrotic livers resulted in modulus values that were consistently higher in the model calculation than in the indenter calculation. Rather than thinking this is a limitation of either theory, we hypothesize that this may be due to the indentation being performed at the liver surface, which is a region that may experience less fibrosis formation than the organ volume. The results reported here support this hypothesis thus far. The results demonstrated that normal and advanced fibrotic livers can be statistically identified with these techniques. Unfortunately, the Ishak scoring system is not specific enough to determine whether the extent of fibrosis can be correlated to the variability within modulus measurements.
Future work would have to be focused at providing disease scoring that is more quantitative such as by image analysis. In addition, enhancements to the model regarding element type and perhaps more complicated constitutive relations to match the transient properties would be appropriate for investigation. Despite some limitations, the techniques and results produced herein should serve as a robust framework for testing elastography techniques as well as to monitor small animal disease systems that affect soft tissue architecture.
ACKNOWLEDGMENTS
This material is based upon work supported under a National Science Foundation Graduate Research Fellowship. This work is supported in part by the National Institute of Biomedical Imaging and Bioengineering of the National Institutes of Health (Grant No. R21EB007694-01).
APPENDIX
The set of mathematical equations governing linear elastic deformations for this model is written:
| (A1) |
where G=E/2(1+ ν) is the shear modulus, E is Young’s Modulus, ν is Poisson’s ratio, and is the vector of Cartesian displacements. Given (A1), a numerical solution to the coupled set of linear partial differential equations is performed using a weighted residual method. The method begins with standard residual weighting, and integration shown here in Eq. (A2),
| (A2) |
where an integration by parts has taken place that reduces the basis function order requirement, and introduces the surface integral via the divergence theorem. In (A2), the 〈•〉 operator indicates integration over the problem domain, and ϕi is the ith member of a complete set of scalar functions of position, in particular, the standard C° local Lagrange polynomial interpolants associated with finite elements. Using the Galerkin approach, the unknown displacement vector is also expanded using a Lagrange basis function of position as shown in (A3),
| (A3) |
The element used in this work was the standard linear tetrahedral element. Upon substituting the basis function, the local weighted residual expression for the ith equation and the jth set of displacement coefficients can be written as,
| (A4) |
where
| (A5) |
and δkl=(∂ϕj/∂k)(∂ϕi/∂I). With Eq. (A5), the contribution from each tetrahedral element can be determined, and a global stiffness matrix can be constructed. Boundary conditions are then assigned either as displacement boundary conditions or as applied stresses. The matrix system is assembled and solved using standard iterative matrix solution techniques.
Once the solution is calculated from the matrix system, the unused Galerkin equations on the compressing model surface (all the Dirichlet conditions) can be used to estimate the average surface stress applied, i.e., after the displacement solution is known, this equation:
| (A6) |
is available. With the right-hand side of Eq. (A6) constructed (using the displacement solution), the left-hand side surface integral can be solved for the local normal stress distribution on the gel surface based on the defined compression. The surface stress can then be subsequently averaged and compared to the respective average stress value as produced by the mechanical tester.
Contributor Information
Stephanie L. Barnes, Department of Biomedical Engineering, Vanderbilt University, Nashville, Tennessee 37235
Andrej Lyshchik, Department of Radiology and Radiological Sciences, Vanderbilt University Medical Center and Vanderbilt University Institute of Imaging Science, Vanderbilt University Medical Center, Nashville, Tennessee 37232.
Mary K. Washington, Department of Surgical Pathology, Vanderbilt University Medical Center, Nashville, Tennessee 37232
John C. Gore, Department of Biomedical Engineering, Vanderbilt University, Nashville, Tennessee 37235, Department of Radiology and Radiological Sciences, Vanderbilt University Medical Center and Vanderbilt University Institute of Imaging Science, Vanderbilt University Medical Center, Nashville, Tennessee 37232
Michael I. Miga, Department of Biomedical Engineering, Vanderbilt University, Nashville, Tennessee 37235, Department of Radiology and Radiological Sciences, Vanderbilt University Medical Center and Vanderbilt University Institute of Imaging Science, Vanderbilt University Medical Center, Nashville, Tennessee 37232.
References
- 1.Wells RG. The role of matrix stiffness in hepatic stellate cell activation and liver fibrosis. J. Clin. Gastroenterol. 2005;39:S158–S161. doi: 10.1097/01.mcg.0000155516.02468.0f. [DOI] [PubMed] [Google Scholar]
- 2.Yeh WC, et al. Elastic modulus measurements of human liver and correlation with pathology. Ultrasound Med. Biol. 2002;28:467–474. doi: 10.1016/s0301-5629(02)00489-1. [DOI] [PubMed] [Google Scholar]
- 3.Sandrin L, et al. Transient elastography: A new noninvasive method for assessment of hepatic fibrosis. Ultrasound Med. Biol. 2003;29:1705–1713. doi: 10.1016/j.ultrasmedbio.2003.07.001. [DOI] [PubMed] [Google Scholar]
- 4.Gomez-Dominguez E, et al. Transient elastography: a valid alternative to biopsy in patients with chronic liver disease. Aliment Pharmacol. Ther. 2006;24:513–518. doi: 10.1111/j.1365-2036.2006.02999.x. [DOI] [PubMed] [Google Scholar]
- 5.Klatt D, et al. In vivo determination of hepatic stiffness using steadystate free precession magnetic resonance elastography. Invest. Radiol. 2006;41:841–848. doi: 10.1097/01.rli.0000244341.16372.08. [DOI] [PubMed] [Google Scholar]
- 6.Kruse SA, et al. Tissue characterization using magnetic resonance elastography: Preliminary results. Phys. Med. Biol. 2000;45:1579–1590. doi: 10.1088/0031-9155/45/6/313. [DOI] [PubMed] [Google Scholar]
- 7.Washington CW, Miga MI. Modality independent elastography (MIE): A new approach to elasticity imaging. IEEE Trans. Med. Imaging. 2004;23:1117–1128. doi: 10.1109/TMI.2004.830532. [DOI] [PubMed] [Google Scholar]
- 8.Bamber JC, et al. Quantitative-evaluation of real-time ultrasound features of the breast. Ultrasound Med. Biol. 1988;14:81–87. doi: 10.1016/0301-5629(88)90050-6. [DOI] [PubMed] [Google Scholar]
- 9.Cespedes I, Ophir J. Reduction of image noise in elastography. Ultrason. Imaging. 1993;15:89–102. doi: 10.1177/016173469301500202. [DOI] [PubMed] [Google Scholar]
- 10.Garra BS, et al. Elastography of breast lesions: Initial clinical results. Radiology. 1997;202:79–86. doi: 10.1148/radiology.202.1.8988195. [DOI] [PubMed] [Google Scholar]
- 11.Nightingale KR, et al. A finite element model of remote palpation of breast lesions using radiation force: Factors affecting tissue displacement. Ultrason. Imaging. 2000;22:35–54. doi: 10.1177/016173460002200103. [DOI] [PubMed] [Google Scholar]
- 12.Steinberg BD, Sullivan DC, Carlson DL. Disparity mapping applied to sonography of the breast: Technical note. Radiology. 1998;207:545–550. doi: 10.1148/radiology.207.2.9577508. [DOI] [PubMed] [Google Scholar]
- 13.Sumi C, Nakayama K, Kubota M. An effective ultrasonic strain measurement-based shear modulus reconstruction technique for superficial tissues - demonstration on in vitro pork ribs and in vivo human breast tissues. Phys. Med. Biol. 2000;45:1511–1520. doi: 10.1088/0031-9155/45/6/308. [DOI] [PubMed] [Google Scholar]
- 14.Lorenz A, et al. Ultrasound elastography of the prostate: An innovative technique for tumour-detection. Ultraschall Med. 2000;21:8–15. doi: 10.1055/s-2000-8926. [DOI] [PubMed] [Google Scholar]
- 15.Kallel F, et al. Elastographic imaging of the normal canine prostate in vitro. Ultrason. Imaging. 1999;21:201–215. doi: 10.1177/016173469902100304. [DOI] [PubMed] [Google Scholar]
- 16.Lyshchik A, et al. Thyroid gland tumor diagnosis at US elastography. Radiology. 2005;237:202–211. doi: 10.1148/radiol.2363041248. [DOI] [PubMed] [Google Scholar]
- 17.de Korte CL, et al. Characterization of plaque components and vulnerability with intravascular ultrasound elastography. Phys. Med. Biol. 2000;45:1465–1475. doi: 10.1088/0031-9155/45/6/305. [DOI] [PubMed] [Google Scholar]
- 18.Bom N, et al. Quantification of plaque volume, shear stress on the endothelium, and mechanical properties of the arterial wall with intravascular ultrasound imaging. Z. Kardiol. 2000;89:105–111. doi: 10.1007/s003920070108. [DOI] [PubMed] [Google Scholar]
- 19.Chen EJ, et al. Young’s modulus measurements of soft tissues with application to elasticity imaging. IEEE Transactions on Ultrasonics Ferroelectrics and Frequency Control. 1996;43:191–194. [Google Scholar]
- 20.Cao L, et al. Compressive properties of mouse articular cartilage determined in a novel micro-indentation test method and biphasic finite element model. J. Biomech. Eng. 2006;128(5):766–771. doi: 10.1115/1.2246237. [DOI] [PubMed] [Google Scholar]
- 21.Erkamp RQ, et al. Measuring the elastic modulus of small tissue samples. Ultrason. Imaging. 1998;20:17–28. doi: 10.1177/016173469802000102. [DOI] [PubMed] [Google Scholar]
- 22.Carter FJ, et al. Measurements and modelling of the compliance of human and porcine organs. Med. Image Anal. 2001;5:231–236. doi: 10.1016/s1361-8415(01)00048-2. [DOI] [PubMed] [Google Scholar]
- 23.Delalleau A, et al. Characterization of the mechanical properties of skin by inverse analysis combined with the indentation test. J. Biomech. 2006;39:1603–1610. doi: 10.1016/j.jbiomech.2005.05.001. [DOI] [PubMed] [Google Scholar]
- 24.Klaesner JW, et al. Accuracy and reliability testing of a portable soft tissue indentor. IEEE Trans. Neural Syst. Rehabil. Eng. 2001;9:232–240. doi: 10.1109/7333.928583. [DOI] [PubMed] [Google Scholar]
- 25.Ishak K, et al. Histological grading and staging of chronic hepatitis. J. Hepatol. 1995;22:696–699. doi: 10.1016/0168-8278(95)80226-6. [DOI] [PubMed] [Google Scholar]
- 26.Stevanovic M, Yovanovich M, Culham JR. Modeling contact between rigid sphere and elastic layer bonded to rigid substrate. IEEE Trans. Compon. Packag. Technol. 2001;24:207–212. [Google Scholar]
- 27.Chen WT, Engel PA. Impact and contact stress analysis in multilayer media. Int. J. Solids Struct. 1972;8:1257–1281. [Google Scholar]
- 28.Cash DM, et al. Image-guided liver surgery: Concepts and initial clinical experiences. J. Gastrointest Surg. 2007;11:844–859. doi: 10.1007/s11605-007-0090-6. [DOI] [PMC free article] [PubMed] [Google Scholar]
- 29.Cash DM, et al. Compensating for intraoperative soft-tissue deformations using incomplete surface data and finite elements. IEEE Trans. Med. Imaging. 2005;24:1479–1491. doi: 10.1109/TMI.2005.855434. [DOI] [PubMed] [Google Scholar]
- 30.Miga MI, et al. In vivo quantification of a homogeneous brain deformation model for updating preoperative images during surgery. IEEE Trans. Biomed. Eng. 2000;47:266–273. doi: 10.1109/10.821778. [DOI] [PubMed] [Google Scholar]
- 31.Miga MI, et al. Model-updated image guidance: Initial clinical experiences with gravity-induced brain deformation. IEEE Trans. Med. Imaging. 1999;18:866–874. doi: 10.1109/42.811265. [DOI] [PubMed] [Google Scholar]
- 32.Bramley R, Wang X. SPLIB: A library of iterative methods for sparse linear system. (Technical Report) 1995 [cited.
- 33.Sullivan JM, Charron G, Paulsen KD. A three-dimensional mesh generator for arbitrary multiple material domains. Finite Elements in Analysis and Design. 1997;25:219–241. [Google Scholar]
- 34.Sheskin DJ. Handbook of Parametric and Nonparametric Statistical Procedure. 2nd ed. New York: Chapman and Hall; 2000. [Google Scholar]
- 35.Wang B, et al. An experimental study on biomechanical properties of hepatic tissue using a new measuring method. Biomed. Mater. Eng. 1992;2:133–138. [PubMed] [Google Scholar]
- 36.Miga MI, et al. Model-updated image guidance: Initial clinical experiences with gravity-induced brain deformation. IEEE Trans. Med. Imaging. 1999;18:866–874. doi: 10.1109/42.811265. [DOI] [PubMed] [Google Scholar]


