

Abstract
More than 67,000 expressed sequence tags (ESTs) have recently been generated for sunflower (Helianthus), including 44,000 from cultivated confectionery (RHA280) and oilseed (RHA801) lines of Helianthus annuus and 23,000 from droughtand salt-tolerant wild sunflowers, H. argophyllus and H. paradoxus, respectively. To create a transcript map for sunflower, we identified 605 ESTs that displayed small insertion–deletion polymorphism (SNP) variation in silico, had apparent tissue-specific expression patterns, and/or were ESTs with candidate functions in traits such as development, cell transport, metabolism, plant defense, and tolerance to abiotic stress. Primer pairs for 535 of the loci were designed from the ESTs and screened for polymorphism in recombinant inbred lines derived from a cross between the same cultivars (RHA280 × RHA801) employed for sequencing. In total, 273 of the loci amplified polymorphic products, of which 243 mapped to the 17 linkage groups previously identified for sunflower. Comparisons with previously mapped QTL revealed some cases where ESTs with putatively related functions mapped near QTLs identified in other crosses for salt tolerance and for domestication traits such as stem diameter, shattering, flowering time, and achene size.
Introduction
The identification and characterization of genes underlying important traits is a major goal of plant functional genomics. This goal has been significantly aided by the explosive growth of large-scale expressed sequence tag (EST) sequencing projects (e.g., Lunde et al. 2003; Ronning et al. 2003). EST libraries generated by these projects have proven to be excellent resources for gene discovery, molecular marker development, analysis of gene expression at the level of the whole genome, and identification of candidate genes for phenotypes of interest (Andersen and Lubberstedt 2003; Clarke et al. 2003; Gupta and Rustgi 2004). The EST approach has been particularly useful in taxa whose whole genome sequences remain unavailable or are otherwise limited in their genetic resources, e.g., the Compositae. In the present paper, we describe progress towards a transcript map for sunflower, the most prominent member of the Compositae, based on the mapping of expressed genes using denaturing high-performance liquid chromatography (DHPLC) assays (Xiao and Oefner 2001).
The Compositae comprise a genetically diverse and ecologically successful plant family comprising onetenth of all known flowering species (Heywood 1978) including more than 40 domesticated plants and many of the world’s worst weeds. Predominant within the Compositae is the cultivated sunflower (Helianthus annuus L.), the only major crop plant native to North America (Harter et al. 2004) and one of the world’s most important oilseed crops (FAOSTAT data 2004). In addition to oilseed production, sunflowers have become increasingly popular in recent years as a confectionery (snack food) and an ornamental crop. Apart from this commercial importance, the sunflowers have also recently moved to the center of the ecological and evolutionary stage (Burke and Rieseberg 2003; Rieseberg et al. 2003; Snow et al. 2003; Lexer et al. 2004) alongside more well-studied organisms such as fruit flies (Drosophila spp.), Darwin’s finches (Geospiza spp.), and mouse-ear cress (Arabidopsis thaliana).
The advances in our understanding of both domesticated and wild sunflowers have been facilitated by the availability of high-density genetic maps. The first genetic linkage map for sunflower was actually developed for a wild hybrid species, H. anomalus (Rieseberg et al. 1993), which is divergent chromosomally from the domesticated sunflower (Rieseberg et al. 1995). However, shortly thereafter several restriction fragment length polymorphism maps were published for the domesticated sunflower (Berry et al. 1995; Gentzbittel et al. 1995, 1999; Jan et al. 1998), establishing a standard nomenclature for sunflower linkage groups and providing framework markers for comparisons among maps (Gedil et al. 2001). More recently, high-resolution linkage maps based on more than 1,000 simple sequence repeat (SSR) and other sequence-tagged-site markers have been developed for the cultivated sunflower (Tang et al. 2002; Yu et al. 2003) and several wild species (Rieseberg et al. 2003; Burke et al. 2004; Lai et al. 2005).
Despite the availability of high-density genetic maps and bacteria artificial chromosome (Gentzbittel et al. 2002; Knapp SJ, unpublished) and EST libraries (http://cgpdb.ucdavis.edu; Fernandez et al. 2003; Tamborindeguy et al. 2004), progress towards identification of genes underlying traits of interest in sunflower has been hampered by the laborious nature of map-based cloning. Sunflower would benefit greatly from a systematic effort to map functionally important genes in order to search for associations between candidate genes and QTLs underlying agriculturally or evolutionarily important traits (e.g., Gentzbittel et al. 1999; Slabaugh et al. 2003; Lexer et al. 2004).
The EST sequencing projects promise an easier bridge between phenotype and gene by using known expressed sequences to create assays for functional genetic variants. This process allows for simultaneous genetic mapping and suggestion of candidate functions and phenotypes for the loci via homology (e.g., Perez-Vich et al. 2002; Lexer et al. 2004). Genome sequencing projects have shown that single base substitutions and/or small insertion–deletion polymorphisms (SNPs) are the most abundant type of DNA variation, e.g., occurring every 100–300 bases in the human genome. SNPs occur frequently in or near coding sequences (Cho et al. 1999) and may be the causes of functional differences between alleles. Moreover, the development of EST sequencing projects now makes it possible to discover putative SNPs in silico with subsequent experimental verification. Combined with increasing sophistication in technical aspects of assaying SNPs, we now have the ability to generate markers specific for many individual loci with known expression. Since SNPs have many advantages in abundance, identification, stability, and ease of genotyping (Wang et al. 1998; Giordano et al. 1999), they are the most obvious targets for high throughput genotyping, making discovery of SNPs and the development of assays for allelic discrimination a crucial step in making the promise of genomics a reality.
As part of the Compositae Genome Project, a comprehensive annotated EST database has been developed for sunflower and lettuce, the other major Compositae crop (http://cgpdb.ucdavis.edu). For sunflower, 44,000 ESTs were derived from domesticated confectionery (RHA280) and oilseed (RHA801) sunflower lines, two representatives from the diverse array of highly selfing germplasm available for cultivated sunflower research (Seiler 1991), and 23,000 ESTs were derived from drought- and salt-tolerant wild sunflowers, H. argophyllus and H. paradoxus, respectively. The 67,000 ESTs represent approximately 18,000 unigenes. In this article we describe our use of this EST resource to generate and map 243 new genetic markers for sunflower using DHPLC for SNP detection. Such a transcript map provides the starting framework for the dissection of quantitative traits and represents a first step toward identifying and characterizing genes underlying important agricultural and/or ecological traits in sunflower.
Materials and methods
Plant material and mapping population
One population of F7 recombinant inbred lines (RILs) was used for mapping of ESTs. The RILs were developed by single-seed descent from the same two cultivars (RHA280 and RHA801) employed for the majority of EST sequencing. A dense map of anonymous markers already exists for this population (Tang et al. 2002; Yu et al. 2003); consequently, it has become the primary reference population for molecular breeding and comparative genomics research in sunflower (e.g., Burke et al. 2004; Lai et al. 2005). Ninety-four RILs from this cross were employed for population screening and map construction.
EST database searches and primer design
The EST sequences were used in two distinct strategies to find genetic markers. The first methodology was an in silico approach utilizing the EMBOSS suite (Rice et al. 2000), ClustalW (Thompson et al. 1994), and Perl scripts (available upon request). The CAP3 (Huang and Madan 1999) assembled contigs were searched for unigenes containing EST sequences from both the RHA280 and RHA801 source materials. The parameters used for CAP3 assembly were overlaps with a minimum of 80% identity and 40 bases in length for inclusion in a contig. The component ESTs from these unigenes were then split into two groups containing sequences only from one genotype. For each genotype, an alignment was obtained for all sequences using the EMBOSS “Emma” program as an interface to ClustalW. A consensus sequence for each genotype was constructed from the alignments using the EMBOSS program “Cons”, and then the “Diffseq” program of EMBOSS was used to find single nucleotide differences between the aligned consensus sequences for each genotype.
A prerequisite for the first SNP discovery method was the availability of sequences from both genotypes for a gene. We wished, however, to identify and map other genes in the database that could be candidates underlying QTL previously identified in sunflower. To identify these genes, a second methodology used a table in the Compositae Genome Project database (http://cgpdb.ucdavis.edu) containing the top BLAST hits for each unigene. These putative functions for the unigenes inferred from homology were queried via a keyword search focused on the following aspects of plant growth and development: meristem function, plant defense, senescence, signaling, carbohydrate metabolism, cellular metabolism, amino acid biosynthesis and metabolism, floral development, abiotic stress tolerance, fatty acid biosynthesis, cellular transport, and other phenotypes assayed in sunflower population studies previously conducted in the lab. Finally, we also identified ESTs with tissue-specific expression patterns, both to broaden the study and because tissue-specific expression also provides a clue regarding possible function.
Primers were designed for all EST markers using a representative EST from each contig and the Primer3 software (Rozen and Skaletsky 2000). Primers were designed to have an average length of 20 nucleotides, melting temperatures of 58 or 60°C, and theoretical PCR amplicons of 200–500 bp.
PCR amplification
Touchdown PCR was used to reduce non-specific amplification. Briefly, a hot start of 94°C for 2 min was followed by 1 cycle of 94°C for10 s, 59°C for 30 s, and 72°C for 30 s, then 9 cycles during which the annealing temperature dropped by 0.5°C per cycle, then 25 cycles of 94°C 10 s, 54°C 30 s, and 72°C 30 s, and a 10 min final extension at 72°C. Reactions were run in 50 μl volumes with 50 ng template genomic DNA, 50 pmol of the forward and reverse primers, and a final concentration of 2 mM MgCl2, 30 mM Tricine, 50 mM KCl, 100 μM of each dNTP, and 2 U of Taq polymerase. After amplification, the presence of amplification products was tested by agarose gel electrophoresis. Primer pairs that failed to amplify RHA280 and RHA801 alleles under these conditions were not considered further. The successful PCR products were assayed by DHPLC (see below).
Assay of gene polymorphism using DHPLC
DHPLC analysis was carried out on an automated WAVE nucleic acid fragment analyzer (Transgenomic Inc., Omaha, NE, USA) using a DNASep HT column. An initial screen for length differences was carried out by analyzing pure parental and mixes of parental PCR products in equimolar concentrations. The presence of an additional peak in the chromatographic profile of the mixtures compared to the pure parental PCR products under non-denaturing conditions was interpreted as due to length polymorphism (Xiao and Oefner 2001). For primers showing length polymorphisms, PCR products from each RIL were mixed with one of the parental PCR products and run under non-denaturing conditions. The chromatographic profile of the RIL mixture was then compared to the parental mixture profiles to determine the RIL genotype.
Primer pairs not showing length polymorphism were screened for sequence differences under partially denaturing conditions. Polymorphism between the parental lines was detected by mixing parental PCR products in roughly equimolar proportions and subjecting the mixture to a denaturing step of 5 min at 94°C followed by gradual reannealing to room temperature to create homo- and heteroduplexes prior to analysis. The reannealed products were injected into the DNASep HT column and eluted with a linear acetonitrile gradient in 0.1 TEAA buffer, pH 7.0, at a constant flow rate of 0.9 ml/min. The start and end points of the gradient was automatically calculated using an algorithm provided by the WAVE MAKER software (Transgenomic Inc.). Likewise, the melting temperature (Tm) required for successful resolution of heteroduplex molecules was determined by a DHPLC algorithm (Transgenomic Inc.) and the online DHPLC Melt program (http://insertion.stanford.edu/melt.html). Both pure parental and equimolar mixes of parental PCR products were analyzed, and the presence of additional peaks in the mixed compared to pure parental assays was interpreted as being due to heteroduplex formation because of sequence polymorphism.
Once the melting temperature was optimized for primer pairs showing polymorphism, the entire population was screened at the optimal temperature. For population screening, PCR product from the RHA280 parent was added in equimolar concentration to PCR products from each RIL so that lines carrying RHA801 alleles could be visualized as heteroduplex molecules. Additional peaks observed in any of the RIL/RHA280 mixtures was due to the presence of the allele derived from the RHA801 parent and was scored accordingly.
Genetic mapping and comparisons with QTL positions
EST-based markers found to be polymorphic by DHPLC were added to the RHA280 × RHA801 reference map for H. annuus (Tang et al. 2002; Yu et al. 2003) using the program MAPMAKER/EXP 3.0b (Lander et al. 1987) under the “RI Self” model. Because the RHA280 × RHA801 map contains 459 SSRs (Tang et al. 2002), a subset of 196 evenly spaced markers was chosen to establish a framework for each linkage group (LG), then tested for a unique best order via the “ripple” command (parameters five marker windows and reporting alternative orders with LOD <3). The EST markers were assigned to these chromosomes, then placed within the LGs by the following process: markers were tested for position within an LG by the “try” command, then markers showing one position with LOD >3 compared to all other positions were incorporated into the framework order and tested via the “ripple” command as above, and then the unplaced markers were retested, until no markers had a single best position. The remaining markers for an LG were then classified as either closely linked to an existing framework marker (<0.7 cM), significance for the best location at 3> LOD >2, or linked with unsure placement (LOD <2 between best and alternative placements, but showing a high LOD and low recombination values with all markers in the region). The marker data were tested for deviations from expected Mendelian ratios. All final map orders were then confirmed to have no likely alternative orders via the “ripple” command as above and recombination fractions were translated into centimorgan (cM) distances using the Kosambi mapping function.
The ESTs found via keyword searches were classified into functional categories. The positions of the ESTs with putative functions relating to previously analyzed phenotypes were compared to mapped QTLs for more than 70 morphological, physiological, and life history traits across three different mapping populations: wild × domesticated H. annuus (cultivated F3; Burke et al. 2002), H. annuus × H. petiolaris raised in the greenhouse (BC2-greenhouse; Rieseberg et al. 2003), and H. annuus × H. petiolaris grown in a natural salt marsh habitat (BC2-field; Lexer et al. 2003). EST positions in the QTL populations were inferred on the basis of shared SSR loci. The positions of these ESTs were compared to the 1-LOD support intervals for the QTL mapped previously. To ensure this was justified, we genotyped the Burke et al. (2002) population with eight markers (HT040, HT087, HT149, HT160, HT172, HT173, HT185, and HT189). All of these mapped to the same relative positions as in the RHA280 × RHA801 population employed here (data not shown). Similar results were obtained for the BC2-field QTL population (Lexer et al. 2003, 2004). Thus, we can have reasonable confidence in the inferred location of ESTs across the three QTL populations.
Results
Primer design and genetic mapping of EST-based markers
There were 288 ESTs identified in silico with potential SNPs, from which primer pairs were developed for 218 loci. Additionally 317 primer pairs were designed from ESTs of sunflower homologous to functionally important genes characterized in other taxa, but with no a priori evidence for polymorphism. Unambiguous PCR products were produced by 426 primer pairs (80%). An additional 31 primer pairs (6%) generated multiple PCR products and 78 (14%) failed to amplify. These latter two groups of primer pairs were excluded from further study. Introns were present in 107/535 (20%) of PCR products, ranging in size from a few base pairs to a few kilobases (data not shown). Because optimal sensitivity of DHPLC is achieved with fragments <500 bp in length, larger introns in 44 PCR products (8%) hampered our ability to detect sequence or length polymorphisms (Xiao and Oefner 2001).
In all, length and/or sequence polymorphisms were clearly detected for 273 EST markers (Supplementary Table S1). The 218 primer pairs designed from ESTs showing variation in silico yielded 156 viable assays (72%), while from the 317 ESTs with no a priori evidence for variation only 117 assays (37%) were functional. The majority of successful assays (84%) detected sequence polymorphisms, while 44 of them (16%) exhibited length polymorphism. The dataset generated contained very few missing genotypes (1.25%).
Only 30 (11.0%) of the marker data had χ2>3.84 when tested for deviations from expected Mendelian ratios. Of the 273 markers, 122 were incorporated at LOD >3 into the linkage group frameworks, 52 were mapped to positions with 3> LOD >2, and 17 were closely linked (<0.7 cM) to a framework marker (Fig. 1). An additional 52 markers showed obvious signs of linkage, but could not be placed definitively (LOD <2; Fig. 1). Twenty-four markers showed weak linkage and/or aberrant behavior (e.g., doubling the size of an interval when incorporated) and six markers were unlinked to any of the chromosome framework markers. The EST markers showing deviations from Mendelian ratios mapped close to the SSR markers showing similar patterns of inheritance (Tang et al. 2002).
Fig. 1.
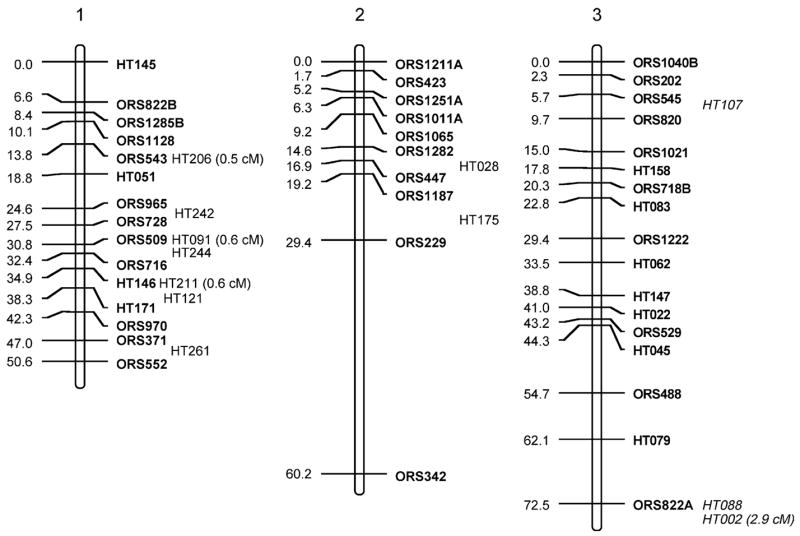


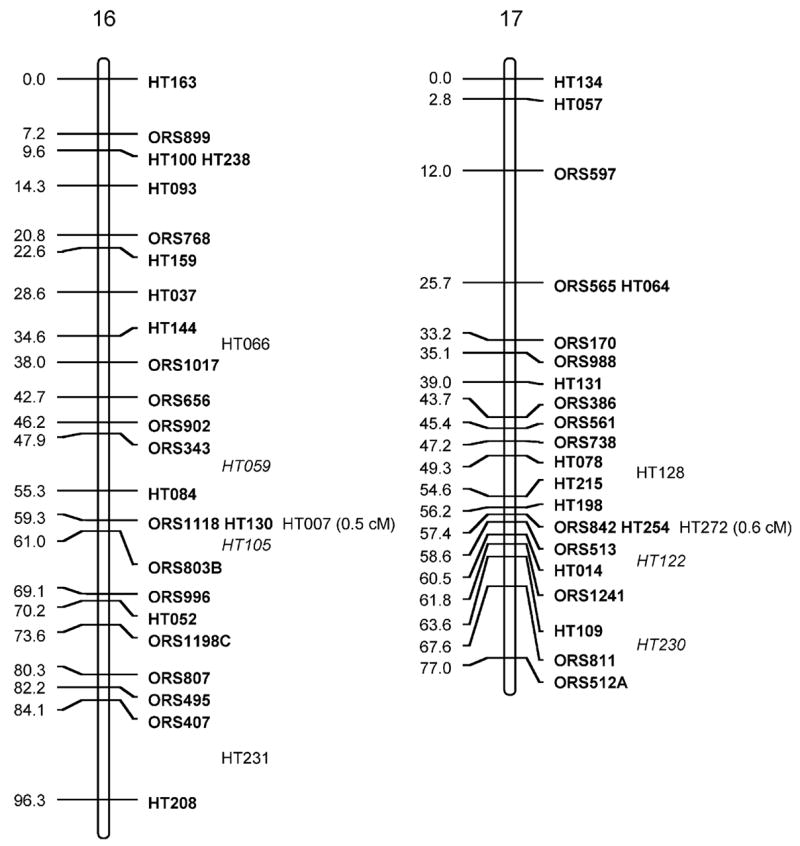
Sunflower linkage map derived from (RHA280 × RHA801) F7RILs. The following marker nomenclature is employed: ORS microsatellite markers (Tang et al. 2002), HT Helianthus transcribed (i.e., EST) markers. Linkage group designations above each map follow Tang et al. (2002), and map distances are given to the left and marker names to the right of each linkage group. Markers shown in bold are ordered at LOD >3, markers in plain type are either ordered at 3> LOD >2 or closely linked to framework markers, and markers in italics are strongly linked to markers in the regions and shown at their most likely position LOD <2. Markers placed o. the end of the frameworks established by Tang et al. (2002) have the cM distance between them and the terminal markers given
The total map distance of the combined SSR and EST marker map was 1,349.3 cM (Fig. 1; Table 1). Although this is very close to the previously published map length of 1,368.3 cM of the Tang et al. (2002) map, there were some differences between the two maps. Linkage groups (LGs) 1, 5, 7, 8, 9, 11, 16, and 17 had EST markers that extended the previous maps at the upper end of the chromosomes shown in Fig. 1 and LGs 5, 6, 15, and 16 had similar increases at the lower ends. These increases are not unexpected and hopefully take this map closer to the complete genomic coverage from the estimated 93% coverage achieved earlier (Yu et al. 2003). The SSR frameworks used for adding in the EST markers were shortened for some of the LGs because no marker orders containing terminal markers with LOD >3 compared to other orders could be found (LG2, −3 cM from lower end; LG3, −3.1 cM from lower; LG4, −4 cM from upper; LG7, −8.7 cM from upper; LG9, −13 cM from lower; LG16, −15 cM from lower). For LG13, smaller units corresponding to the upper and lower parts for the LG from Tang et al. (2002) could be constructed; however, no best order with LOD >3 over an alternative could be found that reconstructed the entire LG. Consequently, both parts are shown separately in Fig. 1, leading to an overall loss of 28.8 cM for this LG.
Table 1.
Linkage group statistics and comparisons
| Tang et al. (2002) map | This study | Predicted number of mapped ESTs based on Tang et al. (2002) map statistics
|
||||||
|---|---|---|---|---|---|---|---|---|
| Based on linkage group length
|
Based on number of markers
|
|||||||
| Linkage group | cM | Number of markers | cM | Number of added markers | Expectation | χ2 | Expectation | χ2 |
| 1 | 48.0 | 24 | 50.6 | 11 | 8.5 | 0.74 | 12.7 | 0.23 |
| 2 | 68.0 | 31 | 60.2 | 2 | 12.1 | 8.43 | 16.4 | 12.64 |
| 3 | 72.1 | 30 | 72.5 | 10 | 12.8 | 0.61 | 15.9 | 2.19 |
| 4 | 97.7 | 30 | 113.7 | 17 | 17.4 | 0.01 | 15.9 | 0.08 |
| 5 | 62.1 | 30 | 84.4 | 19 | 11 | 5.82 | 15.9 | 0.60 |
| 6 | 68.4 | 12 | 53.3 | 11 | 12.1 | 0.10 | 6.4 | 3.31 |
| 7 | 81.0 | 19 | 69.1 | 5 | 14.4 | 6.14 | 10.1 | 2.58 |
| 8 | 88.9 | 22 | 97.9 | 18 | 15.8 | 0.31 | 11.6 | 3.53 |
| 9 | 106.1 | 32 | 99.9 | 18 | 18.8 | 0.03 | 16.9 | 0.07 |
| 10 | 102.2 | 47 | 88.6 | 37 | 18.1 | 19.74 | 24.9 | 5.88 |
| 11 | 104.0 | 19 | 94.2 | 10 | 18.5 | 3.91 | 10.1 | 0.00 |
| 12 | 72.7 | 21 | 82.0 | 15 | 12.9 | 0.34 | 11.1 | 1.37 |
| 13 Ua | 14.5 | 8 | ||||||
| 13 Lb | 32.1 | 9 | ||||||
| 13 | 75.4 | 28 | 17 | 13.4 | 0.97 | 14.8 | 0.33 | |
| 14 | 85.3 | 18 | 87.0 | 11 | 15.1 | 1.11 | 9.5 | 0.24 |
| 15 | 74.8 | 26 | 76.0 | 12 | 13.3 | 0.13 | 13.8 | 0.23 |
| 16 | 94.2 | 27 | 96.3 | 16 | 16.7 | 0.03 | 14.3 | 0.20 |
| 17 | 67.4 | 43 | 77.0 | 14 | 12.0 | 0.33 | 22.8 | 3.40 |
| Total | 1,368.3 | 459 | 1,349.3 | 243 | 242.9 | 48.74c | 243.1 | 36.87d |
The upper part of the Tang et al. linkage group recovered in the current study
The lower part of the Tang et al. linkage group recovered in the current study
P<0.001
P<0.005
The EST markers were mapped to all 17 linkage groups in sunflower. They were, however, unevenly distributed across the LGs (Fig. 1; Table 1), ranging from 2 (LG2) to 37 (LG10). When using either LG length from the Tang et al. (2002) maps or number of SSRs per LG from these same maps to generate expected numbers of ESTs mapped to LGs (Table 2), χ2 test statistics were significant (P<0.001 and P<0.005, respectively). Most of the deviation in both cases was due to a dearth of markers mapped to LG2 and an excess for LG10. Large gaps (>20 cM) present in the Tang et al. maps remain for LGs 2, 7, 9, 11, 13, 14; however, the addition of EST markers closed some of these large gaps on LGs 6, 8, 9, 10, and 12, and one marker was placed in the large gap on LG4 at 3> LOD >2.
Table 2.
Summary of associations between previously mapped QTLs and EST markers with similar candidate functions
| Locus Name | Linkage group | Closest SSR in QTL mapping population | Traits/QTLs
|
Candidate function based on homology | ||
|---|---|---|---|---|---|---|
| BC2-greenhouse a | BC2-fieldb | Cultivated F3c | ||||
| HT175 | 2 | ORS447 | Leaf Mg concentration, leaf Mn concentration | Putative cyclic nucleotide and calmodulin-regulated, ion channel protein | ||
| HT008 | 4 | ORS674 | Relative growth rate | Auxin-repressed protein | ||
| HT185 | 6 | ORS1256 | Leaf Ca concentration | ER-type Ca2+ pump protein | ||
| HT160 | 8 | ORS826 (BC2-G), ORS243 (F3) | Days until budding, days until first floret | Days to flower, achene width | APETALA2-like protein | |
| HT103 | 10 | ORS380 | Relative growth rate, leaf area, stem diameter, initial seed weight | COP1 homolog | ||
| HT179 | 10 | ORS380 (BC2-G), ORS684 (F3) | Initial seed weight, disk diameter, phyllary number | Achene width, achene length | bZIP transcription factor | |
| HT216 | 10 | ORS591 | Leaf Ca concentration, leaf K concentration, leaf Mn concentration | Membrane transporter | ||
| HT227 | 10 | ORS003 | Leaf Mn concentration, leaf K concentration, leaf B concentration | Transporter-like protein | ||
| HT189 | 10 | ORS691 (BC2-G), ORS613 (F3) | Relative growth rate, leaf area, stem diameter | Height, peduncle length | Cell division control protein | |
| HT087 | 11 | ORS733 | Leaf length, stem diameter | G-box binding factor, bZIP transcription factor | ||
| HT200 | 11 | ORS733 | Leaf length, stem diameter | Shattering | Auxin-regulated protein | |
| HT089 | 14 | ORS832 | Leaf Ca concentration, leaf K concentration, leaf Mn concentration | Putative 7-transmembrane G-protein-coupled receptor | ||
| HT215 | 17 | ORS845 | Leaf Na concentration | Probable cation transport protein | ||
Comparisons between ESTs and QTL positions
Of the ESTs found via keyword searches that could be mapped (Supplementary Table S1), 1 encodes a putative protein related to seed dormancy, 4 encode products potentially involved in branching and meristem determination, 2 may be involved in self-incompatibility, 5 are related to plant defense and senescence genes, and 12 are similar to genes functioning in signaling pathways. Other functional categories include genes potentially involved in carbohydrate metabolism (4), 2 in nutrient reserves, 16 in cellular metabolism, 14 in amino acid biosynthesis and metabolism, and 4 in floral development. Another 17 candidate genes likely contribute to abiotic stress tolerance, 5 encode proteins with functions in cellular transport, and 2 are involved in fatty acid biosynthesis, which is one of the most important traits in the cultivated sunflower. In addition, eight of the mapped ESTs show evidence of tissue-specific expression patterns, including shoot specific, root/shoot-specific, developmental kernel specific and germinating seed-specific expression.
Although numerous ESTs mapped in the vicinity of QTLs, in most instances there was no obvious match between the phenotype and the putative function of the EST. Thus, here we report only those instances (13 in all) in which the predicted function of an EST that mapped coincident with a QTL (within the 1-LOD support interval) could conceivably provide a functional link (Table 2). Six of these (HT089, HT175, HT185, HT215, HT216, and HT227) are ion channel or transport proteins that may regulate mineral ion uptake: all six map to the same genomic location as QTLs underlying variation in the mineral ion content of leaves. The other seven genes (HT008, HT087, HT103, HT160, HT179, HT189, and HT200) map coincident with QTLs for traits associated with morphology and development. Three of these, HT087, HT160, and HT179, are putative transcription factors and two (HT008 and HT200) encode homologs of auxin-regulated proteins. HT189 may regulate cell division and HT103 encodes a COP1 homolog.
Discussion
Prospects for SNP discovery and EST mapping
This study reports the mapping of 243 ESTs via DHPLC genotyping of SNP and length polymorphisms, including genes potentially involved in traits such as plant growth and development, in the cultivated sunflower, H. annuus. These markers were derived from an extensive EST database (>67,000 ESTs and 18,000 unigenes) for sunflower (http://cgpdb.ucdavis.edu), which is proving to be a rich source for gene discovery. The EST sequencing strategy and database were specifically designed to allow for the identification of potential polymorphisms by computational approaches. Of 535 primer pairs developed from the database, 80% amplified clear PCR products and 51% were shown to be polymorphic in our mapping population. These values are comparable to those reported for two species of Pinus, where 67– 86% of 90 ESTs were successfully amplified and 40–52% of those that amplified were polymorphic in mapping populations when analyzed by denaturing gradient gel electrophoresis and/or single-strand conformational polymorphism analysis (Komulainen et al. 2003). In contrast, only 28 (18.6%) of 150 ESTs sequenced in two parental lines of soybean were polymorphic (Zhang et al. 2004). The disparity in these results could be due to sampling strategies or inherent differences in levels of polymorphism between these taxa, with sunflower (Sanitagne and Rieseberg, unpublished) and pines (Brown et al. 2004) having more diversity than soybean (Shoemaker and Specht 1995; Zhu et al. 2003).
Our assays for genes identified in silico as being polymorphic had a much higher success percentage (72 vs. 37%) than assays designed from EST sequences with no a priori evidence for polymorphism. Sequencing more diverse EST libraries within cultivated sunflower or from wild relatives could, therefore, enhance the number of polymorphisms discovered. It is questionable, however, whether all these polymorphisms would also be segregating in the available mapping populations. As shown in recent studies in maize and its wild relative teosinte (Wright et al. 2005), cultivated maize harbors much less polymorphism than teosinte. Consequently, matching of SNP discovery with methods for SNP mapping seems advisable.
There are currently several SNP genotyping methods available (Kwok 2001). The recently developed DHPLC technique has a reported sensitivity and specificity of consistently greater than 96%, surpassing other mutation detection methods such as single-strand conformation analysis and denaturing gradient gel electrophoresis (Spiegelman et al. 2000). Moreover, DHPLC allows for automation through sample set up in 96-well format, loading crude PCR products directly without further purification (Xiao and Oefner 2001). As shown by this study, directed sequencing strategies in conjunction with DHPLC can provide accurate, automated, rapid, and economical genotypes that contribute to the analysis of DNA sequence variation.
The markers mapped to all 17 of the sunflower linkage groups. As expected, EST markers showing deviations from Mendelian ratios mapped close to SSR markers that showed the same inheritance. These EST markers will increase the overall map length and density of markers available to sunflower researchers, and as they are used with larger populations, the precise local ordering of loci will allow for fixing the positions of the loci mapped at 3> LOD >2. In retrospect, no overall reason for map imprecision or unlinked status can be assigned to the 82 markers in these categories. In general, these markers do not have higher missing data or more extreme deviations from 1:1 segregation ratios. One possibility is that the initial contigs contained orthologs and paralogs, a problem that could be circumvented by more stringent parameter choice in the CAP3 assembly. The number of markers mapped for each LG was close to expected for the majority of LGs; however, some LGs showed greater (e.g., LG10) or fewer (e.g., LG2) markers than expected. While it is tempting to think this may reflect an uneven distribution of expressed genes across LGs in the sunflower genome, these patterns must be considered tentative at this point.
Possible functions of ESTs
Colocalization of ESTs and QTLs provides clues regarding the possible function of the former and represents a possible strategy for the identification of genes underlying ecologically and/or agriculturally important traits (Pflieger et al. 2001; Wright et al. 2005). These studies are by nature suggestive rather than definitive, intending to provide plausible functional links between genes and their function from two different experimental approaches. Thus, all of the associations seen in this and other studies will need to be confirmed experimentally. While some of the associations will undoubtedly prove spurious, the merging of these data should provide an overall more rapid advance in our understanding compared to other methods.
In the present study, we identified six genes (HT089, HT175, HT185, HT215, HT216, and HT227) that may contribute to the regulation of mineral ion uptake (Table 2) and possibly to salt tolerance. We have previously shown that salt tolerance in sunflowers is achieved through the exclusion of toxic mineral ions such as Na, B, Mg, and Mn and the preferential uptake of Ca (Lexer et al. 2003). HT089, e.g., encodes a putative transmembrane G-protein-coupled receptor and maps coincident with QTLs controlling leaf Ca, Mg, and Mn uptake. HT175 is homologous to a cyclic nucleotide and calmodulin- regulated ion channel protein and maps coincident with QTLs controlling leaf Mg and Mn uptake. The homolog in Arabidopsis has been implicated in K+ transport (Kohler et al. 1999), which may have pleiotropic effects on Mg and Mn uptake (White 1997). Likewise, HT185 appears to encode an ER-type Ca pump protein and represents an excellent functional match for the Ca uptake QTL that maps with it. HT215, HT216, and HT227 are potentially involved in membrane or cation transport, functions which are consistent with the role in ion uptake suggested by the QTLs associated with them (Table 2).
Several other mapped genes may contribute to variation in morphology and development. For instance, an APETALA2 (AP2)-like protein (HT160) maps coincident with QTLs controlling flowering time and achene size (Table 2). AP2 is a floral homeotic gene, and AP2 and AP2-like proteins play important roles in the control of flower and seed development (Okamuro et al. 1997; Maes et al. 2001; Aukerman and Sakai 2003; Faris et al. 2003). Likewise, a putative cell division control protein (HT189) colocalizes with QTLs affecting relative growth rate, leaf area, stem diameter, and height, whereas the bZIP transcription factors HT087 and HT179 are associated with stem and leaf size, and achene and disk size QTLs, respectively (Table 2). HT103 encodes a protein like COP1, which plays a key role on photomorphogenesis regulation (Ma et al. 2002) and maps coincident with QTLs for relative growth rate, leaf area, stem diameter, and initial seed weight. Finally, the putative auxin-repressed protein HT008 and auxin-regulated protein HT200 colocalize with QTLs underlying variation in relative growth rate and stem and leaf size, respectively, functions which are consistent with auxin’s important role in plant growth (Catala et al. 2000).
Caveats
Although several interesting associations were detected between ESTs and QTLs (above), the apparent match in position and function between ESTs and QTLs may be spurious. For example there are likely to be numerous genes within each 1-LOD QTL region, there is a lack of complete precision in both the marker and QTL maps, and there may be issues with gene duplicates. The situation is further complicated by the fact that some trait differences could be caused by types of genes that are not anticipated (e.g., mineral ion uptake; Table 2) and some genes have numerous possible phenotypic effects. For instance, locus HT218 encodes a putative acyl-CoA synthetase, which is known to be highly pleiotropic in Arabidopsis, causing reduced leaf size and plant growth, reduced seed production, and flower rates of seedling germination and establishment (Schnurr et al. 2004).
Despite these challenges, the EST/QTL associations reported here represent an important first step toward identifying the genes underlying ecologically and agriculturally important traits in sunflower. Studies designed to test these hypotheses currently underway include fine mapping of QTLs, microarray analyses of variation in RNA expression, and molecular evolutionary analyses of candidate genes (Church et al., unpublished), which may be an important way of identifying genes under selection in domestication (Wright et al. 2005). Verification of function will ultimately require transgenic complementation, RNA interference-mediated gene silencing, and/or mutational analyses. The positional information for ESTs provided here is thus a valuable starting resource for functional genomic studies in sunflower.
Acknowledgments
We thank Alex Kozik for processing and CAP3 assembly of the ESTs and Nolan Kane for editorial suggestions. We thank two anonymous reviewers for constructive suggestions on an earlier draft of the manuscript. We are grateful for the Center for Genomics and Bioinformatics at Indiana University for access to the DHPLC. Both the Center for Genomics and Bioinformatics and the Indiana Genomics Initiative provided funding for equipment used in this project. This research was supported by grant 2000-04922 from the United States Department of Agriculture and grant DBI0421630 from the United States National Science Foundation to LHR and grant NRI 2001-35301-09971 from the United States Department of Agriculture to KL.
Footnotes
Electronic Supplementary Material Supplementary material is available for this article at http://dx.doi.org/10.1007/s00122-005-0082-4
Communicated by R. Bernardo
Contributor Information
Z. Lai, Department of Biology and Center for Genomics and Bioinformatics, Indiana University, Bloomington, IN 47405, USA, E-mail: zlai@bio.indiana.edu, Tel.: +1-812-8559018, Fax: +1-812-8556705
K. Livingstone, Department of Biology, Trinity University, San Antonio, TX 78212, USA
Y. Zou, Department of Biology and Center for Genomics and Bioinformatics, Indiana University, Bloomington, IN 47405, USA
S. A. Church, Department of Biological Sciences, George Washington University, Washington, DC 20052, USA
S. J. Knapp, Center for Applied Genetic Technologies, Department of Crop and Soil Science, University of Georgia, Athens, Georgia 30602, USA
J. Andrews, Department of Biology and Center for Genomics and Bioinformatics, Indiana University, Bloomington, IN 47405, USA
L. H. Rieseberg, Department of Biology and Center for Genomics and Bioinformatics, Indiana University, Bloomington, IN 47405, USA
References
- Andersen JR, Lubberstedt T. Functional markers in plants. Trends Plant Sci. 2003;8:554–560. doi: 10.1016/j.tplants.2003.09.010. [DOI] [PubMed] [Google Scholar]
- Aukerman MJ, Sakai H. Regulation of flowering time and floral organ identity by a microRNA and its APETALA2-like target genes. Plant Cell. 2003;15:2730–2741. doi: 10.1105/tpc.016238. [DOI] [PMC free article] [PubMed] [Google Scholar]
- Berry ST, Leon AJ, Hanfrey CC, Challis P, Burkholz A, Barnes SR, Rufener GK, Lee M, Caligari PDS. Molecular marker analysis of Helianthus annuus L. 2. Construction of a RFLP linkage map for cultivated sunflower. Theor Appl Genet. 1995;91:195–199. doi: 10.1007/BF00220877. [DOI] [PubMed] [Google Scholar]
- Brown GR, Gill GP, Kuntz RJ, Langley CH, Neale DB. Nucleotide diversity and linkage disequilibrium in loblolly pine. Proc Natl Acad Sci USA. 2004;101:15255–15260. doi: 10.1073/pnas.0404231101. [DOI] [PMC free article] [PubMed] [Google Scholar]
- Burke JM, Rieseberg LH. The fitness effects of transgenic disease resistance in wild sunflowers. Science. 2003;300:1250. doi: 10.1126/science.1084960. [DOI] [PubMed] [Google Scholar]
- Burke JM, Tang S, Knapp SJ, Rieseberg LH. Genetic analysis of sunflower domestication. Genetics. 2002;161:1257–1267. doi: 10.1093/genetics/161.3.1257. [DOI] [PMC free article] [PubMed] [Google Scholar]
- Burke JM, Lai Z, Salmaso M, Nakazato T, Tang S, Heesacker A, Knapp SJ, Rieseberg LH. Comparative mapping and rapid karyotypic evolution in the genus Helianthus. Genetics. 2004;167:449–457. doi: 10.1534/genetics.167.1.449. [DOI] [PMC free article] [PubMed] [Google Scholar]
- Catala C, Rose JKC, Bennett AB. Auxin-regulated genes encoding cell wall-modifying proteins are expressed during early tomato fruit growth. Plant Physiol. 2000;122:527–534. doi: 10.1104/pp.122.2.527. [DOI] [PMC free article] [PubMed] [Google Scholar]
- Cho RJ, Mindrinos M, Richards DR, Sapolsky RJ, Anderson M, Drenkard E, Dewdney J, Reuber TL, Stammers M, Federspiel N, Theologis A, Yang WH, Hubbell E, Au M, Chung EY, Lashkari D, Lemieux B, Dean C, Lipshutz R, Ausubel FM, Davis RW, Oefner PJ. Genome-wide mapping with biallelic markers in Arabidopsis thaliana. Nat Genet. 1999;23:203–207. doi: 10.1038/13833. [DOI] [PubMed] [Google Scholar]
- Clarke B, Lambrecht M, Rhee SY. Arabidopsis genomic information for interpreting wheat EST sequences. Funct Integr Genomics. 2003;3:33–38. doi: 10.1007/s10142-002-0075-1. [DOI] [PubMed] [Google Scholar]
- FAOSTAT. Agricultural Production, Crops Primary Database. 2004. [Google Scholar]
- Faris JD, Fellers JP, Brooks SA, Gill BS. A bacterial artificial chromosome contig spanning the major domestication locus Q in wheat and identification of a candidate gene. Genetics. 2003;164:311–321. doi: 10.1093/genetics/164.1.311. [DOI] [PMC free article] [PubMed] [Google Scholar]
- Fernandez P, Paniego N, Lew S, Hopp HE, Heinz RA. Differential representation of sunflower ESTs in enriched organ-specific cDNA libraries in a small scale sequencing project. BMC Genomics. 2003;4:40. doi: 10.1186/1471-2164-4-40. [DOI] [PMC free article] [PubMed] [Google Scholar]
- Gedil MA, Wye C, Berry ST, Seger B, Peleman J, Jones R, Leon A, Slabaugh MB, Knapp SJ. An integrated RFLP–AFLP linkage map for cultivated sunflower. Genome. 2001;44:213–221. [PubMed] [Google Scholar]
- Gentzbittel L, Vear F, Zhang YX, Berville A, Nicolas P. Development of a consensus linkage RFLP map of cultivated sunflower (Helianthus annuus L.) Theor Appl Genet. 1995;90:1079– 1086. doi: 10.1007/BF00222925. [DOI] [PubMed] [Google Scholar]
- Gentzbittel L, Mestries E, Mouzeyar S, Mazeyrat F, Badaoui S, Vear F, de Labrouhe Tourvieille D, Nicolas P. A composite map of expressed sequences and phenotypic traits of the sunflower (Helianthus annuus L) genome. Theor Appl Genet. 1999;99:218–234. [Google Scholar]
- Gentzbittel L, Abbott A, Galaud JP, Georgi L, Fabre F, Liboz T, Alibert G. A bacterial artificial chromosome (BAC) library for sunflower, and identification of clones containing genes for putative transmembrane receptors. Mol Genet Genomics. 2002;266:979–987. doi: 10.1007/s00438-001-0622-9. [DOI] [PubMed] [Google Scholar]
- Giordano M, Oefner PJ, Underhill PA, Cavalli-Sforza L, Tosi R, Richiardi PM. Identification by denaturing high-performance liquid chromatography of numerous polymorphisms in a candidate region for multiple sclerosis susceptibility. Genomics. 1999;56:247–253. doi: 10.1006/geno.1998.5715. [DOI] [PubMed] [Google Scholar]
- Gupta PK, Rustgi S. Molecular markers from the transcribed/expressed region of the genome in higher plants. Funct Integr Genomics. 2004;4:139–162. doi: 10.1007/s10142-004-0107-0. [DOI] [PubMed] [Google Scholar]
- Harter AV, Gardner KA, Falush D, Lentz DL, Bye RA, Rieseberg LH. Origin of extant domesticated sunflowers in eastern North America. Nature. 2004;430:201–205. doi: 10.1038/nature02710. [DOI] [PubMed] [Google Scholar]
- Heywood VH. Flowering plants of the world. Prentice-Hall: Englewood Cliffs; 1978. [Google Scholar]
- Huang X, Madan A. CAP3: a DNA sequence assembly program. Genome Res. 1999;9:868–877. doi: 10.1101/gr.9.9.868. [DOI] [PMC free article] [PubMed] [Google Scholar]
- Jan CC, Vick BA, Miller JK, Kahler AL, Butler ETI. Construction of a RFLP linkage map for cultivated sunflower. Theor Appl Genet. 1998;96:15–22. [Google Scholar]
- Kohler C, Merkle T, Neuhaus G. Characterization of novel gene family of putative cyclic nucleotide and calmodulin- regulated ion channels in Arabidopsis thaliana. Plant J. 1999;18:97–104. doi: 10.1046/j.1365-313x.1999.00422.x. [DOI] [PubMed] [Google Scholar]
- Komulainen P, Brown GR, Mikkonen M, Karhu A, Garcia-Gil MR, O‘Malley D, Lee B, Neale DB, Savolainen O. Comparing EST-based genetic maps between Pinus sylvestris and Pinus taeda. Theor Appl Genet. 2003;107:667–678. doi: 10.1007/s00122-003-1312-2. [DOI] [PubMed] [Google Scholar]
- Kwok PY. Methods for genotyping single nucleotide polymorphisms. Annu Rev Genomics Hum Genet. 2001;2:235–258. doi: 10.1146/annurev.genom.2.1.235. [DOI] [PubMed] [Google Scholar]
- Lai Z, Nakazato T, Salmaso M, Burke JM, Tang S, Knapp SJ, Rieseberg LH. Extensive chromosomal repatterning and the evolution of sterility barriers in hybrid sunflower species. Genetics. 2005 doi: 10.1534/genetics.105.042242. (in press) [DOI] [PMC free article] [PubMed] [Google Scholar]
- Lander ES, Green P, Abrahamson J, Barlow A, Daly MJ, Lincoln SE, Newburg L. MAPMAKER: an interactive computer package for constructing primary genetic linkage maps of experimental and natural populations. Genomics. 1987;1:174–181. doi: 10.1016/0888-7543(87)90010-3. [DOI] [PubMed] [Google Scholar]
- Lexer C, Welch ME, Durphy JL, Rieseberg LH. Natural selection for salt tolerance quantitative trait loci (QTLs) in wild sunflower hybrids: implications for the origin of Helianthus paradoxus, a diploid hybrid species. Mol Ecol. 2003;12:1225–1235. doi: 10.1046/j.1365-294x.2003.01803.x. [DOI] [PubMed] [Google Scholar]
- Lexer C, Lai Z, Rieseberg LH. Candidate gene polymorphisms associated with salt tolerance in wild sunflower hybrids: implications for the origin of Helianthus paradoxus, a diploid hybrid species. New Phytol. 2004;161:225–233. doi: 10.1046/j.1469-8137.2003.00925.x. [DOI] [PMC free article] [PubMed] [Google Scholar]
- Lunde CF, Morrow DJ, Roy LM, Walbot V. Progress in maize gene discovery: a project update. Funct Integr Genomics. 2003;3:25–32. doi: 10.1007/s10142-002-0078-y. [DOI] [PubMed] [Google Scholar]
- Ma L, Gao Y, Qu L, Chen Z, Li J, Zhao H, Deng XW. Genomic evidence for COP1 as a repressor of light-regulated gene expression and development in Arabidopsis. Plant Cell. 2002;14:2383–2398. doi: 10.1105/tpc.004416. [DOI] [PMC free article] [PubMed] [Google Scholar]
- Maes T, Van de Steene N, Zethof J, Karimi M, D’Hauw M, Mares G, Van Montagu M, Gerats T. Petunia AP2-like genes and their role in flower and seed development. Plant Cell. 2001;13:229–244. doi: 10.1105/tpc.13.2.229. [DOI] [PMC free article] [PubMed] [Google Scholar]
- Okamuro JK, Caster B, Villarroel R, Montagu MV, Jofuku KD. The AP2 domain of APETALA2 defines a large new family of DNA binding proteins in Arabidopsis. Proc Natl Acad Sci USA. 1997;94:7076–7081. doi: 10.1073/pnas.94.13.7076. [DOI] [PMC free article] [PubMed] [Google Scholar]
- Perez-Vich B, Fernandez-Martinez JM, Grondona M, Knapp SJ, Berry ST. Stearoyl-ACP and oleoyl-PC desaturase genes cosegregate with quantitative trait loci underlying high stearic and high oleic acid mutant phenotypes in sunflower. Theor Appl Genet. 2002;104:338–349. doi: 10.1007/s001220100712. [DOI] [PubMed] [Google Scholar]
- Pflieger S, Lefebvre V, Causse M. The candidate gene approach in plant genetics: a review. Mol Breed. 2001;7:275–291. [Google Scholar]
- Rice P, Longden I, Bleasby A. EMBOSS: the European molecular biology open software suite. Trends Genet. 2000;16:276–277. doi: 10.1016/s0168-9525(00)02024-2. [DOI] [PubMed] [Google Scholar]
- Rieseberg LH, Choi H, Chan R, Spore C. Genomic map of a diploid hybrid species. Heredity. 1993;70:285–293. [Google Scholar]
- Rieseberg LH, Van Fossen C, Desrochers A. Hybrid speciation accompanied by genomic reorganization in wild sunflowers. Nature. 1995;375:313–316. [Google Scholar]
- Rieseberg LH, Raymond O, Rosenthal DM, Lai Z, Livingstone K, Nakazato T, Durphy JL, Schwarzbach AE, Donovan LA, Lexer C. Major ecological transitions in wild sunflowers facilitated by hybridization. Science. 2003;301:1211–1216. doi: 10.1126/science.1086949. [DOI] [PubMed] [Google Scholar]
- Ronning CM, Stegalkina SS, Ascenzi RA, Bougri O, Hart AL, Utterbach TR, Vanaken SE, Riedmuller SB, White JA, Cho J, Pertea GM, Lee Y, Karamycheva S, Sultana R, Tsai J, Quackenbush J, Griffiths HM, Restrepo S, Smart CD, Fry WE, van der Hoeven R, Tanksley S, Zhang P, Jin H, Yamamoto ML, Barker BJ, Buell CR. Comparative analyses of potato expressed sequence tag libraries. Plant Physiol. 2003;131:419–429. doi: 10.1104/pp.013581. [DOI] [PMC free article] [PubMed] [Google Scholar]
- Rozen S, Skaletsky H. Primer3 on the WWW for general users and for biologist programmers. In: Krawetz S, Misener S, editors. Bioinformatics methods and protocols: methods in molecular biology. Humana Press; Totowa: 2000. pp. 365–386. [DOI] [PubMed] [Google Scholar]
- Schnurr J, Shockey J, Browse J. The acyl-CoA synthetase encoded by LACS2 is essential for cuticle development in Arabidopsis. Plant Cell. 2004;16:629–642. doi: 10.1105/tpc.017608. [DOI] [PMC free article] [PubMed] [Google Scholar]
- Seiler GJ. Registration of 13-downy mildew tolerant inter specific sunflower germplasm lines derived from wild annual species. Crop Sci. 1991;31:1714–1716. [Google Scholar]
- Shoemaker RC, Specht JE. Integration of the soybean molecular and classical genetic-linkage groups. Crop Sci. 1995;35:436–446. [Google Scholar]
- Slabaugh MB, Yu JK, Tang SX, Heesacker A, Hu X, Lu GH, Bidney D, Han F, Knapp SJ. Haplotyping and mapping a large cluster of downy mildew resistance gene candidates in sunflower using multilocus intron fragment length polymorphisms. Plant Biotechnol J. 2003;3:167–185. doi: 10.1046/j.1467-7652.2003.00016.x. [DOI] [PubMed] [Google Scholar]
- Snow AA, Pilson D, Rieseberg LH, Paulsen M, Pleskac N, Reagon MR, Wolf DE. A Bt transgene reduces herbivory and enhances fecundity in wild sunflowers. Ecol Appl. 2003;13:279–286. [Google Scholar]
- Spiegelman JI, Mindrinos MN, Fankhauser C, Richards D, Lutes J, Chory J, Oefner PJ. Cloning of the Arabidopsis RSF1 gene by using a mapping strategy based on high-density DNA arrays and denaturing high-performance liquid chromatography. Plant Cell. 2000;12:2485–2498. doi: 10.1105/tpc.12.12.2485. [DOI] [PMC free article] [PubMed] [Google Scholar]
- Tamborindeguy E, Ben C, Liboz T, Gentzbittel L. Sequence evaluation of four specific cDNA libraries for developmental genomics of sunflower. Mol Gen Genomics. 2004;271:367–375. doi: 10.1007/s00438-004-0989-5. [DOI] [PubMed] [Google Scholar]
- Tang S, Yu JK, Slabaugh MB, Shintani DK, Knapp SJ. Simple sequence repeat map of the sunflower genome. Theor Appl Genet. 2002;105:1124–1452. doi: 10.1007/s00122-002-0989-y. [DOI] [PubMed] [Google Scholar]
- Thompson JD, Higgins DG, Gibson TJ. CLUSTAL W: improving the sensitivity of progressive multiple sequence alignment through sequence weighting, position-specific gap penalties and weight matrix choice. Nucleic Acids Res. 1994;22:4673–4680. doi: 10.1093/nar/22.22.4673. [DOI] [PMC free article] [PubMed] [Google Scholar]
- Wang DG, Fan JB, Siao CJ, Berno A, Young P, Sapolsky R, Ghandour G, Perkins N, Winchester E, Spencer J, Kruglyak L, Stein L, Hsie L, Topaloglou T, Hubbell E, Robinson E, Mittmann M, Morris MS, Shen N, Kilburn D, Rioux J, Nusbaum C, Rozen S, Hudson TJ, Lipshutz R, Chee M, Lander ES. Large-scale identification, mapping and genotyping of single-nucleotide polymorphisms in the human genome. Science. 1998;280:1077–1082. doi: 10.1126/science.280.5366.1077. [DOI] [PubMed] [Google Scholar]
- White PJ. The regulation of K+ influx into roots of rye (Secale cereale L.) seedings by negative feedback via the K+ flux from shoot to root in the phloem. J Exp Bot. 1997;48:2063–2073. [Google Scholar]
- Wright SI, Bi XX, Schroeder SG, Yamasaki M, Doebly JF, McMullen MD, Gaut BS. The effects of artifical selection on the maize genome. Science. 2005;308:1310–1314. doi: 10.1126/science.1107891. [DOI] [PubMed] [Google Scholar]
- Xiao WZ, Oefner PJ. Denaturing high-performance liquid chromatography: a review. Hum Mutat. 2001;17:439–474. doi: 10.1002/humu.1130. [DOI] [PubMed] [Google Scholar]
- Yu JK, Tang S, Slabaugh MB, Heesacker A, Cole G, Herring M, Soper J, Han F, Chu WC, Webb DM, Thompson L, Edwards KJ, Berry S, Leon AJ, Grondona M, Olungu C, Maes N, Knapp SL. Towards a saturated molecular genetic linkage map for cultivated sunflower. Crop Sci. 2003;43:367–387. [Google Scholar]
- Zhang WK, Wang YJ, Luo GZ, Zhang JS, He CY, Wu XL, Gai JY, Chen SY. QTL mapping of ten agronomic traits on the soybean (Glycine max L. Merr.) genetic map and their association with EST markers. Theor Appl Genet. 2004;108:1131– 1139. doi: 10.1007/s00122-003-1527-2. [DOI] [PubMed] [Google Scholar]
- Zhu YL, Song QJ, Hyten DL, Van Tassell CP, Matukumalli LK, Grimm DR, Hyatt SM, Fickus EW, Young ND, Gregan PB. Single-nucleotide polymorphisms in soybean. Genetics. 2003;163:1123–1134. doi: 10.1093/genetics/163.3.1123. [DOI] [PMC free article] [PubMed] [Google Scholar]