

Abstract
Aims
The purpose of this paper was to examine the development of social images or prototypes of cigarette, alcohol and marijuana users among children in the 1st through 8th grade using a Guttman unidimensional scaling approach.
Participants
Participants were 1075 1st through 5th grade children who completed annual assessments for four years.
Findings
The properties of a Guttman scale consisting of three sequential prototypes, (a) popular, (b) popular and exciting, and (c) popular, exciting and cool, were within acceptable limits for all three substances for 2nd through 8th graders, suggesting that these prototypes were scaleable and represented a single dimension. Prototypes became more positive after the 5th grade and varied by gender. Prototypes, moderated by age and gender, were related to intention to use substances in the future.
Discussion
Findings suggest that children’s prototypes of substance users are unidimensional and cumulative for all three substances and that they develop sequentially. The relation of prototypes to intention among children in the 2nd through the 8th grade support the Theory of Planned Behavior and the Prototype/Willingness model, but suggest incorporating age and gender.
Conclusions
Children as young as 2nd grade can reliably make valid judgments about attributes of kids who use substances. Results of this study have both theoretical and practical implications.
Keywords: Development, Attitudes, Children
INTRODUCTION
According to cognitive theories of behavior, attitudes play a central role in the etiology of behavior, including substance use. In the Theory of Reasoned Action and the Theory of Planned Behavior (Ajzen and Fishbein, 1980; Ajzen, 1988), attitudes and normative beliefs (or subjective norms) combine independently to determine behavioral intentions, which in turn are related to subsequent engagement in the behavior. Attitudes have been conceptualized as prototypes or social images of individuals engaging in the behavior. In Gibbon and Gerrard’s Prototype/Willingess Model (Gibbons and Gerrard 1995; 1997; Gibbons, et al., 2004), prototypes or social images, if desirable, increase intentions and willingness to engage in the behavior.
Empirical support for these theoretical models come from studies with adolescents that show a link between positive attitude, as defined both by beliefs regarding the use of a particular substance and the social image of the user, and subsequent initiation or increase in use of that substance. Studies have shown these links between attitude and use for smoking (Andrews, 2004; Garrard, et al., 2005; Maher and Rickwood, 1997; Piko, 2001), alcohol use (Stacy et al., 1994; Marcoux and Shope, 1997; Webb et al., 1996) and marijuana use (Morrison, et al., 2002; Stacy et al., 1994). Attitudes toward substance use have also been related to adolescents’ intention to use substances (Dinh et al., 1995; Higgins and Conner, 2003; Maher and Rickwood, 1997; McMillan, et al., 2005; O’Callaghan, et al., 1999) and willingness to use substances (Spijkerman, et al., 2004), which in turn are related to subsequent substance use (Choi, et al., 2001; Ellickson, et al., 2001; Gibbons, et al., 2004; McMillan, et al., 2005).
In the current study, attitude is measured by the social image or prototype of a child who uses the substance. To our knowledge, previous studies have not examined the relation between social images of substance users and intentions in very young children. However, based on the findings from studies with adolescents relating attitudes to intentions, we can assume that young children’s prototypes are predictive of children’s intentions to use substances. Given this, it is important to know more about the development of social images or prototypes in young children, if children’s prototypes can be accurately measured, and if, as studies with adolescents indicate, children’s prototypes are related to their intention to use the substance in the future.
The primary purpose of the present paper is to construct and evaluate the Guttman properties of a scale which assesses social images of substance users and is suitable for young children, in the first through eighth grade. We have chosen to evaluate the Guttman properties of this scale for several reasons. First, a Guttman scale implies a developmental sequence of social images or prototypes. Thus a child may progress from attributing one specific characteristic to substance users, to attributing two characteristics to substance users (the previous one plus a new one), to attributing three characteristics to substance users (the previous two plus one new characteristic). Understanding the developmental sequence of prototypes in young children is potentially important for the design of prevention programs which target social influence variables, such as changing children’s social images of substance users. Second, if the Guttman properties are satisfactory, the unidimensionality of the scale is supported. The evaluation of these properties by the grade or age of the child is essential to assure that these scales are appropriate for all ages. Third, traditional measures of unidimensionality, such as internal consistency reliability measures are inadequate for items that occur in a developmental sequence. If items occur in a developmental sequence, the internal consistency reliability must necessarily increase with age. Although we expect developmental change in prototypes, we will also assess the stability of these prototypes between each consecutive grade as a second measure of the reliability of these scales.
A second purpose of the paper is to examine the development of social images or prototypes of substance users from the 1st through the 8th grade. The literature suggests a developmental shift in attitudes toward substance use during the elementary years. While mildly unfavorable at age 5 or 6, attitude towards substance use becomes increasingly negative until age 10 (Spiegler 1983; Fossey 1993). There is some evidence that after age 10 or 11 (4th and 5th grade), the negativity toward the use of substances declines and attitudes become more positive (Davies and Stacey 1972; Pisano and Rooney 1988). For example, Dinh et al., (1995) reported that students viewed smokers more positively in 7th grade than in 5th grade and Aloise-Young and Hennigan (1996), reported that smokers were perceived as more cool and more sociable by 8th graders, as compared to 5th graders.
Results of previous analyses with this data set (Andrews, et al., 2003) showed that boys were more likely than girls to identify alcohol, cigarettes and marijuana, were more likely than girls to intend to use tobacco and drink alcohol when older, and were more likely to use alcohol and cigarettes. Results from other regional studies (Costello, et al., 1999; Grady et al., 1986; Cohen, et al., 1990; Johnson et al., 1995) also suggest a higher prevalence of cigarette, alcohol and marijuana use among elementary school age boys than girls. Given the relation between prototypes and intention to use a substance and use of that substance, these results provide a rationale for an exploration of sex differences in prototypes.
A third purpose is to examine the relation between prototypes and intentions across grades. This examination will not only provide support for the validity of our measure of prototypes, but is also of substantive importance. Intentions are conceptualized as a mediator between prototypes and subsequent substance use in both the Theory of Planned Behavior (Ajzen & Fishbein, 1980) and the Prototype/Willingness model (Gibbons and Gerrard, 1995; 1997) and is often conceptualized as a precursor to initiation (Ellickson et al., 2001; Wakefield et al., 2004). In a previous study with this data set, we have shown a positive prospective relation between intentions and use (Andrews, et al., 2003). With this in mind, we will explore the cross-sectional relation between prototypes and intention to use the substance in the future. Based on research conducted with adolescents (Dinh et al., 1995; O’Cattan and Baglioni, 1999), we are predicting that positive prototypes will correlate with intentions across grades and for both genders.
METHOD
Overview of Design
This paper is based on data from the first four years of on ongoing study of risk factors associated with children’s and adolescent’s substance use, the Oregon Youth Substance Use Project (OYSUP). This study uses a cohort-sequential design (Schaie, 1965; 1970) wherein five grade cohorts were assessed annually for four years. (See: Andrews et al., 2003, for a complete description). Cohort is defined by the child’s grade at the first assessment (T1). Approximately 200 children in each of the 1st through 5th grades at the first assessment (i.e., five grade cohorts) were followed for four years resulting in a sample of 225 1st graders, 421 2nd graders, 617 3rd graders, 828 4th graders, 825 5th graders, 601 6th graders, 400 7th graders and 193 8th graders.1
Participants
Participants at T1
Of the 1075 T1 students from whom we obtained active parental consent, 1070 children completed the first assessment. The remaining five students were absent on the assessment day. An average of 215 students per grade (1st through 5th) participated in the study at T1 with an even distribution by gender (50.3% female, N = 538). With minor exceptions, the adolescents in the T1 sample were representative of elementary students in the school district, specifically, and in Oregon, in general. (The reader is referred to Andrews, et al., 2003, for more details regarding the design of the study and the characteristics of the sample). At the time of the first assessment (T1), participants were an average of 9.0 years old (SD = 1.45), 71% of mothers and 66% of fathers had more than a high school education, and 7% of mothers and 11% of fathers had not graduated from high school. The sample was primarily Caucasian (85.8%), with 7.1% Hispanic, 1.1% African-American, 2.2% Asian, 2.4% American Indian or Alaskan Native, and 1.7% other or of mixed race/ethnicity. Forty percent of the sample was eligible for a free or reduced lunch under Title 1, an indicator of low family income.
Attrition
Fifty-four children, who participated in the T1 assessment, did not participate in the T4 assessment (5.0% of the total sample). Attrition between two sequential assessments was highest between the first and second assessment, (3.7%). Children who participated in the study at T4 were similar to those who did not participate on intention to use alcohol, marijuana, and cigarettes, and on demographic variables.
Assessment Procedures
Students who had active parental consent were recruited for an assessment. At the time of each assessment, students were explained the study and completed an assent. At T1, all consenting students were assessed at their school during the school day. If students were absent on the assessment day, they were assessed on a make-up day. At T2 through T4, the assessment location varied depending upon where the child lived: If students attended school in the district, they were assessed at their school; If they lived outside the district but within driving range of the Oregon Research Institute, they were assessed at the institute; and If they did not live within driving range, 4th and 5th graders were assessed via the telephone and 2nd and 3rd graders were not assessed until they entered 4th grade. All assessors were trained in confidentiality procedures and questionnaires were identified by a participant identification number only.
The 1st through 3rd grade assessment was an individual interactive structured interview wherein children were shown pictures of substances including cigarettes, alcoholic beverages (including beer and hard liquor), and marijuana. All assessments were conducted in private. If children could name the substance (or indicated that they recognized it), they were asked further questions about it. The rest of the interview used a procedure similar to that used by Blinn-Pike et al., (1993) and Jahoda and Cramond (1972). Children put pictures of each substance into one of three labeled boxes that corresponded to their answers. If 1st through 3rd graders did not identify a substance, they were asked no further questions about it. Most children identified cigarettes and alcohol, but relatively few identified marijuana.2 Hence, for 1st through 3rd graders, we restricted our analyses to those involving alcohol and cigarettes.
Fourth through 8th graders answered questions about all substances using a written questionnaire in group sessions. For 4th and 5th graders, a trained monitor read the questions aloud to the group and another monitor answered questions on an individual basis; for 6th through 8th graders, children read the questions to themselves and a trained monitor was available to answer questions. If children in the 6th through 8th grade could not read the questionnaire to themselves, the monitor read it to them. Items asked were similar across grades.
Measures
Characteristics of substance users for the assessment of social images or prototypes were selected from a list of attributes of smokers examined by Dinh and colleagues (1995) in a prospective study of 5th and 7th graders. Attributes in the Dinh study were derived from a content analysis of tobacco advertisements. Three attributes of smokers were selected from this study that: a) were endorsed more frequently, b) discriminated between those who smoked weekly in 9th grade and those who did not, and c) changed as a function of the child’s age. Attributes selected for the present study were “exciting”, “cool or neat”, and “popular”. Thus, all children in the present study were asked if “Kids who smoke cigarettes (drink alcohol; smoke marijuana) are “cool or neat”, “exciting”, or “popular or liked by other kids”. A three- point response format was used for each question, with “Yes” coded as 2, “No” as 0, and “Maybe” as 1.
To assess future intention, all children were asked: “Do you think you would (smoke, drink alcohol, etc.) when you are grown-up?” and “Do you think you would (smoke, drink alcohol, etc.) when you are a teenager?” or “in high school” for 7th and 8th graders. A three- point response format was used for each question, with “Yes” coded as 2, “No” as 0, and “maybe” as 1. Correlations between these two items for each grade ranged from .54 to .76 for cigarettes, from .45 to .62 for alcohol, and from .49 to .79 for marijuana. The two items were summed to measure intention.
RESULTS
Intraclass Correlation of Attitude Within School
In this study, students were originally recruited from 15 elementary schools. A standard assumption of most analytic methods is that the data are obtained from a random sample from a given population (in this case the school district) with independence of observations. If there is substantial intragroup dependence within schools, the assumption of independent observations is violated, resulting in a decrease in the standard error and an increase in the probability of a Type I error. Thus, our preliminary analyses included an examination of the intraclass correlation (ICC) within school at the T1 assessment for each of the attitude variables. For this analysis, children’s responses to the three items were summed. The ICC within school for attitude regarding alcohol users was .001, for attitude regarding marijuana users was .015, and for attitude regarding cigarette users was .004. For intention, the ICC within each school was .015 for intention to drink alcohol, .018 for intention to smoke and .001 for intention to smoke marijuana. The size of these ICCs suggests little clustering within school and only a small effect of the ICC on the standard error of the estimate in analyses collapsing across schools.
Examination of Cohort Effects
Since we planned to conduct analyses by grade, collapsing across cohort (defined by grade at T1), it was necessary to show that there were no or few differences by cohort. For these analyses, we used items based on a three-point response format and averaged across prototypes. Since the data for 1st and 8th graders was provided by only one cohort, we examined the effect of cohort on attitude only for 2nd through 7th graders. We sought to minimize the probability of Type II errors by increasing our alpha level to .10 for these analyses. Cohort effects were minimal and were found for specific substances and for specific grades3. Children in the 4th grade and 5th grade cohorts had less positive social images of users and higher intentions to use substances when they were in specific grades than the other cohorts. These few differences between cohorts justified collapsing across cohorts for subsequent analyses.
Guttman Properties
Analyses of prototypes of cigarette and alcohol users were conducted for 1st through 8th graders. Since a relatively small proportion of 1st through 3rd graders identified marijuana, analyses of prototypes of marijuana users were limited to 4th through 8th graders. Two Guttman scales for each grade and for each substance were created. For the one scale, the three-point scale was preserved, assuming a coding of “No” = 0, “Maybe” = 1, and “Yes” = 2 (trichotomous response format). For the other scale, dichotomous items were created, combining “Maybe’s and “Yes’s” (dichotomous response format).
Properties based on the dichotomous response format. Guttman scales were developed based on the percentages of children who attributed each characteristic to substance users. Across all substances, collapsing across grades, as well as cohorts, the characteristic of “popular or liked by others” was most prevalent, as measured by the proportion who answered “yes” or “maybe”, followed by the characteristic of “exciting” and then “cool or neat”. Specifically, 27.2% of 1st through 8th graders attributed “popular or liked by others”, 6.2% attributed “exciting”, and 3.8% attributed “cool or neat” to smokers; 26.1% attributed “popular or liked by others”, 58.6% attributed “exciting”, and 6.1% attributed “cool or neat” to alcohol users, and 21.6% of 4th through 8th graders attributed “popular or liked by others”, 5.2% attributed “exciting” and 3.8% attributed “cool or neat” to marijuana users. Based on these percentages, we created a Guttman scale illustrated in Figure 1 wherein attributions of individual characteristics to substance users are sequential and progress from: (1) attributing “popular or liked by others” to substance users; to (2) attributing “popular or liked by others” and “exciting”; and finally to (3) attributing “popular or liked by others”, “exciting”, and “cool or neat”. These characteristics and combination of characteristics are termed “pure scale types”. Deviations from this response pattern (e.g., attributing only “exciting” to substance users or attributing “popular or liked by others” and “cool or neat” to substance users”) are termed “error types”.
Figure 1.
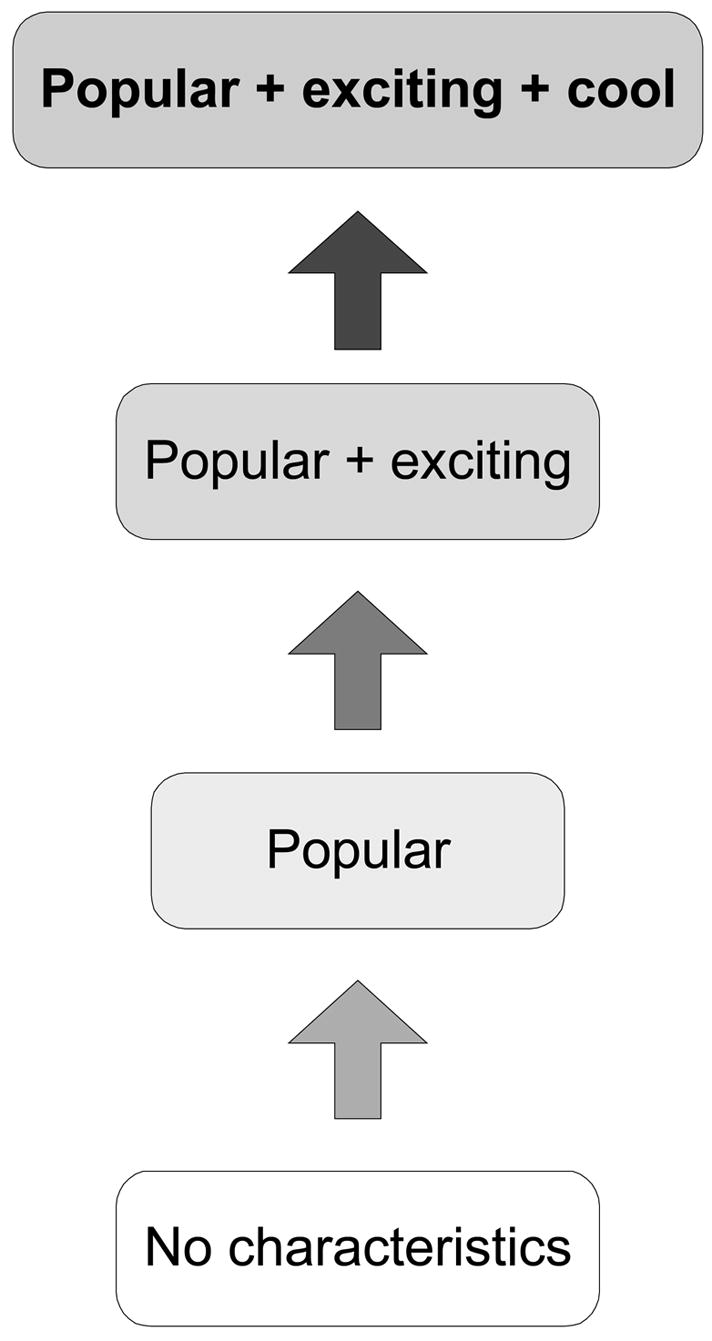
Proposed Guttman scale describing the developmental sequence of attributing characteristics to substance users.
We next examined the proportion of “pure scale types” as compared to “error scale types” for each substance by cohort, gender and grade. There were no cohort effects, allowing us to collapse across cohort for subsequent analyses. As shown in Table 1, the proportion of pure versus error types varied significantly as a function of grade for all three substances, cigarettes [X2 (7, n = 4066) = 58.19, p < .001], alcohol [X2 (7, n = 3992) = 119.18, p < .001], and marijuana [X2 (4, n = 2840) = 11.11, p < .05]. Across substances, the proportion of error types decreased until the 5th grade, and then increased from the 5th through the 8th grade.
Table 1.
Proportions Indicating Each Pattern of Prototype: Dichotomous Response Scale
| Grade
|
|||||||||
|---|---|---|---|---|---|---|---|---|---|
| Substance | Scale type | 1 | 2 | 3 | 4 | 5 | 6 | 7 | 8 |
| Cigarettes | “Pure” type | 90.0 | 95.1 | 95.7 | 98.5 | 98.5 | 98.0 | 96.8 | 96.4 |
| None | 66.8 | 71.6 | 64.7 | 75.6 | 75.7 | 69.3 | 67.0 | 65.8 | |
| Popular | 18.0 | 18.3 | 24.2 | 20.0 | 20.3 | 25.2 | 24.0 | 15.0 | |
| Popular, exciting | 3.8 | 4.7 | 5.5 | 1.6 | .9 | 2.0 | 2.8 | 4.1 | |
| Popular, exciting, cool | 1.4 | .5 | 1.3 | 1.5 | 1.7 | 1.5 | 3.0 | 11.4 | |
| “Error” type | 10.0 | 4.9 | 4.3 | 1.5 | 1.5 | 2.0 | 3.3 | 3.6 | |
|
| |||||||||
| Alcohol | “Pure” types | 85.3 | 92.2 | 95.9 | 98.4 | 98.9 | 97.8 | 95.7 | 95.3 |
| None | 66.0 | 65.8 | 64.2 | 77.0 | 79.7 | 74.1 | 66.2 | 59.6 | |
| Popular | 11.7 | 16.6 | 22.7 | 18.0 | 16.1 | 19.0 | 17.9 | 11.4 | |
| Popular, exciting | 5.1 | 4.5 | 5.0 | 1.6 | 1.8 | 1.8 | 3.0 | 5.2 | |
| Popular, exciting, cool | 2.5 | 5.3 | 4.0 | 1.8 | 1.3 | 2.8 | 8.6 | 19.2 | |
| “Error” type | 14.7 | 7.8 | 4.1 | 1.6 | 1.1 | 2.2 | 4.3 | 4.7 | |
|
| |||||||||
| Marijuana | “Pure” type | - | - | - | 98.9 | 99.3 | 98.3 | 98.2 | 96.4 |
| None | - | - | - | 81.3 | 81.4 | 75.1 | 74.2 | 63.5 | |
| Popular | - | - | - | 14.5 | 15.8 | 20.5 | 16.3 | 9.4 | |
| Popular, exciting | - | - | - | 2.2 | 1.0 | 1.3 | 3.0 | 4.2 | |
| Popular, exciting, cool | - | - | - | 1.0 | 1.1 | 1.3 | 4.8 | 19.3 | |
| “Error” type | - | - | - | 1.1 | .7 | 1.7 | 1.8 | 3.6 | |
Note: “Pure” scale types are responses that conform to a Guttman pattern. “Error” types deviate from these pure patterns.
An examination of gender effects within each grade showed that the proportion of error types was greater for girls than boys for prototypes of cigarette smokers among first graders [X2 (1, n = 401 = 4.62, p < .05)]. We found no gender differences in the proportion of error types for prototypes of cigarette smokers among 2nd through 8th graders or for prototypes of alcohol users and marijuana users across all grades. Since we found one grade by gender effect, Guttman properties are examined by both grade and gender.
Guttman properties for scales using the dichotomous response format for each grade and gender are shown in Table 2. The more conservative method of error counting, deviation from perfect reproducibility, recommended by Goodenough (1944) and Edwards (1948) was used to determine the Guttman properties of the scale. The coefficient of reproducibility (CR) has a minimum acceptable value of .90. As shown in Table 2, the CR is acceptable for 1st through 8th graders for cigarette users, for 1st through 8th grade boys and 2nd through 8th grade girls, for alcohol users, and for all grades for marijuana users. The CR did not meet criteria for alcohol users for 1st grade girls. The minimum marginal reproducibility (MMR), which reflects the reproducibility of the items, is based on the marginal distribution of the items, and should be lower than the CR. The MMR was lower than the CR across all substances for all grades. According to Menzel (1953) a coefficient of scaleability (CS), which interprets the difference between the CR and the MMR, of .60 is acceptable. The CS was acceptable for users of all substances for children in grades 2 through 8. For cigarette users, it was not acceptable for 1st grade boys and girls, and for alcohol users, it was not acceptable for 1st grade girls.
Table 2.
Guttman Properties of Cigarette, Alcohol and Marijuana Attitude Scales Grades 1 through 8: Dichotomous Response Scale
| Boys
|
Girls
|
||||||||
|---|---|---|---|---|---|---|---|---|---|
| Substance | Grade | N | CR | MMR | CS | N | CR | MMR | CS |
| Cigarettes | 1 | 104 | .94 | .88 | .53 | 107 | .93 | .84 | .54 |
| 2 | 195 | .97 | .88 | .74 | 210 | .97 | .88 | .71 | |
| 3 | 289 | .96 | .86 | .74 | 315 | .98 | .85 | .86 | |
| 4 | 407 | .99 | .91 | .93 | 420 | .99 | .89 | .88 | |
| 5 | 418 | .99 | .90 | .89 | 405 | .99 | .90 | .92 | |
| 6 | 310 | .99 | .89 | .92 | 292 | .98 | .85 | .86 | |
| 7 | 210 | .99 | .86 | .79 | 191 | .97 | .84 | .78 | |
| 8 | 100 | .98 | .79 | .91 | 93 | .97 | .78 | .87 | |
| Alcohol | 1 | 101 | .93 | .83 | .60 | 96 | .87 | .82 | .25 |
| 2 | 187 | .96 | .81 | .79 | 187 | .94 | .84 | .60 | |
| 3 | 284 | .97 | .84 | .81 | 297 | .98 | .83 | .85 | |
| 4 | 406 | .99 | .92 | .88 | 420 | .99 | .89 | .90 | |
| 5 | 414 | .99 | .93 | .89 | 407 | .99 | .90 | .93 | |
| 6 | 310 | .99 | .90 | .87 | 292 | .98 | .87 | .88 | |
| 7 | 208 | .97 | .84 | .80 | 190 | .98 | .78 | .89 | |
| 8 | 100 | .99 | .75 | .95 | 93 | .95 | .67 | .85 | |
| Marijuana | 4 | 404 | .99 | .93 | .88 | 418 | .99 | .91 | .93 |
| 5 | 418 | .99 | .93 | .91 | 406 | 1.00 | .92 | .96 | |
| 6 | 309 | .99 | .91 | .89 | 293 | .99 | .89 | .89 | |
| 7 | 209 | .99 | .87 | .92 | 191 | .99 | .86 | .90 | |
| 8 | 99 | .98 | .74 | .92 | 93 | .97 | .72 | .90 | |
Note. CR = Coefficient of Reproducibility (>.90 = Acceptable), MMR = Minimum Marginal Reproducibility (should be lower than CR); CS = Coefficient of Scalability (>.60 = Acceptable).
Properties based on the trichotomous response format
In this scale, all three responses were used (“yes”, “no” and “maybe”). “No” was coded 0, “maybe” was coded 1, and “yes” was coded 2. For pure scale types, responses to prototypes were in order (e.g. popular followed by exciting and then by cool). “Maybe” to a later prototype could follow a “maybe” or “yes” to a preceding prototype and “yes” to a later prototype could follow a “yes” to a preceding prototype”. Thus, according to this “liberal” definition of pure scale type, a response of “maybe” to all three prototypes was considered pure. Responses were considered error types, if a “yes” to a later prototype was not preceded by a “yes” to a preceding prototype and “maybe” to a later prototype was not preceded by a “yes” or “maybe” on earlier prototypes.
We examined the proportion of “pure scale types” as compared to “error scale types” for each substance by cohort, gender and grade. There were no cohort effects, allowing us to collapse across cohort for subsequent analyses. Similar to the dichotomous scale, the proportion of pure versus error types varied significantly as a function of grade for all three substances, cigarettes [X2 (7, n = 4066) = 59.20, p < .001], alcohol [X2 (7, n = 3988) = 119.01, p < .001], and marijuana [X2 (4, n = 2840) = 17.17, p < .05]. An examination of gender effects within each grade showed that the proportion of error types was significantly greater for girls than boys for prototypes of alcohol users among first graders [X2 (1, n = 197 = 5.10, p < .05)]. We found no gender effects in the proportion of error types for prototypes of cigarette smokers or marijuana users across all grades and for prototypes of alcohol users for 2nd through 8th graders. Since we found one grade by gender effect, Guttman properties were examined by grade and gender (See results in Table 3). As shown in Table 3, properties are within acceptable limits for all but 1st grade boys for cigarette users and 1st grade girls for alcohol users. For these groups of 1st graders and for these substances, the CS was lower than the acceptable range (<.60).
Table 3.
Guttman Properties of Cigarette, Alcohol and Marijuana Attitude Scales Grades 1 through 8: Trichotomous Response Scale
| Boys
|
Girls
|
||||||||
|---|---|---|---|---|---|---|---|---|---|
| Substance | Grade | N | CR | MMR | CS | N | CR | MMR | CS |
| Cigarettes | 1 | 104 | .96 | .93 | .51 | 107 | .96 | .90 | .60 |
| 2 | 195 | .99 | .93 | .80 | 210 | .98 | .93 | .72 | |
| 3 | 289 | .98 | .92 | .79 | 315 | .99 | .92 | .84 | |
| 4 | 407 | 1.00 | .95 | .94 | 420 | .99 | .94 | .87 | |
| 5 | 418 | .99 | .94 | .87 | 405 | 1.00 | .95 | .91 | |
| 6 | 310 | 1.00 | .94 | .93 | 292 | .99 | .91 | .88 | |
| 7 | 210 | .99 | .93 | .92 | 191 | .98 | .91 | .81 | |
| 8 | 100 | .99 | .88 | .92 | 93 | .99 | .88 | .88 | |
| Alcohol | 1 | 101 | .96 | .90 | .63 | 96 | .92 | .89 | .29 |
| 2 | 187 | .98 | .89 | .79 | 187 | .96 | .91 | .61 | |
| 3 | 284 | .98 | .90 | .81 | 297 | .98 | .91 | .83 | |
| 4 | 406 | .99 | .95 | .88 | 420 | .99 | .94 | .90 | |
| 5 | 414 | 1.00 | .96 | .88 | 407 | 1.00 | .95 | .94 | |
| 6 | 310 | .99 | .94 | .88 | 292 | .99 | .93 | .89 | |
| 7 | 208 | .98 | .91 | .79 | 190 | .99 | .88 | .90 | |
| 8 | 100 | .99 | .84 | .92 | 93 | .97 | .80 | .84 | |
| Marijuana | 4 | 404 | 1.00 | .96 | .88 | 418 | 1.00 | .95 | .93 |
| 5 | 418 | 1.00 | .96 | .90 | 406 | 1.00 | .96 | .94 | |
| 6 | 309 | .99 | .94 | .89 | 293 | .99 | .94 | .89 | |
| 7 | 209 | .99 | .93 | .88 | 191 | .99 | .92 | .87 | |
| 8 | 99 | .99 | .84 | .94 | 93 | .98 | .84 | .87 | |
Note. CR = Coefficient of Reproducibility (>.90 = Acceptable), MMR = Minimum Marginal Reproducibility (should be lower than CR); CS = Coefficient of Scalability (>.60 = Acceptable).
The Development of Prototypes Across the 1st Through the 8th Grade
Since the Guttman properties of the scale with the trichotomous response format were satisfactory for all 2nd through 8th graders and were marginal for 1st graders, we constructed a scale through averaging the three attributes to examine the development of prototypes across the elementary years. Means of this scale by grade are shown in Table 4. Results of analyses of variance by grade and gender showed a main effect of grade for cigarettes, F(7,4050) = 7.58, p < .001, and alcohol, F(7,3991) = 25.80, p < .001, across the 1st through the 8th grades and marijuana, across the 4th through the 8th grades, F(4, 2835) = 37.20, p < .001. As shown in Table 3, in general prototypes are initially more positive, decrease in the 4th and 5th grade, increase again in the 6th grade (middle school) and peak in the 8th grade. The differences between grade groups were further analyzed using Scheffe’s multiple range test. For prototypes of cigarette users, 3rd graders’ prototypes were significantly more positive (alpha <.05) than 4th and 5th graders’ prototypes and 8th graders’ prototypes were significantly more positive than 2nd, 4th, 5th, and 6th graders’ prototypes. For prototypes of alcohol users, 1st, 2nd and 3rd graders’ prototypes were significantly more positive than 4th and 5th graders’, 7th graders’ prototypes were significantly more positive than 4th, 5th and 6th graders’ and 8th graders’ prototypes were significantly more positive than the prototypes of students in all the other grades. For prototypes of marijuana users, 7th graders’ prototypes were significantly more positive than 4th and 5th graders’ prototypes and 8th graders’ prototypes were significantly more positive than the prototypes of students in the 4th through the 7th grade.
Table 4.
Means of Prototypes of Substance Users for Each Grade
| Cigarette Use | Alcohol Use | Marijuana Use | ||||
|---|---|---|---|---|---|---|
| Grade | M | S.D. | M | S.D. | M | S.D. |
| 1 | .52 | .92 | .63 | 1.10 | -- | -- |
| 2 | .41 | .75 | .62 | 1.06 | -- | -- |
| 3 | .51 | .87 | .57 | .97 | -- | -- |
| 4 | .35 | .73 | .33 | .72 | .27 | .63 |
| 5 | .35 | .77 | .28 | .64 | .24 | .58 |
| 6 | .45 | .82 | .41 | .86 | .37 | .79 |
| 7 | .50 | .88 | .65 | 1.15 | .47 | 1.01 |
| 8 | .72 | 1.21 | 1.08 | 1.61 | .97 | 1.52 |
Note. Means are based on a trichotomous response scale, ranging from 0 to 3.
For prototypes toward alcohol users, the main effect of gender was significant, F (1,3991) = 6.06, p < .05, with girls having more positive prototypes of alcohol users (M = .51) than boys (M = .44). The interactions between grade and gender were not significant for any substance.
Stability
Collapsing across cohorts, we assessed the stability of prototypes, using the trichotomous response format. In general stability coefficients were moderate4 and stability increased as a function of the grade of the child. Stability coefficients were lower for prototypes of marijuana users than for prototypes of alcohol or cigarette users. The lowest stability coefficients were between the 5th and 6th grade, reflective of the change from elementary to middle school.
Correlation of Prototypes and Intention
We conducted a series of multiple regression analyses to investigate the relation between prototypes of users of each substance and intention to use the substance in the future, with intention as the dependent variable. We limited these analyses to 2nd through 8th graders, since the Guttman properties of our measure of prototypes were not acceptable for all 1st graders. To examine the relation as a function of grade and gender, we included the two and three way interactions between grade and gender with prototypes in each initial model. To simplify the model, we used backwards elimination to remove non-significant interactions. We used techniques recommended by Aiken and West (1991) to decompose the significant interaction effects.
Prototypes of cigarette users significantly interacted with grade, B = .02, t = 3.58, p < .001, and gender, B = .05, t = 2.48, p < .05, to predict intention to smoke cigarettes when older. The three-way interaction was not significant. Simple slope analysis of the two-way interaction of prototypes with grade showed that prototypes significantly predicted intention for all grades, but the effect increased as the child got older5. Simple slope analysis within each grade of the two-way interaction of prototypes with gender showed a larger effect for girls for all grades. While, in the first through the fifth grades, the effect was significant for girls, it was not significant for boys. Effects were significant for both boys and girls in the 6th through the 8th grade, but larger for girls.
In the prediction of intention to use alcohol, the three-way interaction of prototypes of alcohol users, age and gender was significant (B = .28, t = 5.22, p < .0001). Decomposition of this three way interaction showed that for girls the two way interaction of age with prototypes was significant (B = .32, t = 6.74, p < .001), but for boys it was not. However, for boys the main effect of prototypes of alcohol users was a significant predictor of intention, B = .12, t = 7.23, p < .001, collapsing across grades. Decomposition of the two-way interaction between age and prototypes for girls showed that the relation between prototypes of alcohol users and intention to use alcohol was significant for 4th through 8th grade girls, with the effect size increasing as a function of grade6. The relation was not significant for 2nd and 3rd grade girls.
In the prediction of intention to use marijuana, the two-way interaction between prototypes and grade was significant, B = .63, t = 8.01, p < .001. As for cigarettes and alcohol, the relation was significant for all grades and effect sizes increased as the child got older7.
DISCUSSION
Based on an examination of the percentage of children who attributed each characteristic to substance users, we constructed a Guttman scale of prototypes with three sequential levels: (a) “popular or liked by others”, (b) “popular” and “exciting”, and (c) “popular”, “exciting” and “cool”, for all three substances. With the exception of 1st graders, the properties of these Guttman scales were excellent indicating that prototypes are unidimensional and cumulative for all three substances. Children who attributed only one positive characteristic to “kids” who used substances, were more likely to attribute only the characteristic of “popular or liked by others to users”. Children who attributed two characteristics to substance users were more likely to attribute the characteristics of “popular” and “exciting”. If children attributed the characteristic of “cool” to users, they were also more likely to attribute the other two characteristics to user. As children grew older, the number of characteristics attributed to substance users increased. In addition, prototypes of substance users became increasingly positive after the 5th grade.
The relation of prototypes to intentions to use substance in the future supported the tenets of the Theory of Planned Behavior (Ajzen and Fishbein, 1980) and the Prototype/Willingness model (Gibbons and Gerrard, 1995; 1997). With few exceptions (e.g., Higgins and Conner, 2003), the Theory of Planned Behavior, when applied to substance use, has been tested with adolescents. This research provides support for this theoretical framework with elementary and middle school children.
The use of a Guttman scale
According to the minimum criteria, these three prototypes are scaleable and represent a single dimension. The traditional assessment of unidimensionality, that of internal consistency, is not applicable to these or other Guttman scales, as maximum internal consistency can only occur at the bottom (prior to endorsing any attributes) or top (endorsing all attributes) of the scale. Hence, the evaluation of the Guttman properties which assess error in the sequence are a better indication of the reliability of a sequential scale than are statistics based on internal consistency, such as Chronbach’s alpha. Stability across time is an appropriate measure of reliability of these and other Guttman scales. The combination of Guttman properties that meet minimum criteria for scalability and the stability of the scale suggest that the prototype scale is reliable across the 2nd through the 8th grade, for all substances.
We chose to use a unidimensional scaling technique, in contrast to multidimensional scaling, to assess prototypes because we believe prototypes are unidimensional in nature. Although attitude has been conceptualized as multidimensional consisting of several dimensions, including an evaluative, a cognitive and a behavioral dimension (Olson and Zanna, 1993), we believe that the prototype scale measures only one dimension of attitude, the evaluative dimension. Hence we have chosen unidimensional scaling to assess the dimensionality of prototypes. This unidimensional scaling method and extensions of it has been used extensively by researchers in the area of substance use to investigate the sequence of substance use initiation (Andrews, et al., 1991; Kandel; 1975; Ellickson et al., 1992).
While the dichotomous response format more easily describes the developmental progression of substance use and thus is useful for descriptive purposes, a scale based on the trichotomous response format has more variability and thus is more useful for prediction. Scales based on both response formats met the minimum acceptable criteria for a Guttman scale. We therefore recommend that the findings from the dichotomous scale be used for the development of social influence based prevention programs for children and teens, but that the trichotomous response scale be used for the evaluation of these programs and for studies investigating the etiology of substance use.
Prototypes as a function of age and gender
Although prototypes were unfavorable in the early grades, they decreased further in the 4th and 5th grade, most likely as a function of a larger emphasis on substance use prevention in these grades. For example, those students who remained in the district participated in DARE in the 5th grade. Replicating previous findings (e.g., Dinh, et al., 1995; Aloise-Young & Hennigan 1996), prototypes were more positive among middle school students than among 4th and 5th graders. We showed that prototypes became increasingly positive from the 6th through the 8th grade.
We found a gender effect only for prototypes of alcohol users. Girls had more positive prototypes of alcohol users than did boys. This is particularly interesting since the girls in this sample had a lower prevalence of alcohol use and lower intentions than did boys until 4th grade, but had a similar prevalence for 5th through 8th grade (Andrews, et al., 2003). This gender difference in prototypes of substance users could be partially an artifact of the measurement of this variable. Two of the three characteristics comprising this measure are related to the social aspects of substance use (“liked by others”; “cool or neat”). As an example, girls may be more likely to respond positively to “are liked by others” because of their greater concern about rejection by friends (Berndt, 1982). On the other hand, girls may view alcohol users more positively than do boys.
Relation of prototypes to intention
As predicted, prototypes were related to intention to use substances in the future, for all three substances. The strong relation between these two variables provides support for the Theory of Planned Behavior (Ajzen & Fishbein 1980; Ajzen 1988) and the Prototype/Willingness model (Gibbons & Gerrard 1995; 1997) for children through early adolescence. However, findings illustrate the need to incorporate the age of the individual and their gender into these models. The relation between prototypes and intention increased as a function of the grade of the child for both cigarette and marijuana use, for both genders, and, for girls only, for alcohol use. For boys, for alcohol use, the effect of prototypes on intention remained significant and stable from the 2nd through the 8th grade. Thus, in general, children’s social images of kids who use substances become more central to the acquisition process as the child gets older. In addition, the relation between prototypes of cigarette users and intention to smoke cigarettes was stronger for girls than boys, suggesting more support for these behavioral models for girls than boys. The relation between prototypes and intention across substances also provides validity for this measure of prototypes.
Implications for prevention
The finding of a strong relation between prototypes and intentions in young children suggest targeting social images of substance users in prevention programs. Several social influence substance use prevention programs (e.g., Andrews, et al., in preparation; Hansen and Graham, 1991; Sussman et al., 1995) incorporate changing social images in an effort to prevent subsequent initiation. These programs try to negate positive images of substance users by showing children the more negative aspects of substance users and more positive images of non-users. The findings that prototypes become increasingly positive after grade 5 suggests a program for 5th graders that reinforces their negative images of substance users, thus preventing an increase in positive attributions of substance users as the child gets older. Further, the sequential development of prototypes suggests age appropriate images to target. For example, for younger children, our results suggest a focus on negating the social image, “popular or liked by others”, and as children age, negating the social images, “exciting” and “cool”. Further, the stronger relation between prototypes and intention for girls suggests focusing on images that are relevant to girls, such as popularity.
CONCLUSIONS
Findings from this study suggest that children as young as 2nd grade can reliably make judgments about characteristics of children who use substances. Further, there is evidence supporting the validity of this measure of prototypes for these young children. Understanding the developmental sequence of the prototypes, “popular”, “exciting” and “cool” can help to guide the development of social influence components of substance use prevention programs.
Our finding that the relation between prototypes and intentions varies as a function of the age and gender of the child has both theoretical and practical implications. This finding suggests incorporating the moderating effect of age and gender into the Theory of Planned Behavior and the Prototype/Willingness model. Further, these findings emphasize the importance of prototypes to substance use prevention and provide guidance for those seeking to prevent substance use through changing prototypes. They suggest targeting children in 5th grade, prior to a positive increase in prototypes, with a particular emphasis on young girls.
Acknowledgments
This research was supported by Grant No. DA10767 from the National Institute of Drug Abuse. The authors wish to thank Sarah Hampson and Cheryl Lorenz for their helpful review of this manuscript and Christine Lorenz for her contribution in the preparation of this manuscript.
Footnotes
Cohort is defined by grade at T1. First graders were 1st graders at T1; 2nd graders were 2nd graders at T1 and T2 (1st graders at T1), 3rd graders were 3rd graders at T1, T2 (2nd graders at T1) and T3 (1st graders at T1); 4th graders were 4th graders at T1, T2 (3rd graders at T1), T3 (2nd graders at T1) and T4 (3rd graders at T3); 5th graders were 5th graders at T1, T2 (4th graders at T1), T3 (3rd graders at T1), and T4 (2nd graders at T1); 6th graders were 6th graders at T2 (5th graders at T1), T3 (4th graders at T1) and T4 (3rd graders at T1); 7th graders were 7th graders at T3 (5th graders at T1) and T4 (4th graders at T1); 8th graders were 8th graders at T4 (5th graders at T1).
Among 1st graders, 95% of boys and 93% of girls identified cigarettes, 93% of boys and 83% of girls identified alcohol, and .4% of boys and 11% of girls identified marijuana; among 2nd graders, 97% of boys and 96% of girls identified cigarettes, 93% of boys and 85% of girls identified alcohol, and 12% of boys and 15% of girls identified marijuana; among 3rd graders, 97% of boys and 98% of girls identified cigarettes, 96% of boys and 92% of girls identified alcohol and 25% of boys and 16% of girls identified marijuana.
When they were in the 5th grade, children in the 4th and 5th grade cohort (4th and 5th grade at T1) reported less positive prototypes of cigarette users, F (3,818) = 2.59, p = .052, of alcohol users (F (3, 816) = 4.85, = < .01) and of marijuana users, F(3,819) = 4.14, p < .01, than children in the 2nd or 3rd grade cohort. Children in the 4th grade cohort reported higher intentions to smoke cigarettes when older than children in the other cohorts when they were in the 4th grade, F(3,823) = 2.11, p = .097. Children who were in the 4th and 5th grade cohorts had higher intentions to smoke cigarettes when older, F(2,601) = 3.28, p < .05, and higher intentions to drink alcohol when older when they were in the 6th grade, F(2, 600) = 3.09, p < .05, than children who were in the 3rd grade cohort.
For prototypes of cigarette users, stability coefficients were: .25 between 1st and 2nd grade; .22 between 2nd and 3rd grade, .25 between 3rd and 4th grade, .22 between 4th and 5th grade, .16 between 5th and 6th grade, .28 between 6th and 7th grade and .30 between 7th and 8th grade. For prototypes of alcohol users, stability coefficients were: .29 between 1st and 2nd grade, .28 between 2nd and 3rd grade, .23 between 3rd and 4th grade, .37 between 4th and 5th grade, .23 between 5th and 6th grade, .31 between 6th and 7th grade, and .38 between 7th and 8th grade. For prototypes of marijuana users, stability coefficients were .34 between 4th and 5th grade, .19 between 5th and 6th grade, .23 between 6th and 7th grade, and .15 between 7th and 8th grade.
For second graders, B = .08, t = 2.02, p < .05, third graders, B = .10, t = 2.88, p < .01, fourth graders, B = .012, t = 3.616, p < .001, fifth graders, B = .13, t = 3.84, p < .001, sixth graders, B = .19, t = 5.45, p < .001, for seventh graders, B = .15, t = 4.16, p < .001, and eighth graders, B = .18, t = 4.49, p < .001.
For 4th grade girls, B = .12, t = 2.86, p < .01; for 5th grade girls, B = .12, t = 2.81, p < .01; for 6th grade girls, B = .16, t = 4.04, p < .001; for 7th grade girls, B = .25, t = 6.63, p < .001; and for 8th grade girls, B = .42, t = 10.41, p < .001.
For 4th graders, B = .13, t = 3.51, p < .001; for 5th graders, B =.14, t = 3.74, p < .001; for 6th graders, B = .22, t = 6.44, p < .001; for 7th graders, B = .31, t = 9.11, p < .001; and for 8th graders, B = .49, t = 15.21, p < .001.
References
- Aiken LS, West SG. Multiple regression: testing and interpreting interactions. Sage Publications; Newbury Park, CA: 1991. [Google Scholar]
- Ajzen I. Attitudes, personality and behavior. Open University Press; New York: 1988. [Google Scholar]
- Ajzen I, Fishbein M. Understanding attitudes and predicting social behavior. Prentice–Hall; Englewood Cliffs, NJ: 1980. [Google Scholar]
- Aloise-Young PA, Hennigan KM. Self-image, the smoker stereotype and cigarette smoking: developmental patterns from fifth through eighth grade. Journal of Adolescence. 1996;19:163–177. doi: 10.1006/jado.1996.0016. [DOI] [PubMed] [Google Scholar]
- Andrews JA, Gordon J, Hampson S. Developing an effective school-based tobacco prevention program for fifth grade children In preparation. [Google Scholar]
- Andrews JA, Hops H, Ary D, Lichtenstein E, Tildesley E. The construction, validation and use of a Guttman scale of adolescent substance use: an investigation of family relationships. Journal of Drug Issues. 1991;21(3):557–572. [Google Scholar]
- Andrews JA, Tildesley E, Hops H, Duncan SC, Severson HH. Elementary school age children’s future intentions and use of substances. Journal of Clinical Child and Adolescent Psychology. 2003;32(4):556–567. doi: 10.1207/S15374424JCCP3204_8. [DOI] [PMC free article] [PubMed] [Google Scholar]
- Andrews JA, Severson HS, Tildesley E, Hampson S. Normative social images of smokers: perceptions of what friends think matters. Paper presented at the Society for Research In Nicotine and Tobacco; Scottsdale, Arizona. 2004. Feb, [Google Scholar]
- Berndt TJ. The features and effects of friendship in early adolescence. Child Development. 1982;53(6):1447–1460. [Google Scholar]
- Blinn-Pike LM, Tittsworth S, Bell T, Von Bargen J, Devereaux M, Doyle H. Assessing what high risk young children know about drugs: verbal versus pictorial methods. Journal of Drug Education. 1993;23:151–169. doi: 10.2190/4WTP-1GNU-DF90-QUNM. [DOI] [PubMed] [Google Scholar]
- Choi WS, Gilpin EA, Farkas AJ, Pierce JP. Determining the probability of future smoking among adolescents. Addiction. 2001;96(2):313–323. doi: 10.1046/j.1360-0443.2001.96231315.x. [DOI] [PubMed] [Google Scholar]
- Davies J, Stacey B. Teenagers and alcohol: a developmental study in Glasgow. Vol. 2. Her Majesty’s Stationery Office (HMSO); London: 1972. [Google Scholar]
- Derzon JH, Lipsey MW. What good predictors of marijuana use are good for: a synthesis of research. School Psychology International. 1999;20(1):69–85. [Google Scholar]
- Dinh KT, Sarason IG, Peterson AV, Onstad LE. Children’s perceptions of smokers and nonsmokers: a longitudinal study. Health Psychology. 1995;14(1):32–30. doi: 10.1037//0278-6133.14.1.32. [DOI] [PubMed] [Google Scholar]
- Edwards A. On Guttman’s scale analysis. Educational and Psychological Measurement. 1948;8:313–318. [Google Scholar]
- Ellickson PL, Hays RD, Bell RM. Stepping through the drug use sequence: Longitudinal scalogram analysis of initiation and regular use. Journal of Abnormal Psychology. 1992;101(3):441–451. doi: 10.1037//0021-843x.101.3.441. [DOI] [PubMed] [Google Scholar]
- Ellickson PL, Tucker JS, Klein DJ, McGuigan KA. Prospective risk factors for alcohol misuse in late adolescence. Journal of Studies on Alcohol. 2001;62(6):773–782. doi: 10.15288/jsa.2001.62.773. [DOI] [PubMed] [Google Scholar]
- Fossey E. Young children and alcohol: a theory of attitude development. Alcohol and Alcoholism. 1993;28:485–498. [PubMed] [Google Scholar]
- Gibbons FX, Gerrard M. Predicting young adults’ health-risk behavior. Journal of Personality and Social Psychology. 1995;69:505–517. doi: 10.1037//0022-3514.69.3.505. [DOI] [PubMed] [Google Scholar]
- Gibbons FX, Gerrard M. Health images and their effects on health behavior. In: Buunk BP, Gibbons FX, editors. Health, coping, and well-being: Perspectives from social comparison theory. Erlbaum; Mahwah, NJ: 1997. pp. 63–94. [Google Scholar]
- Gibbons FX, Gerrard M, Lane LS, Wills TA, Brody G, Conger RD. Context and cognitions: environmental risk, social influence and adolescent substance use. Personality and Social Psychology Bulletin. 2004;30(8):1048–1061. doi: 10.1177/0146167204264788. [DOI] [PubMed] [Google Scholar]
- Goodenough WJ. A technique for scale analysis. Educational and Psychological Measurements. 1944;4:179–190. [Google Scholar]
- Grady K, Gersick KE, Snow DL, Kessen M. The emergence of adolescent substance use. Journal of Drug Education. 1986;16:203–220. doi: 10.2190/ELAR-N5PW-BH6A-VD39. [DOI] [PubMed] [Google Scholar]
- Handsen WB, Graham JW. Preventing alcohol, marijuana and cigarette use among adolescents: Peer pressure resistance training vs. establishing conservative norms. Preventive Medicine. 1991;20:414–430. doi: 10.1016/0091-7435(91)90039-7. [DOI] [PubMed] [Google Scholar]
- Higgins A, Conner M. Understanding adolescent smoking: The role of the Theory of Planned Behavior and implementation intentions. Psychology, Health and Medicine. 2003;8(2):173–186. [Google Scholar]
- Jahoda G, Cramond J. Children and alcohol: a developmental study in Glasgow. Vol. 1. HMSO; London: 1972. [PubMed] [Google Scholar]
- Johnson EO, Arria AM, Borges G, Ialongo N, Anthony JC. The growth of conduct problem behaviors from middle childhood to early adolescence: sex differences and the suspected influence of early alcohol use. Journal of Studies on Alcohol. 1995;56:661–671. doi: 10.15288/jsa.1995.56.661. [DOI] [PubMed] [Google Scholar]
- Maher RA, Rickwood D. The theory of planned behavior, domain specific self-efficacy and adolescent smoking. Journal of Child and Adolescent Substance Abuse. 1997;6(3):57–76. [Google Scholar]
- Marcoux BC, Shope JT. Application of the theory of planned behavior to adolescent use and misuse of alcohol. Health Education Research. 1997;12(3):323–331. [Google Scholar]
- Menzel H. A new coefficient for scalogram analysis. Public Opinion Quarterly. 1953;17:268–280. [Google Scholar]
- McMillan B, Higgins AR, Conner M. Using an extended theory of planned behavior to understand smoking amongst schoolchildren. Addiction Research and Theory. 2005;13(3):293–306. [Google Scholar]
- Morrison DM, Golder S, Keller TE, Gilmore MR. The theory of reasoned action as a model of marijuana use: tests of implicit assumptions and applicability to high-risk young women. Psychology of Addictive Behaviors. 2002;16(3):212–224. [PubMed] [Google Scholar]
- Olson JM, Zanna MP. Attitudes and attitude change. Annual Review of Psychology. 1993;44:117–154. [Google Scholar]
- Piko B. Smoking in adolescence: Do attitudes matter? Addictive Behaviors. 2001;26:201–217. doi: 10.1016/s0306-4603(00)00101-5. [DOI] [PubMed] [Google Scholar]
- Pisano S, Rooney JF. Children’s changing attitudes regarding alcohol: a cross-sectional study. Journal of Drug Education. 1988;18(1):1–11. doi: 10.2190/FJ5Y-AG81-2KVD-9WRD. [DOI] [PubMed] [Google Scholar]
- Schaie KW. A general model for the study of developmental change. Psychological Bulletin. 1965;64:92–107. doi: 10.1037/h0022371. [DOI] [PubMed] [Google Scholar]
- Schaie KW. A general model for the study of developmental problems. In: Goulet LR, Baltes PB, editors. Life -Span developmental psychology: Research and theory. Academic Press; San Diego: 1970. pp. 485–507. [Google Scholar]
- Spiegler DL. Children’s attitudes toward alcohol. Journal of Studies on Alcohol. 1983;44:545–552. doi: 10.15288/jsa.1983.44.545. [DOI] [PubMed] [Google Scholar]
- Spijkerman R, van den Eijnden RJ, Vitale S, Engles RC. Explaining adolescents’ smoking and drinking behavior: the concept of smoker and drinker prototypes in relation to variables of the theory of planned behavior. Addictive Behaviors. 2004;29(8):1615–1622. doi: 10.1016/j.addbeh.2004.02.030. [DOI] [PubMed] [Google Scholar]
- Stacy AW, Bentler PM, Flay BR. Attitudes and health behavior in diverse populations: drunk driving, alcohol use, binge eating, marijuana use and cigarette use. Health Psychology. 1994;13:73–85. doi: 10.1037//0278-6133.13.1.73. [DOI] [PubMed] [Google Scholar]
- Sussman S, Dent CW, Burton D, Stacy AW, Flay BR. Developing school based tobacco and cessation programs. Thousand Oaks, CA; Sage Publications: 1995. [Google Scholar]
- Wakefield M, Kloska DD, O’Malley PM, Johnston LD, Chaloupka F, Pierce J, Giovino G, Ruel E, Flay BR. The role of smoking intentions in predicting future smoking among youth: findings from Monitoring the Future data. Addiction. 2004;99(7):914–922. doi: 10.1111/j.1360-0443.2004.00742.x. [DOI] [PubMed] [Google Scholar]
- Webb JA, Baer PE, Getz JG, McKelvey RS. Do fifth graders’ attitudes and intentions toward alcohol use predict seventh grade use? Journal of the American Academy of Child and Adolescent Psychiatry. 1996;35:1611–1617. doi: 10.1097/00004583-199612000-00012. [DOI] [PubMed] [Google Scholar]