

Abstract
Immune activation is a hallmark of human immunodeficiency virus type 1 (HIV-1) infection and impacts innate and adaptive immunity. Individuals coinfected with HIV-1 and hepatitis C virus (HCV) may have increased immune activation early in HIV disease because of a high HCV antigen load in tissues such as the liver. We evaluated T cell markers of activation and maturation in women with or without HIV-1 infection, by HCV antibody and HCV RNA status. We found increased percentages of activated CD8+ T cells (i.e., CD8+HLA-DR+38+ cells and CD8+CD28+HLA-DR+ cells) but not of CD4+ T cells among women who tested positive for HIV-1, HCV antibody, and HCV RNA, compared with HIV-1–positive women who tested negative for HCV antibody. Because CD8+T cell activation is related to HIV-1 disease progression, these data may have implications for the medical management of patients coinfected with HIV-1 and HCV.
Individuals with human immunodeficiency virus type 1 (HIV-1) infection are frequently coinfected with hepatitis C virus (HCV), another persistent viral infection in which the immune system ineffectively controls viral replication. Patients coinfected with HIV-1 and HCV have increased morbidity and mortality, even in the era of highly active antiretroviral therapy (HAART) [1–4]. Although most studies to date suggest that HIV-1 infection accelerates HCV-related liver complications, the impact of HCV infection on HIV-1 disease is less clear: some studies demonstrated increased risks of acquired immunodeficiency syndrome (AIDS) and AIDS-related death among coinfected patients, whereas others found no difference in the risk of disease progression [1–5]. Recently, there has been interest in better defining the immunopathogenesis of HIV-1/HCV coinfection. We undertook this study to assess whether T cell markers of activation and maturation are related to HIV-1 and HCV infection. Our central hypothesis was that individuals coinfected with HIV-1 and HCV—2 persistent viruses—would have increased immune activation and alteration in T cell maturation early during HIV disease because of a high HCV antigen load in liver and extrahepatic tissues and high HIV-1 and HCV antigen loads in blood.
Participants, materials, and methods
This is a substudy of the Women’s Interagency HIV Study (WIHS), a multicenter, prospective study of the natural history of HIV-1 infection and associated diseases in US women. During a single visit at 2 WIHS sites (one in Los Angeles and another in Chicago), we evaluated 169 women with and 51 women without HIV-1 infection.
We determined plasma HIV-1 RNA levels by means of the isothermal nucleic acid sequence– based amplification method (bioMérieux) in laboratories that participate in and are certified by the National Institute of Allergy and Infectious Diseases Virology Quality Assurance certification program.
At baseline, we determined HCV serostatus by means of the Abbott EIA 2.0 and 3.0 and HCV RNA level by means of the COBAS Amplicor Monitor 2.0 (detection range, 600 –500,000 IU/mL [Roche Diagnostics]) or the COBAS TaqMan (detection range, 10 –2 × 10⁸ IU/mL [Roche Diagnostics]); qualitative PCR (Amplicor 2.0; lower limit of detection, 50 IU/mL) was performed if HCV RNA was not detected, as previously reported [6].
To determine real-time levels of CD4+ and CD8+ T cell subsets, fresh whole blood specimens were collected in EDTA tubes and subjected to 3-color flow cytometry (FACSCalibur [Becton Dickinson]) [7], in accordance with AIDS Clinical Trials Group consensus protocol. The analysis used fluorochrome-conjugated antibodies (anti-CD3, anti-CD4, anti-CD8, anti-CD19, anti–HLA-DR, anti-CD38, anti-RA, anti-62L, anti-CD28, anti-CD16, and anti-CD56 [Becton Dickinson]) and antibody combinations (anti–HLA-DR/anti-CD38 to measure T cell activation, anti-CD45RA/anti-CD62L to measure the levels of memory and naive cells for CD4+ and CD8+subsets, and anti-CD8/anti-CD28 to measure T cell maturation, with HLA-DR as a marker of activation).
χ2 tests were used for comparison of proportions, and Kruskal-Wallis tests for comparison of median values of demographic, clinical, and immunological characteristics. Analyses of covariance, stratified by HIV-1 infection status, were used to investigate the effect of HCV status (HCV antibody positive [HCV+] and HCV RNA positive [RNA+], HCV+and HCV RNA negative [RNA−], and HCV antibody negative [HCV−]) on the number and percentage of T cell subsets. Analyses were adjusted for age (<30, 30 –39, or ⩾40 years), race (black, white non-Hispanic, Hispanic, or other), injection drug use (yes or no), and HIV-1 treatment (any antiretroviral therapy or no antiretroviral therapy). Because of the nonnormal distribution of immunological markers, analyses of covariance used ranked data. Additional analyses of covariance also adjusted for CD4+ T cell count (<200, 200 –500, or >500 cells/mm3) and HIV-1 RNA level (not tested, <4000, 4000 –50,000, or >50,000 copies/mL) separately and together. Spearman rank correlation tests were used to evaluate relationships between the percentage of activated CD8+ T cells and the HIV-1 RNA load among HIV-1–positive [HIV+] women, by HCV status, and between the percentage of activated CD8+ T cells and the HCV RNA load among HCV+ women, by HIV-1 infection status. A 2-tailed P value of <.05 was considered to be statistically significant. SAS statistical software, version 9 (SAS Institute), was used to conduct these analyses.
Results
Of the 220 women enrolled in this study, 52 were HIV+HCV+RNA+, 16 were HIV+HCV+RNA−, 101 were HIV+HCV−, 11 were HIV-1 negative (HIV−) and HCV+RNA+, 4 were HIV−HCV+RNA−, and 34 were HIV−HCV−; 2 HIV− women were excluded because of indeterminate results of HCV RNA tests. The majority of women were black (48.6%) or Hispanic (30.7%) and 30 –39 years of age (49.1%) (table 1). More than 83% of women who were HIV+HCV+RNA+ or HIV+HCV+RNA− reported a history of injection drug use.
Table 1.
Demographic, clinical, and immunological characteristics of 218 women, by human immunodeficiency virus type 1 (HIV-1) infection status, hepatitis C virus (HCV) antibody status, and HCV RNA status.
| HIV+ |
HIV− |
|||||||
|---|---|---|---|---|---|---|---|---|
| Variable | HCV+RNA+ (n = 52) | HCV+RNA− (n = 16) | HCV− (n = 101) | Pa | HCV+RNA+ (n = 11) | HCV+RNA− (n = 4) | HCV− (n = 34) | Pa |
| Age, years | ||||||||
| <30 | 3 (5.8) | 0 | 25 (24.8) | .005 | 2 (18.2) | 0 | 11 (32.4) | .36 |
| 30–39 | 25 (48.1) | 8 (50.0) | 48 (47.5) | 8 (72.7) | 3 (75.0) | 15 (44.1) | ||
| ⩾40 | 24 (46.1) | 8 (50.0) | 28 (27.7) | 1 (9.1) | 1 (25.0) | 8 (23.5) | ||
| Race | ||||||||
| Black | 28 (53.9) | 9 (56.2) | 49 (48.5) | .21 | 5 (45.4) | 1 (25.0) | 14 (41.2) | .74 |
| White, non-Hispanic | 14 (26.9) | 3 (18.8) | 14 (13.9) | 1 (9.1) | 2 (50.0) | 8 (23.5) | ||
| Hispanic | 9 (17.3) | 4 (25.0) | 37 (36.6) | 5 (45.5) | 1 (25.0) | 11 (32.4) | ||
| Other | 1 (1.9) | 0 | 1 (1.0) | 0 | 0 | 1 (2.9) | ||
| Injection drug useb | ||||||||
| No | 10 (19.2) | 1 (6.2) | 99 (98.0) | <.0001 | 0 | 0 | 30 (88.2) | 3.0001 |
| Yes | 42 (80.8) | 15 (93.8) | 2 (2.0) | 11 (100.0) | 4 (100.0) | 4 (11.8) | ||
| Plasma HIV-1 RNA load, copies/mL | ||||||||
| Not tested | 6 (11.6) | 0 | 14 (13.8) | .78 | … | … | … | |
| <4000 | 26 (50.0) | 9 (56.2) | 44 (43.6) | … | … | … | ||
| 4000–50,000 | 10 (19.2) | 4 (25.0) | 21 (20.8) | … | … | … | ||
| >50,000 | 10 (19.2) | 3 (18.8) | 22 (21.8) | … | … | … | ||
| Median (range), log10 | ≤2.60 (≤2.60 to 6.11) | 3.04 (≤2.60 to 5.20) | 3.51 (≤2.60 to 5.88) | .56 | … | … | … | |
| Treatmentc | ||||||||
| None | 22 (42.3) | 7 (43.7) | 40 (39.6) | .53 | … | … | … | |
| Monotherapy | 10 (19.2) | 3 (18.8) | 13 (12.9) | … | … | … | ||
| Combination therapy | 19 (36.6) | 4 (25.0) | 38 (37.6) | … | … | … | ||
| HAART | 1 (1.9) | 2 (12.5) | 10 (9.9) | … | … | … | ||
| Plasma HCV RNA load, IU/mL | ||||||||
| ≤10 | 0 | 16 (100.0) | …. | 0 | 4 (100.0) | … | ||
| >10–2,000,000 | 26 (50.0) | 0 | … | 8 (72.7) | 0 | … | ||
| >2,000,000 | 26 (50.0) | 0 | … | 3 (27.3) | 0 | … | ||
| Median (range), log10 | 6.30 (2.45–7.58) | ≤1 | … | 5.49 (3.37–6.56) | ≤1 | … | ||
| CD4+ T cell count, cells/mm3 | ||||||||
| <200 | 8 (15.4) | 3 (18.7) | 26 (25.7) | .33 | 0 | 0 | 0 | .003 |
| 200–500 | 22 (42.3) | 9 (56.3) | 35 (34.7) | 0 | 1 (25.0) | 0 | ||
| >500 | 22 (42.3) | 4 (25.0) | 40 (39.6) | 11 (100.0) | 3 (75.0) | 34 (100.0) | ||
| Median (range), no. | 458 (7–1256) | 354 (18–1380) | 422 (5–1346) | .44 | 1146 (631–1344) | 1429 (412–1498) | 1240 (570–3122) | .36 |
| Median (range), % | 25.5 (0.9–49.0) | 18.0 (3.9–29.0) | 22.0 (0.9–49.0) | .05 | 42.0 (30.0–53.0) | 44.0 (30.0–48.0) | 47.0 (34.0–62.0) | .22 |
NOTE. Data are no. (%) of women, unless otherwise indicated. Two of 220 women originally enrolled were excluded from the analysis because of indeterminate results of HCV RNA tests. HAART, highly active antiretroviral therapy; HCV+, HCV antibody positive; HCV−, HCV antibody negative; HIV+, HIV-1 positive; HIV−, HIV-1 negative; RNA+, HCV RNA positive; RNA−, HCV RNA negative.
By χ2 tests (for comparison of proportions) or Kruskal-Wallis tests (for comparison of median values).
Defined as a history of injection drug use at baseline or use of injection drugs since the most recent Women’s Interagency HIV Study visit.
Used since the most recent Women’s Interagency HIV Study visit.
The course of HIV-1 disease in the majority of HIV+ women was early: only 21.9% had a CD4+ T cell count of <200 cells/mm3, and 20.7% had a plasma HIV-1 RNA load of >50,000 copies/mL. Almost 40% had a CD4+ T cell count of >500 cells/mm3, and nearly 50% had an HIV-1 RNA level of <4000 copies/mL. Only 7.7% were receiving HAART, because HAART was not universally available at the time of the study. Of the HIV+HCV+ women, 76.5% were RNA+ at baseline (median HCV RNA load, 1,985,000 IU/mL), and none were receiving HCV therapy.
HIV+HCV+RNA+ women had a significantly increased percentage of activated CD8+HLA-DR+38+ T cells, compared with HIV+HCV− women, after adjustment for age, race, injection drug use, and HIV-1 treatment (mean percentages, 30.7% for HIV+HCV+RNA+ women, 26.4% for HIV+HCV+RNA− women, and 13.8% for HIV+HCV+ women; HCV+RNA+ effect, 16.9%; P = .008) (table 2). Furthermore, we found that HIV+HCV+RNA+ women had a marginally higher number of activated CD8+ T cells, compared with HIV+HCV− women (mean counts, 326 cells/mm3 for HIV+HCV+RNA− women, 264 cells/mm3 for HIV+HCV+RNA− women, and 167 cells/mm3 for HIV+HCV− women; HCV+RNA− effect, 159 cells/mm3; P = .07). These findings remained constant after separate adjustments for HIV-1 RNA load only, CD4+ T cell count only, and HIV-1 RNA load plus CD4+ T cell count. In separate analyses of HIV+ women, the increased percentage of activated CD8+ T cells for HIV+HCV+RNA+ women was similar to that for HIV+HCV− women, regardless of treatment status. However, because of sample size, differences were not statistically significant among untreated women (mean percentages, 24.1% for HIV+HCV+RNA+ women, 23.7% for HIV+HCV+RNA+ women, and 9.0% for HIV+HCV− women; HIV+HCV+RNA+ effect, 15.1%; P = .22) but were statistically significant among treated women (mean percentages, 40.3% for HIV+HCV+RNA+ women, 31.0% for HIV+HCV+RNA− women, and 18.4% for HIV+HCV− women; HCV+RNA+effect, 21.9%; P = .005). There were no differences in the percentage or number of activated CD4+ T cells between the study groups.
Table 2.
Findings of analyses of covariance to investigate the effect of hepatitis C virus (HCV) antibody status and HCV RNA status on the number and percentage of T cell subsets in 218 women, by human immunodeficiency virus type 1 (HIV-1) infection status.
| HIV+ |
HIV− |
|||||||||||||
|---|---|---|---|---|---|---|---|---|---|---|---|---|---|---|
| Variable | HCV+RNA+ | HCV+RNA− | HCV− | HCV+RNA+ effect | Pa | HCV+RNA− effect | Pa | HCV+RNA+ | HCV+RNA− | HCV− | HCV+RNA+ effect | Pa | HCV+RNA− effect | Pa |
| Activation markers | ||||||||||||||
| No. of subjects | 52 | 16 | 101 | … | … | 11 | 4 | 34 | … | … | ||||
| CD4+HLA-DR+38+ cells | ||||||||||||||
| Count, cells/mm3 | 56 ± 13 | 33 ± 19 | 44 ± 13 | 12 ± 16 | .68 | −11 ± 21 | .27 | 23 ± 24 | 10 ± 31 | 45 ± 19 | −22 ± 31 | .26 | −35 ± 37 | .18 |
| Percentage | 16.1 ± 4.1 | 14.3 ± 5.8 | 9.7 ± 4.2 | 6.4 ± 5.0 | .23 | 4.5 ± 6.6 | .58 | 2.3 ± 1.5 | 1.0 ± 1.9 | 3.3 ± 1.1 | −1.0 ± 1.9 | .41 | −2.3 ± 2.2 | .19 |
| CD8+HLA-DR+38+ cells | ||||||||||||||
| Count, cells/mm3 | 326 ± 70 | 264 ± 99 | 167 ± 71 | 159 ± 86 | .07 | 97 ± 112 | .28 | 24 ± 30 | 2 ± 38 | 27 ± 23 | −3 ± 38 | .59 | −25 ± 45 | .24 |
| Percentage | 30.7 ± 4.1 | 26.4 ± 6.8 | 13.8 ± 4.9 | 16.9 ± 5.9 | .008 | 12.6 ± 7.7 | .17 | 2.6 ± 2.9 | −0.6 ± 3.7 | 4.4 ± 2.3 | −1.8 ± 3.7 | .28 | −5.1 ± 4.4 | .05 |
| CD8+CD28+ markers on subset | ||||||||||||||
| No. of subjects | 35 | 10 | 34 | … | … | 5 | 1 | 14 | … | … | ||||
| CD8+CD28+ cells | ||||||||||||||
| Count, cells/mm3 | 407 ± 57 | 333 ± 88 | 440 ± 70 | −33 ± 91 | .69 | −107 ± 113 | .36 | 561 ± 132 | 770 ± 229 | 471 ± 85 | 90 ± 179 | .33 | 299 ± 251 | .14 |
| Percentage | 39.3 ± 4.4 | 27.3 ± 6.8 | 43.8 ± 5.4 | −4.5 ± 7.1 | .60 | −16.5 ± 8.8 | .07 | 77.1 ± 12.8 | 82.2 ± 22.1 | 67.9 ± 8.2 | 9.2 ± 17.3 | .67 | 14.3 ± 24.3 | .64 |
| CD8+CD28+HLA-DR+ cells | ||||||||||||||
| Count, cells/mm3 | 201 ± 38 | 158 ± 59 | 140 ± 47 | 62 ± 61 | .11 | 18 ± 76 | .32 | 59 ± 40 | 114 ± 69 | 57 ± 25 | 2 ± 54 | .83 | 57 ± 75 | .38 |
| Percentage | 19.0 ± 2.1 | 15.1 ± 3.3 | 12.8 ± 2.6 | 6.2 ± 3.4 | .01 | 2.3 ± 4.3 | .14 | 7.0 ± 3.6 | 11.3 ± 6.3 | 7.6 ± 2.3 | −0.6 ± 4.9 | .89 | 3.6 ± 6.9 | .59 |
| CD8+CD28+HLA-DR+ cells | ||||||||||||||
| Count, cells/mm3 | 206 ± 34 | 175 ± 52 | 300 ± 42 | −94 ± 54 | .08 | −125 ± 67 | .06 | 502 ± 109 | 655 ± 190 | 414 ± 70 | 88 ± 148 | .31 | 242 ± 208 | .16 |
| Percentage | 20.3 ± 3.8 | 12.3 ± 59 | 31.0 ± 4.7 | −10.7 ± 6.1 | .18 | −18.8 ± 7.6 | .03 | 70.1 ± 13.0 | 71.0 ± 22.5 | 60.3 ± 8.3 | 9.8 ± 17.6 | .60 | 10.6 ± 24.7 | .64 |
NOTE. Data are adjusted mean values ± SE. Two of 220 women originally enrolled were excluded from the analysis because of indeterminate results of HCV RNA tests. HCV+, HCV antibody positive; HCV−, HCV antibody negative; HIV+, HIV-1 positive; HIV−, HIV-1 negative; RNA+, HCV RNA positive; RNA−, HCV RNA negative.
Estimated on the basis of analyses of covariance that used ranked data, with adjustment for age group (<30, 30–39, or ⩾40 years), race (black, white non-Hispanic, Hispanic, or other), injection drug use (yes or no), and HIV-1 treatment (any antiretroviral therapy or no antiretroviral therapy)
The percentages of CD8+HLA-DR+38+ T cells in relation to HIV-1 RNA load and HCV RNA load are presented in figure 1. Spearman rank correlation tests demonstrated correlations of borderline significance between HIV-1 RNA level and immune activation among HIV+HCV+RNA+ women (Spearman rank-correlation coefficient [hereafter, “Spearman coefficient”], 0.26; P = .08) and HIV+HCV+RNA− women (Spearman coefficient, 0.47; P = .06) but not among HIV+HCV− women (Spearman coefficient, 0.13; P = .23) (figure 1). Among the HIV+HCV+ women, there was no correlation between HCV RNA level and percentage of activated CD8+ T cells (Spearman coefficient, 0.13; P = .29); however, among HIV−HCV+ women, the correlation between these values was statistically significant (Spearman co-efficient, 0.57; P = .03) (figure 1). We also evaluated the number and percentage of naive and memory CD4+T cells and CD8+ T cells with respect to HIV-1 infection status, HCV antibody status, and HCV RNA status but found no significant differences between HIV+HCV+RNA+ women, HIV+HCV+RNA− women, and HIV+HCV− women or between HIV−HCV+RNA+ women, HIV−HCV+RNA− women, and HIV−HCV− women, after adjustment for age, race, injection drug use, and HIV-1 treatment (data not shown).
Figure 1.
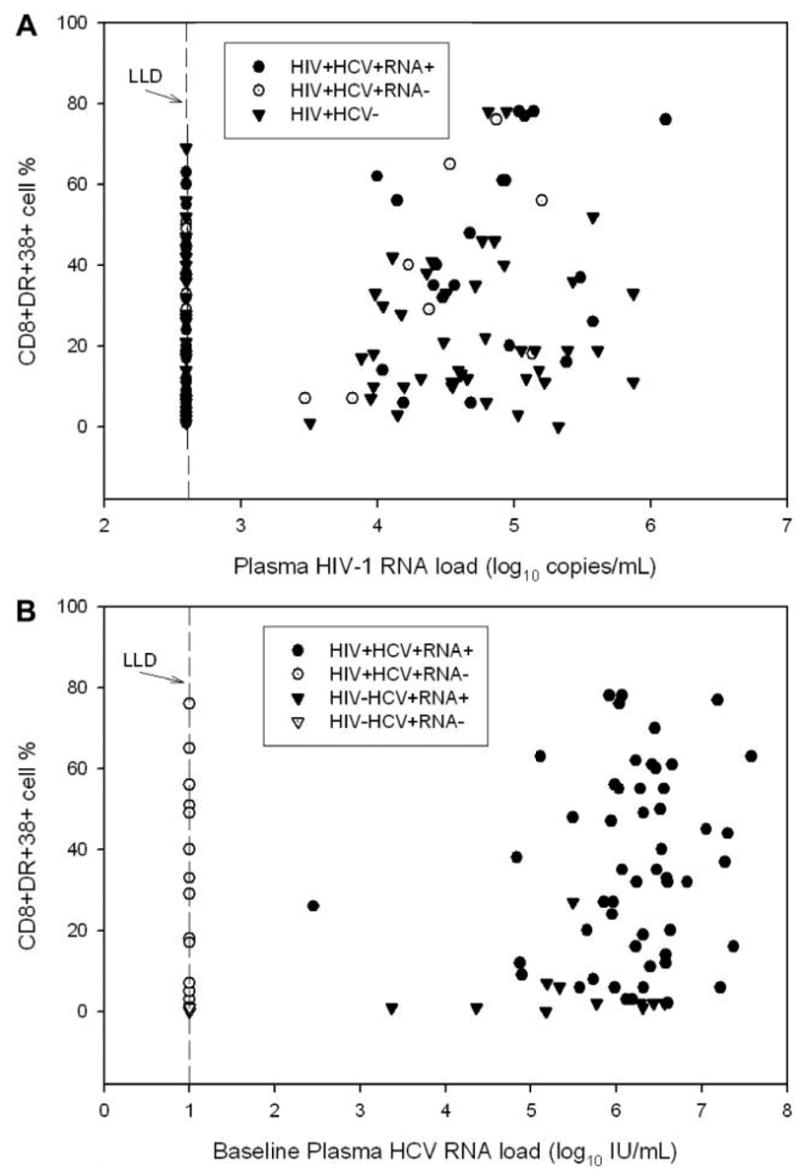
A, Relationship between the plasma human immunodeficiency virus type 1 (HIV-1) load and the percentage of CD8+DR+38+ cells, by hepatitis C virus (HCV) antibody and HCV RNA statuses, among women with HIV-1 infection (HIV+). Lower limit of detection (LLD), ≤2.60 log10 copies/mL (≤4000 copies/mL). B, Relationship between the baseline plasma HCV RNA load and the percentage of CD8+DR+38+ cells, by HIV-1 infection status, among HCV antibody–positive [HCV+] women. LLD, ≤1 log10 IU/mL (≤10 IU/mL). HCV−, HCV antibody negative; HIV−, HIV negative; RNA+, HCV RNA positive; RNA−, HCV RNA negative.
A subset of women was further evaluated for the expression of CD28, an important costimulatory receptor needed for activation, and the presence of HLA-DR, which is a marker of activation, on CD8+ T cells (table 1). As reported earlier, in this study the count and percentage of CD8+CD28+ T cells in HIV+ women were less than those in HIV− women. Furthermore, we found that HIV+HCV+RNA+ women had a significantly higher percentage of CD8+CD28+HLA-DR+ T cells, compared with HIV+HCV− women, after adjustment for age, race, injection drug use, and HIV-1 treatment (mean percentages, 19% for HIV+HCV+RNA+women, 15.1% for HIV+HCV+RNA− women, and 12.8% for HIV+HCV− negative women; HCV+RNA+ effect, 6.2%; P = .01).
Discussion
Our study demonstrates that the level of CD8+ T cell activation is higher in HIV+HCV+ women than in HIV+HCV− women early during the course of HIV-1 disease and before HAART initiation. This was not the case for CD4+T cell activation, which was not further impacted by HCV infection. Furthermore, the level of CD8+ T cell activation was significantly higher among HIV+HCV+ viremic women than among HIV+HCV− women, although HIV+HCV+ nonviremic women also had higher activation levels. Finally, coinfected women also had an increased percentage of activated immature memory CD8+ T cells. Because activation of CD8+ T cells is related to T cell maturation and ultimately to HIV-1 disease progression, these data may have implications for the medical management of coinfected patients.
CD8+T cell immune responses are essential for the control of viral infection. Early after HIV-1 infection, there is a significant expansion of the CD8+ T cell population. Activation of T cells occurs following antigen presentation, and the level of activation is related to the antigen load [9 –11]. However, in chronic viral infections such as those due to HIV-1 and HCV, lack of clearance of HIV-1 and/or HCV results in continued activation of T cells and a chronic state of immune activation, ultimately resulting in T cell “exhaustion” characterized by anergy and senescence. Late in the course of HIV-1 disease, there is a decrease in the CD8+ T cell population. This is most likely due to apoptosis of cells that coexpress CD8 and CD38, as such cells have been shown to be more susceptible to apoptosis when there is ongoing viral replication. The combination of HIV-1 and HCV infection may further accelerate this process, because both viruses can increase the rate of apoptosis [9 –11].
Our study also assessed for CD8+ T cells that coexpress CD28, an important costimulatory molecule that is necessary for functional responses and is expressed on naive T cells and early memory T cells. CD28 ligation with T cell receptor is essential for activation and expansion of CD8+ T cells [9 –12]. Cells that express CD28 are considered to be early differentiation T cells, whereas those that are CD28− are late-differentiation memory cells. Recent studies have shown that viruses have the ability to impact maturation of CD8+ T cells as a mechanism for immune evasion. In the case of HIV-1, there is a noted increase in HIV-1–specific CD8+ T cells of the intermediate memory phenotype (i.e., CD8+CD28−CD27+). On the other hand, HCV-specific CD8+ T cells have an earlier memory phenotype (i.e., CD28+CD27+), whereas CMV-specific T cells have a late effector phenotype (i.e., CD27−28−) [9]. Our current study confirms previously reported findings that HIV+ persons have fewer CD8+CD28+ T cells than do HIV− persons, whereas HCV+ persons have more CD8+CD28+ T cells than do HCV− persons [8, 12, 13]. Additionally, we found that HIV+HCV+RNA+ women have increased CD8+28+HLA-DR+ T cells. We previously published the finding that coinfected women have increased primed activated T cells (i.e., CD8+CD45RO+CD27+95+), compared with HIV+HCV− women [6], and postulated that this population of cells represented effector/central memory T cells. The population of activated CD8+28+cells in our current study may also represent early central memory T cells and further suggests that HCV may be playing a role in skewing CD8+ maturation toward an earlier phenotype [6, 9, 11–13].
In our previous study involving women who initiated HAART, we found no difference in percentages of activated CD4+ or CD8+ T lymphocytes between HIV+HCV+ and HIV+HCV− women, but we found decreased activation after HAART initiation. In our current study, HIV-1 disease in most women was at an early stage: almost 50% were untreated, with high CD4+ T cell counts and low HIV-1 RNA levels, and only 7.7% were receiving HAART. Immune activation was marginally correlated with HIV-1 RNA level but not correlated with HCV RNA level among coinfected patients. Even after adjustment for HIV-1 RNA level, we found a marked increase in the percentage of CD8+HLA-DR+38+ and CD8+28+HLA-DR+ T cells in HIV+HCV+ women. This is in agreement with a previous report that found increased activation in coinfected patients after HAART initiation [14], but the present study involved a much larger number of patients and was limited to women. Furthermore, although treated women overall had greater levels of immune activation, most likely because treatment was selective, HIV+HCV+ viremic treated women still had a significantly greater percentage of activated CD8+ T cells. RNA− women also had a greater percentage of activated CD8+T cells. Activation of T cells may be occurring in the liver or at extrahepatic sites in some of these women, as previously reported by us [15]. Although our study was large, one limitation is that we did not adjust for multiple comparisons; therefore, some of the significant findings might be due to chance.
In conclusion, our study suggests a potential mechanism for the observed increase in disease progression and immune dysregulation noted in some studies of patients coinfected with HIV-1 and HCV. Global activation of CD8+ T cells in the liver may result in CD8+ dysfunction, including cytokine production. This in turn would lead to a defective response to invading pathogens, a decrease in T cells, and, ultimately, the development of opportunistic infections.
Acknowledgments
Data were collected by the Women’s Interagency HIV Study collaborative study group at the following centers/locations: New York City/Bronx Consortium (principal investigator [PI], Kathryn Anastos); Brooklyn, New York (PI, Howard Minkoff); Washington, D.C., Metropolitan Consortium (PI, Mary Young); The Connie Wofsy Study Consortium of Northern California (PI, Ruth Greenblatt); Los Angeles County/Southern California Consortium (PI, Alexandra Levine); Chicago Consortium (PI, Mardge Cohen); and Data Coordinating Center (PI, Stephen Gange).
Financial support: National Institute of Allergy and Infectious Diseases (funding to the Women’s Interagency HIV-1 Study [WIHS] and grant RO1 AI052065 to A.K.), National Cancer Institute and National Institute on Drug Abuse (grants UO1-AI-35004, UO1-AI-31834, UO1-AI-34994, UO1-AI-34989, UO1-AI-34993, and UO1-AI-42590 to the WIHS), National Institute of Child Health and Human Development (grant UO1-CH-32632 to the WIHS), and National Center for Research Resources (grants MO1-RR-00071, MO1-RR-00079, and MO1-RR-00083 to the WIHS).
Footnotes
Potential conflicts of interest: none reported.
References
- 1.Anderson KB, Guest JL, Rimland D. Hepatitis C virus coinfection increases mortality in HIV-infected patients in the highly active antiretroviral therapy era: data from the HIV Atlanta VA Cohort Study. Clin Infect Dis. 2004;39:1507–13. doi: 10.1086/425360. [DOI] [PubMed] [Google Scholar]
- 2.Greub G, Ledergerber B, Battegay M, et al. Clinical progression, survival, and immune recovery during antiretroviral therapy in patients with HIV-1 and hepatitis C virus coinfection: the Swiss HIV Cohort Study. Lancet. 2000;356(9244):1800–5. doi: 10.1016/s0140-6736(00)03232-3. [DOI] [PubMed] [Google Scholar]
- 3.Rockstroh JK, Mocroft A, Soriano V, et al. Influence of hepatitis C virus infection on HIV-1 disease progression and response to highly active antiretroviral therapy. J Infect Dis. 2005;192:992–1002. doi: 10.1086/432762. [DOI] [PubMed] [Google Scholar]
- 4.Weis N, Lindhardt BO, Kronborg G, et al. Impact of hepatitis C virus coinfection on response to highly active antiretroviral therapy and outcome in HIV-infected individuals: a nationwide cohort study. Clin Infect Dis. 2006;42:1481–7. doi: 10.1086/503569. [DOI] [PubMed] [Google Scholar]
- 5.Sulkowski MS, Moore RD, Mehta SH, Chaisson RE, Thomas DL. Hepatitis C and progression of HIV disease. JAMA. 2002;288:199–206. doi: 10.1001/jama.288.2.199. [DOI] [PubMed] [Google Scholar]
- 6.al-Harthi L, Voris J, Du W, et al. Evaluating the impact of hepatitis C virus (HCV) on highly active antiretroviral therapy–mediated immune responses in HCV/HIV-coinfected women: role of HCV on expression of primed/memory T cells. J Infect Dis. 2006;193:1202–10. doi: 10.1086/500843. [DOI] [PMC free article] [PubMed] [Google Scholar]
- 7.Nicholson J, Kidd P, Mandy F, Livnat D, Kagan J. Three-color supplement to the NIAID DAIDS guideline for flow cytometric immunophenotyping. Cytometry. 1996;26:227–30. doi: 10.1002/(SICI)1097-0320(19960915)26:3<227::AID-CYTO8>3.0.CO;2-B. [DOI] [PubMed] [Google Scholar]
- 8.Landay A, Benning L, Bremer J, et al. Correlates of immune activation marker changes in human immunodeficiency virus (HIV)–seropositive and high-risk HIV-seronegative women who use illicit drugs. J Infect Dis. 2003;188:209–18. doi: 10.1086/376509. [DOI] [PMC free article] [PubMed] [Google Scholar]
- 9.Appay V, Dunbar PR, Callan M, et al. Memory CD8+ T cells vary in differentiation phenotype in different persistent virus infections. Nat Med. 2002;8:379–85. doi: 10.1038/nm0402-379. [DOI] [PubMed] [Google Scholar]
- 10.Papagno L, Spina CA, Marchant A, et al. Immune activation and CD8+ T-cell differentiation towards senescence in HIV-1 infection. PLoS Biol. 2004;2:E20. doi: 10.1371/journal.pbio.0020020. [DOI] [PMC free article] [PubMed] [Google Scholar]
- 11.van Lier RA, ten Berge IJ, Gamadia LE. Human CD8+ T-cell differentiation in response to viruses. Nat Rev Immunol. 2003;3:931–9. doi: 10.1038/nri1254. [DOI] [PubMed] [Google Scholar]
- 12.Yonkers NL, Rodriguez B, Post AB, et al. HIV coinfection impairs CD28-mediated costimulation of hepatitis C virus–specific CD8 cells. J Infect Dis. 2006;194:391– 400. doi: 10.1086/505582. [DOI] [PubMed] [Google Scholar]
- 13.Lucas M, Vargas-Cuero AL, Lauer GM, et al. Pervasive influence of hepatitis C virus on the phenotype of antiviral CD8+ T cells. J Immunol. 2004;172:1744–53. doi: 10.4049/jimmunol.172.3.1744. [DOI] [PubMed] [Google Scholar]
- 14.Hunt PW, Martin JN, Sinclair E, et al. T cell activation is associated with lower CD4+ T cell gains in human immunodeficiency virus–infected patients with sustained viral suppression during antiretroviral therapy. J Infect Dis. 2003;187:1534–43. doi: 10.1086/374786. [DOI] [PubMed] [Google Scholar]
- 15.Laskus T, Operskalski EA, Radkowski M, et al. Negative-strand hepatitis C virus (HCV) RNA in peripheral blood mononuclear cells from anti-HCV-positive/HIV-infected women. J Infect Dis. 2007;195:124–33. doi: 10.1086/509897. [DOI] [PMC free article] [PubMed] [Google Scholar]