

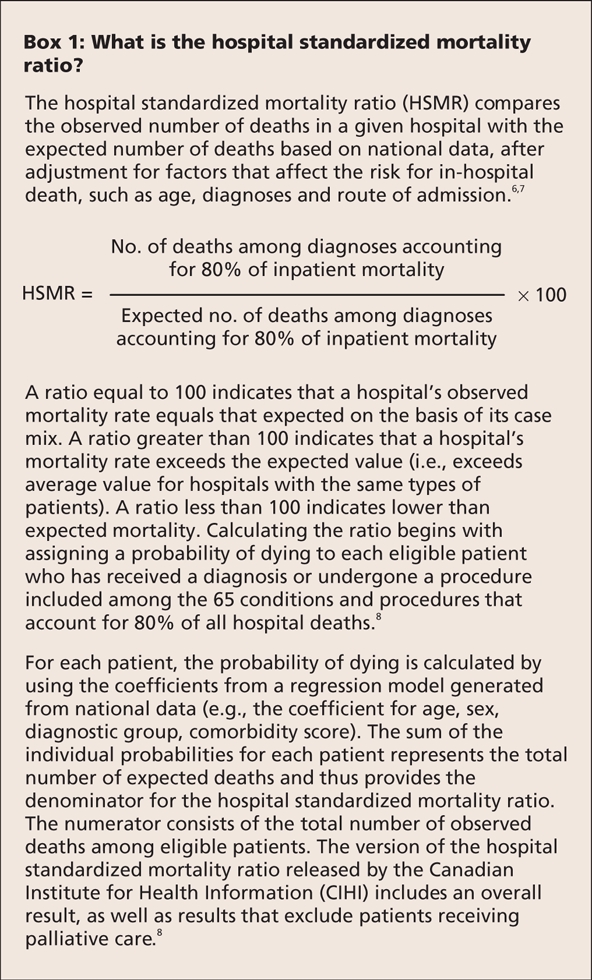
Mortality for specific conditions and procedures has figured prominently among outcomes-based performance measures.1–3 However, in recent years there has been renewed interest in overall hospital mortality, specifically the hospital standardized mortality ratio (HSMR) (Box 1).4–8 Although efforts to measure performance represent welcome developments, the focus on the hospital standardized mortality ratio, especially when the ratio is derived solely from administrative data, goes against the results of decades of investigation.9,10
Box 1.
Proposed strategies to measure and improve hospital performance efforts have included the establishment of national patient safety agencies,11 mandatory accreditation,12 financial incentives13 and publicly reported performance measures.14 Performance measures have targeted structure (e.g., patient volumes and recommended staffing patterns for intensive care15), process (e.g., report cards on adherence to recommended aspects of care for patients with acute myocardial infarction and pneumonia16) and outcomes.
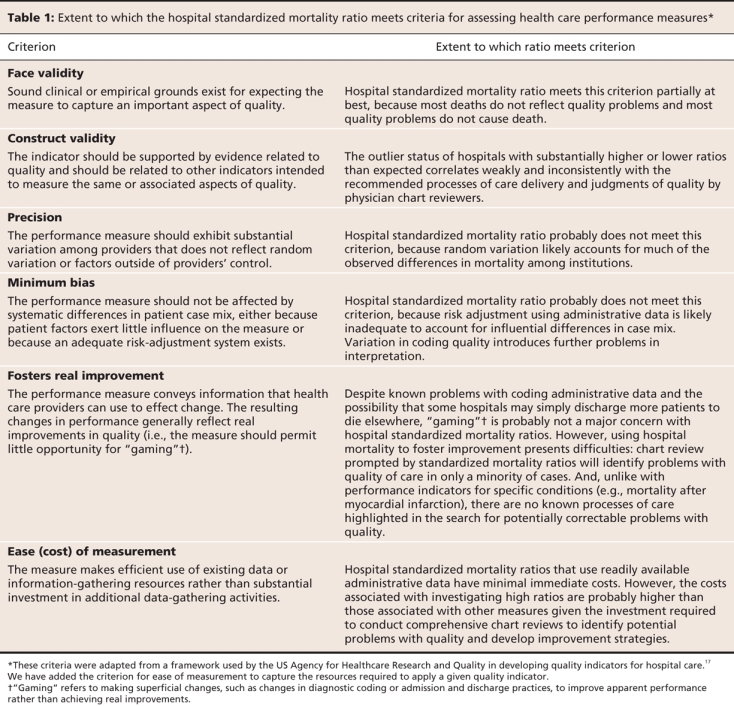
In this commentary, we apply a previously published framework by Davies and colleagues17 to analyze the limitations of the hospital standardized mortality ratio as a performance measure. Specifically, we address the validity, precision and potential bias associated with this measure as well as its cost and capacity to promote real improvement in performance (Table 1). We also briefly discuss alternative measures of hospital performance.
Table 1
Validity
For the hospital standardized mortality ratio to represent a valid performance measure, it must correlate with accepted measures of quality. However, the relation between hospital mortality and other measures of quality has been weak and inconsistent.9,10 One prominent study by Dubois and colleagues18 reviewed the charts of patients who died from stroke, myocardial infarction or pneumonia in hospitals with substantially higher or lower standardized mortality ratios than expected. High and low outlier hospitals did not differ in terms of adherence to 31 recommended processes of care for patients with these 3 conditions.
In this study, the reviewers of physician charts found no differences among hospitals in terms of the percentages of deaths from stroke or myocardial infarction that were potentially preventable. They did report a higher percentage of preventable deaths from pneumonia in hospitals with high mortality rates; however, agreement for these chart reviews was only 11% better than that expected on the basis of chance alone.18 More recent studies have confirmed that mortality is a poor predictor of preventable complications and quality problems.19,20
Precision
A precise measure of hospital performance will yield similar results when applied to hospitals that provide similar quality of care or when applied over time to a hospital where quality has remained constant. Publicly reported Canadian data6 show that, in most regions, hospitals experienced an overall decrease in standardized mortality ratios from 2004 to 2007. This decrease was beyond what would be reasonably expected from advances in science or changes in quality of care. In addition, a number of individual hospitals experienced substantial fluctuations from year to year that unlikely represented true cycles of improved or eroded quality.
Simulation studies have also evaluated the precision (and validity) of hospital mortality as a quality measure.10 Hofer and Hayward21 defined hospital quality in terms of the percentage of preventable deaths (25% at poor-quality hospitals and 5% at average-quality hospitals). They performed a Monte Carlo simulation using data from 190 hospitals to generate mortality data. The simulations assumed various prevalence values and showed the resulting false-positive rates from using the hospital standardized mortality ratio to designate poor-quality hospitals. Assuming a true prevalence of poor-quality hospitals of 10%, they found that only 52% of hospitals with significant elevations in the ratio would in fact be classified as poor-quality hospitals. Moreover, 65% of poor-quality hospitals would not have significant elevations in the ratio.
The choice of a risk-adjustment model represents another nonrandom source of variation. Although one cannot expect any specific model to achieve perfect case-mix adjustment, different case-mix models should produce similar hospital rankings. However, several studies revealed striking differences in the classifications of hospitals as either high or low outliers when standardized mortality ratios were calculated using various widely accepted case-mix adjustment models.22,23
Minimum bias
Measuring hospital performance requires adjustment for important patient factors that predict outcomes. Two problems with administrative data potentially bias the standardized mortality ratio: the omission of important clinical information from routinely collected data and the quality of discharge abstracts (the data source for hospital standardized mortality ratios). If either problem is distributed in a nonrandom manner among hospitals, differences in standardized mortality ratios will reflect bias rather than quality of care.
Patient factors that predict outcomes fall into 3 basic categories: demographics, comorbid conditions and severity of illness (Figure 1). Administrative data capture most demographics (e.g., age, sex) and can approximate socioeconomic status (e.g., by using postal codes). They also capture the number and type of comorbid conditions that patients have (e.g., diabetes, hypertension, dementia), but not the severity of the conditions or the patients' overall functional status. Administrative data provide no information on the severity of acute illness or the complexity of surgical cases. For example, administrative coding of diagnoses does not distinguish mild from severe pneumonia or a stroke that produces moderate deficits that resolve within days from one that causes marked cerebral edema and persistent, dense hemiplegia.
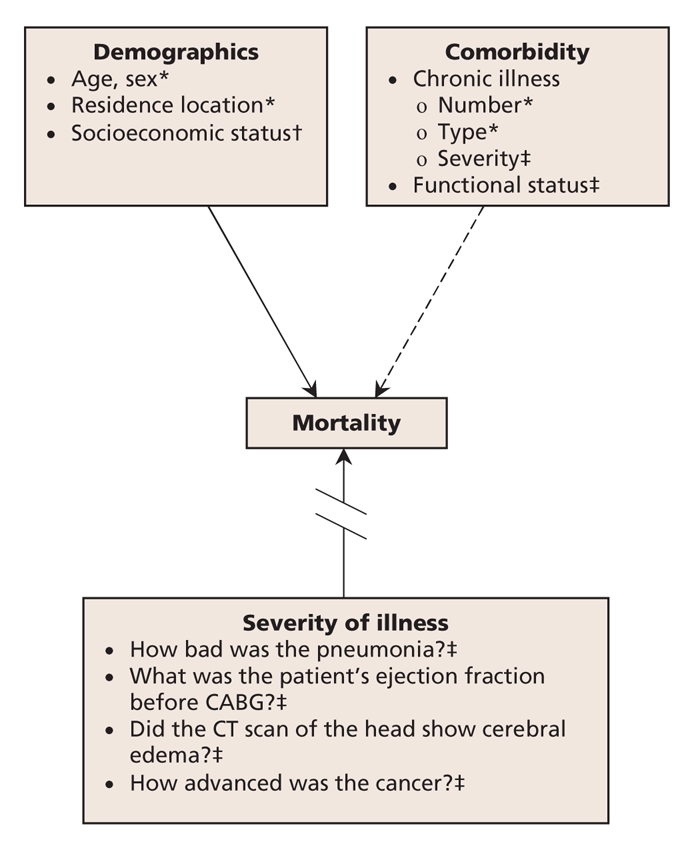
Figure 1: Case-mix adjustment using administrative data to measure hospital performance. Case mix consists of 3 categories of patient factors that predict outcomes of care, including mortality. Administrative data capture demographic factors reasonably well (solid arrow), but they only partially capture comorbidity (dashed arrow) and do not measure severity of illness (broken arrow). *Captured by administrative data. †Partially captured by administrative data. ‡Not captured by administrative data. CABG = coronary artery bypass graft, CT = computed tomography.
Coding accuracy also limits the utility of administrative data for performance measurement.24,25 Undercoding secondary diagnoses that capture the complexity of patients' conditions will falsely elevate hospital standardized mortality ratios, whereas coding secondary diagnoses that do not affect prognosis will spuriously lower the ratios.22,26 This explains the paradox observed in several studies that patients who have more chronic illnesses have lower risk-adjusted mortality.22,26 An additional problem concerns palliative care. Although one might expect that the exclusion of patients receiving palliative care would lower hospital standardized mortality ratios, almost half of Ontario hospitals have been found to have higher ratios after the exclusion of these patients.27 This finding suggests that variation in coding and discharge practices for palliative care patients distort standardized mortality ratios in an unpredictable manner.
Fostering quality improvement
Supporters recommend using the hospital standardized mortality ratio to monitor quality of care over time.4–6 However, the random fluctuations that most hospitals will exhibit and the low rates of preventable hospital deaths identified in large chart-review studies18–20 do not bode well for this ratio as a tool for monitoring quality or driving improvement efforts. Nonetheless, 2 published reports describe the use of the hospital standardized mortality ratio to foster and monitor quality-improvement efforts.4,5
One of these reports4 involved an institution that had the highest hospital standardized mortality ratio of all acute care hospitals in England in the year 2000. From 1996 to 2001, this hospital's ratio was more than double the national average on multiple occasions; however, it crossed this “alarm threshold” only twice after 2002. This reduction from multiple crossings of the arbitrarily chosen threshold to only 2 such crossings does not present compelling evidence of real change.
A more noteworthy report by Wright and colleagues5 involved a hospital that undertook to lower its standardized mortality ratio despite its rating as an average-quality hospital. The authors attributed the eventual reduction to the following interventions: educational sessions for junior staff on the recognition and treatment of life-threatening emergencies; implementation of medication reconciliation; use of infection-control measures, including a hand-hygiene campaign, staff-awareness sessions, improved ward cleaning, antibiotic guidelines, and surveillance and feedback of infection rates; and changes in the management of patients receiving palliative care, so that they were less frequently admitted to hospital and more frequently discharged to die elsewhere.
Most of these changes would be extremely unlikely to reduce mortality. For example, passive educational efforts generally represent ineffective quality-improvement strategies, and hand-hygiene campaigns tend to produce modest improvements (at best) in hand-washing adherence. No studies performed since the 19th century have demonstrated improvements in hard outcomes such as mortality.28 Similarly, no study of medication discrepancies has shown an effect compatible with reduced mortality.29 The reduction in standardized mortality ratio that Wright and colleagues5 observed most likely reflects the changes in palliative care: fewer patients were admitted to die in hospital and more patients were discharged to die elsewhere. Such changes would indeed lower mortality and may even improve care for dying patients, but this hardly counts as saving lives.
Ease of measurement
Hospital standardized mortality ratios derived from routinely collected administrative data cost little to measure.6,7 However, initiating quality improvement based on these ratios requires more resources than would be needed with other performance measures. Hospital personnel must review numerous charts to identify potentially preventable deaths and then invest further time to find any recurring problems amenable to improvement efforts. Also, a measure that frequently provides misleading information offers low value, even if it is easy to use and costs little.
Other performance measures
Robust performance measurement will likely require multiple measures, including those of outcomes, processes and structures.30 For mortality to provide an adequate measure of performance, either to compare institutions or to track quality of care over time, a focus on single conditions or procedures will be required. Such a focus would facilitate the recognition of explanations for poor performance (e.g., delivery of established processes of care known to reduce mortality among patients with a particular condition) and permit more accurate risk adjustment than would otherwise be possible with overall hospital mortality. In some cases, administrative data alone may be sufficient for risk adjustment.31 In others, adequately adjusting for risk may require combining administrative data with select clinical information. In cardiac surgery, for instance, supplementing administrative data with the coronary disease pattern, angina class and left-ventricular function provides an acceptable measurement of risk-adjusted mortality.32 In other cases, more comprehensive collection of clinical data has been considered a worthwhile investment, as with the US Department of Veterans Affairs' National Surgical Quality Improvement Program.33
The mere avoidance of death conveys little about the quality of care related to most conditions and procedures. Thus, outcomes-based performance measures will have to include important measures of morbidity, such as surgical site infections, key nosocomial infections and functional status (e.g., 30 days after acute stroke), to name a few. Measuring functional status would require substantial investment, but it would serve 2 important goals. First, it would reduce the bias in purely hospital-based measurement owing to variations in lengths of stay (e.g., hospitals would not be rewarded for simply discharging patients to die elsewhere). Second, it would force hospitals to help coordinate follow-up care and decrease the fragmentation that plagues the management of so many patients with serious health problems.
The timely delivery of medicine and other processes of care with a strong relation to important outcomes (e.g., established therapies for acute myocardial infarction) have a clear role to play in performance measurement, but process measures must also be chosen with care. Variations in patient eligibility criteria (or in clinical documentation of such variation) can introduce spurious variations in performance. Overemphasis of process measures can induce “playing for the test” (i.e. hospitals respond to process-based performance measurement by focusing their efforts on the processes of care being measured, regardless of the impact on other aspects of quality), as has likely happened with the focus on time to administration of antibiotics for patients with pneumonia at hospitals in the United States.34
Finally, some structural measures, though relatively blunt, may provide valid performance measures. Patient volume represents a prominent structural measure of quality (since higher volumes tend to correlate with improved outcomes, especially for surgical procedures35), but others might include nurse staffing ratios,36 the organization of intensive care units37 and possibly measures related to hospital governance.38
Advocates of hospital standardized mortality ratios acknowledge that hospitals should adopt a “dashboard” or “scorecard” approach, for which mortality is just one component. However, mortality will always overshadow other measures. The knowledge that a local hospital has exemplary rates of adherence to hand hygiene, for instance, will do little to assuage the public in the face of an apparent excess of deaths. Composite measures have found some application (e.g., a score that combines mortality with performance on several target processes of care). However, just as with composite outcomes in clinical trials, care must be taken to avoid large gradients in importance among components.39 For example, a performance measure for cardiac care that combined mortality after myocardial infarction with various process measures (e.g., rates of smoking-cessation counselling) would raise concerns that differences in performance could be perceived to be associated with mortality but would actually be driven by results for less important components.
Conclusion
The understandable desire to make up for past inattention to health care quality can come at the cost of implementing improvement strategies before they are ready for widespread dissemination.40 Hospital standardized mortality ratios can inaccurately label good hospitals as poor performers and fail to identify many hospitals with true quality problems. Moreover, the deceptively low cost of measurement is offset by expenses to institutions that choose to investigate their performance, since, in contrast to other performance measures, hospital mortality ratios provide no indication of the underlying quality problems.
Developing satisfactory performance measures will require substantial investment. Mortality measures will need to focus on specific conditions and procedures with known connections to elements of care that providers are able to control. Adjusting mortality measures for case mix can sometimes be done with the use of administrative data alone, but efforts to obtain clinical information from charts will be required in many situations. Although expensive, the process of obtaining detailed clinical data would support accurate risk adjustment for mortality outcomes. It would also permit capturing other outcomes (e.g., functional outcomes, nosocomial infections, other complications of care) that we will need to highlight if we are truly to take on the task of measuring performance and improving health care quality.
Key points.
Hospital standardized mortality ratios correlate weakly with other measures of quality of care and have additional limitations when derived solely from administrative data.
More robust measurement of performance will require a combination of indicators, including mortality for a few specific conditions and procedures, as well as other measures of morbidity and selected processes.
Developing and implementing valid performance measures will require substantial investment but will avoid the wasted resources.
Valid and precise measurements will minimize other consequences of mislabelling large numbers of hospitals in terms of the quality of care they deliver.
Acknowledgments
Kaveh Shojania holds a Canada Research Chair in Patient Safety and Quality Improvement. Alan Forster is supported by an Ontario Ministry of Health and Long-Term Care Career Scientist Award.
Footnotes
This article has been peer reviewed.
Contributors: Both of the authors contributed to the conception and design of the manuscript, drafted and revised the article and approved the final version for publication.
Competing interests: None declared.
Correspondence to: Dr. Kaveh G. Shojania, Sunnybrook Health Sciences Centre, Rm. D470, 2075 Bayview Ave., Toronto ON M4N 3M5; fax 416 480-6191; kaveh.shojania@sunnybrook.ca
REFERENCES
- 1.Krumholz HM, Rathore SS, Chen J, et al. Evaluation of a consumer-oriented Internet health care report card: the risk of quality ratings based on mortality data. JAMA 2002;287:1277-87. [DOI] [PubMed]
- 2.Rosenthal GE, Shah A, Way LE, et al. Variations in standardized hospital mortality rates for six common medical diagnoses: implications for profiling hospital quality. Med Care 1998;36:955-64. [DOI] [PubMed]
- 3.Hannan EL, Kilburn H Jr, Racz M, et al. Improving the outcomes of coronary artery bypass surgery in New York State. JAMA 1994;271:761-6. [PubMed]
- 4.Jarman B, Bottle A, Aylin P, et al. Monitoring changes in hospital standardised mortality ratios. BMJ 2005;330:329. [DOI] [PMC free article] [PubMed]
- 5.Wright J, Dugdale B, Hammond I, et al. Learning from death: a hospital mortality reduction programme. J R Soc Med 2006;99:303-8. [DOI] [PMC free article] [PubMed]
- 6.Canadian Institute for Health Information. HSMR: a new approach for measuring hospital mortality trends in Canada. Ottawa: The Institute; 2007. Available: www.cihi.ca/cihiweb/dispPage.jsp?cw_page=AR_1789_E (accessed 2008 May 26).
- 7.Jarman B, Gault S, Alves B, et al. Explaining differences in English hospital death rates using routinely collected data. BMJ 1999;318:1515-20. [DOI] [PMC free article] [PubMed]
- 8.Canadian Institute for Health Information. Technical notes: hospital standardized mortality ratio (HSMR). Ottawa: The Institute; 2007. Available: www.cihi.ca/cihiweb/en/downloads/hsmr_tech_notes_sept2007_e.pdf. (accessed 2008 May 26).
- 9.Pitches DW, Mohammed MA, Lilford RJ. What is the empirical evidence that hospitals with higher-risk adjusted mortality rates provide poorer quality care? A systematic review of the literature. BMC Health Serv Res 2007;7:91. [DOI] [PMC free article] [PubMed]
- 10.Thomas JW, Hofer TP. Research evidence on the validity of risk-adjusted mortality rate as a measure of hospital quality of care. Med Care Res Rev 1998;55:371-404. [DOI] [PubMed]
- 11.Lewis RQ, Fletcher M. Implementing a national strategy for patient safety: lessons from the National Health Service in England. Qual Saf Health Care 2005;14:135-9. [DOI] [PMC free article] [PubMed]
- 12.Sibbald B. Accelerate health system renewal, says Health Council. CMAJ 2006;174:755. [DOI] [PMC free article] [PubMed]
- 13.Lindenauer PK, Remus D, Roman S, et al. Public reporting and pay for performance in hospital quality improvement. N Engl J Med 2007;356:486-96. [DOI] [PubMed]
- 14.Fung CH, Lim YW, Mattke S, et al. Systematic review: the evidence that publishing patient care performance data improves quality of care. Ann Intern Med 2008;148:111-23. [DOI] [PubMed]
- 15.Galvin RS, Delbanco S, Milstein A, et al. Has the leapfrog group had an impact on the health care market? Health Aff (Millwood) 2005;24:228-33. [DOI] [PubMed]
- 16.Williams SC, Schmaltz SP, Morton DJ, et al. Quality of care in U.S. hospitals as reflected by standardized measures, 2002–2004. N Engl J Med 2005;353:255-64. [DOI] [PubMed]
- 17.Refinement of the HCUP Quality Indicators. Rockville (MD): Agency for Healthcare Research and Quality; May 2001; publication no. 01-0035. Available: www.ahrq.gov/clinic/tp/hcupqitp.htm (accessed 2008 June 5). [PubMed]
- 18.Dubois RW, Rogers WH, Moxley JH, et al. Hospital inpatient mortality. Is it a predictor of quality? N Engl J Med 1987;317:1674-80. [DOI] [PubMed]
- 19.Hayward RA, Hofer TP. Estimating hospital deaths due to medical errors: Preventability is in the eye of the reviewer. JAMA 2001;286:415-20. [DOI] [PubMed]
- 20.Briant R, Buchanan J, Lay-Yee R, et al. Representative case series from New Zealand public hospital admissions in 1998. III: Adverse events and death. N Z Med J 2006;119:U1909. [PubMed]
- 21.Hofer TP, Hayward RA. Identifying poor-quality hospitals. Can hospital mortality rates detect quality problems for medical diagnoses? Med Care 1996;34:737-53. [DOI] [PubMed]
- 22.Iezzoni LI. The risks of risk adjustment. JAMA 1997;278:1600-7. [DOI] [PubMed]
- 23.Austin PC, Naylor CD, Tu JV. A comparison of a Bayesian vs. a frequentist method for profiling hospital performance. J Eval Clin Pract 2001;7:35-45. [DOI] [PubMed]
- 24.Iezzoni LI. Assessing quality using administrative data. Ann Intern Med 1997;127:666-74. [DOI] [PubMed]
- 25.Scott IA, Ward M. Public reporting of hospital outcomes based on administrative data: risks and opportunities. Med J Aust 2006;184:571-5. [DOI] [PubMed]
- 26.Jencks SF, Williams DK, Kay TL. Assessing hospital-associated deaths from discharge data. The role of length of stay and comorbidities. JAMA 1988;260:2240-6. [PubMed]
- 27.McKinley J. Provincial direction around hospital standardized mortality ratio. Presented at: Moving forward: making sense of your hospital standardized mortality ratio (HSMR) to enhance quality of care. Toronto; 2007 Dec 3; Ontario Hospital Association.
- 28.Gould DJ, Chudleigh JH, Moralejo D, et al. Interventions to improve hand hygiene compliance in patient care. Cochrane Database Syst Rev 2007;CD005186. [DOI] [PubMed]
- 29.Tam VC, Knowles SR, Cornish PL, et al. Frequency, type and clinical importance of medication history errors at admission to hospital: a systematic review. CMAJ 2005;173:510-5. [DOI] [PMC free article] [PubMed]
- 30.Shojania KG, Showstack J, Wachter RM. Assessing hospital quality: a review for clinicians. Eff Clin Pract 2001;4:82-90. [PubMed]
- 31.Krumholz HM, Wang Y, Mattera JA, et al. An administrative claims model suitable for profiling hospital performance based on 30-day mortality rates among patients with an acute myocardial infarction. Circulation 2006;113:1683-92. [DOI] [PubMed]
- 32.Guru V, Fremes SE, Naylor CD, et al. Public versus private institutional performance reporting: What is mandatory for quality improvement? Am Heart J 2006;152:573-8. [DOI] [PubMed]
- 33.Rowell KS, Turrentine FE, Hutter MM, et al. Use of national surgical quality improvement program data as a catalyst for quality improvement. J Am Coll Surg 2007;204:1293-300. [DOI] [PubMed]
- 34.Mitka M. JCAHO tweaks emergency departments' pneumonia treatment standards. JAMA 2007;297:1758-9. [DOI] [PubMed]
- 35.Halm EA, Lee C, Chassin MR. Is volume related to outcome in health care? A systematic review and methodologic critique of the literature. Ann Intern Med 2002;137:511-20. [DOI] [PubMed]
- 36.Aiken LH, Clarke SP, Sloane DM, et al. Hospital nurse staffing and patient mortality, nurse burnout, and job dissatisfaction. JAMA 2002;288:1987-93. [DOI] [PubMed]
- 37.Young MP, Birkmeyer JD. Potential reduction in mortality rates using an intensivist model to manage intensive care units. Eff Clin Pract 2000;3:284-9. [PubMed]
- 38.Weiner BJ, Alexander JA, Shortell SM. Leadership for quality improvement in health care; empirical evidence on hospital boards, managers, and physicians. Med Care Res Rev 1996;53:397-416. [DOI] [PubMed]
- 39.Montori VM, Permanyer-Miralda G, Ferreira-Gonzalez I, et al. Validity of composite end points in clinical trials. BMJ 2005;330:594-6. [DOI] [PMC free article] [PubMed]
- 40.Auerbach AD, Landefeld CS, Shojania KG. The tension between needing to improve care and knowing how to do it. N Engl J Med 2007;357:608-13. [DOI] [PubMed]