

Abstract
Hepatitis E virus (HEV) causes acute viral hepatitis and is endemic in the developing world. Few data are available on cellular immune responses in HEV infection. Using flow cytometry, we studied the frequencies of peripheral blood CD4+/CD8+ T cells secreting interferon (IFN)-γ, tumor necrosis factor (TNF)-α, and interleukin (IL)-4 in 21 patients with acute hepatitis E and 18 healthy controls, after stimulation with the HEV capsid (ORF2) protein. Cytokine levels in serum specimens and culture supernatants of ORF2-stimulated peripheral blood mononuclear cells (PBMCs) were estimated in enzyme-linked immunosorbent assays. In addition, cytokine mRNA transcripts were measured in PBMCs by reverse transcription-polymerase chain reaction. In patients with acute hepatitis E, although the total CD4+ population was expanded, the proportions of CD4+/CD69+ and CD8+/CD69+ cells producing IFN-γ, TNF-α, and IL-4 in response to HEV ORF2 stimulation were unchanged. However, IFN-γ levels in the supernatants and IFN-γ mRNA transcripts in cells were elevated in ORF2-stimulated PBMCs in acute hepatitis E; levels of IL-2 or TNF-α were unchanged. Our findings suggest that CD4+ IFN-γ-secreting cells, which do not belong either to the helper T cell type 1 or type 2 phenotype, as is the case with natural killer T cells, may be involved in the pathogenesis of hepatitis E. Further, the limited immune reactivity we detected in peripheral blood cells may be related to the sequestration of immune events to the intrahepatic compartment, which is the major disease site.
INTRODUCTION
Hepatitis E virus (HEV) is a common cause of acute viral hepatitis in several developing countries (1,14). The disease is highly endemic in India and its neighboring countries, where hepatitis E outbreaks occur frequently (10,17,30). Further, in these regions, 50 to 70% of cases of sporadic viral hepatitis are related to HEV infection (3). The disease is transmitted predominantly through the fecal-oral route, is usually self-limiting, and no chronic sequelae have been reported. During outbreaks, the disease attack rate is much higher among young adults.
HEV virions are nonenveloped particles, 32-34 nm in diameter, with icosahedral symmetry (4). The viral nucleic acid is an approximately 7.2-kilobase-long, single-stranded, positive-sense RNA with three open reading frames (ORFs) (26). ORF1 encodes nonstructural proteins responsible for viral genome replication and viral polyprotein processing, ORF2 encodes the major capsid protein, and ORF3 encodes a phosphoprotein that associates with the cytoskeleton and appears to have regulatory functions and a potential role in viral nucleocapsid assembly (31). The virus is classified in a separate genus of Hepevirus (20).
Host cell injury in a viral infection may be mediated by either a direct effect of the infectious agent or indirectly through the antiviral host immune response, or through a combination of these. The direct cytopathic effect of HEV has been difficult to study because the virus has not been cultured efficiently in vitro.
Immune responses, both humoral and cellular, can play a role in the pathogenesis of viral infections. The humoral response consists of antibodies that may neutralize the virus; for instance, antibodies to hepatitis B virus (HBV) can neutralize the virus and play an important role in recovery from acute HBV infection (15). In contrast, hepatitis C virus (HCV) does not induce a protective humoral immune response (7). In HEV infection, both IgM and IgG antibodies appear concomitantly with the development of jaundice, and persist for variable periods of time. Although these antibodies appear to have neutralizing activity (22), their longevity and exact role in protection against HEV reinfection remain unclear (12).
Cellular immune responses, both innate and adaptive, are important for viral clearance. Antigen-nonspecific natural killer (NK) and natural killer-like T (NKT) cells, and antigen-specific MHC class I-restricted CD8+ cells, have been shown to lyse virus-infected targets in several viral infections (25). These responses may be particularly important in the pathogenesis of hepatotropic viral infections, because NK, NKT, and CD8+ T cells are known to undergo preferential concentration in the liver compared with the peripheral blood (5). Antigen-specific CD8+ cytotoxic cells have been shown to play a major role in the clearance of HBV and HCV infection; the role of NK and NKT cells in these infections is, however, less well studied. In addition, infection with HBV or HCV is associated with massive recruitment of antigen-nonspecific inflammatory cells into the liver, which helps in viral clearance through the production of proinflammatory cytokines such as tumor necrosis factor-α (TNF-α) and interferon-γ (IFN-γ) and proteases such as perforin. The IFN-γ produced by these cells also has direct antiviral activity (9). The net balance of these immune events determines the outcome of HBV or HCV infection. Thus, an aggressive immune response leads to effective viral clearance that is accompanied by a variable degree of hepatic damage. On the other hand, an inadequate cytotoxic response results in viral persistence, albeit with little liver damage.
In contrast to HBV and HCV infection, there is little information regarding immune responses in HEV infection. We have previously reported the presence, in the peripheral blood of patients with acute hepatitis E, of immune reactive cells that responded to a mixture of peptides representing parts of HEV proteins and to recombinant HEV ORF2 protein (2,16,19).
HEV infection, although usually associated with mild to moderate, self-limited disease, can occasionally lead to fulminant hepatic failure. This severe form of disease is particularly common among pregnant women with HEV infection, in whom mortality rates can be as high as 15-20% (11). To develop effective interventions that may prevent this mortality, it may be important to understand the role of various immune effector responses during this infection. In this study, we report data on cellular immune responses in patients with acute hepatitis E.
MATERIALS AND METHODS
Study subjects
Thirty-one patients with sporadic acute icteric hepatitis E (28 male; mean [±SD] age, 27 ± 9 yr) who tested positive for IgM anti-HEV antibody were enrolled in the study. All the patients tested negative on enzyme immunoassays (EIAs) for hepatitis B surface antigen (Dia-Sorin, Saluggia, Italy), IgM anti-hepatitis A virus antibody (Hepanostika HAV IgM; Organon Teknika, Boxtel, The Netherlands), and anti-HCV antibody (Hepanostika HCV Ultra; United Biomedical, Beijing, China). Median (range) serum bilirubin concentration, serum alanine aminotransferase activity, and duration of illness were 6.2 (0.7-27.2) mg/dL, 102 (38-1660) IU/L, and 13 (6-27) d, respectively. Eighteen healthy subjects (13 male; age, 29 ± 4 yr) who tested negative for IgG anti-HEV antibody were studied as controls. IgM and IgG anti-HEV antibodies were detected with commercial EIA kits (Genelabs Diagnostics/MP Biomedicals Asia Pacific, Singapore). Heparinized blood and serum were obtained from each subject. An institutional ethics committee approved the study protocol and all study subjects provided informed consent.
Enumeration of antigen-specific cytokine-producing cells by flow cytometry
Heparinized whole blood was diluted with an equal volume of RPMI 1640 (Sigma, St. Louis, MO) and stimulated with a recombinant HEV ORF2 protein (10 μg/mL) expressed using the baculovirus system and purified as described previously (32). Anti-human CD28 and CD49d (1 μg/mL each) monoclonal antibodies were added to each tube to provide costimulation. A positive control was set up with polyclonal stimulators phorbol myristate acetate (PMA, 50 ng/mL; Sigma) and ionomycin (1 μg/mL; Sigma). After 2 h of incubation at 37°C, brefeldin A (10 μg/mL; Sigma), which arrests secretion of proteins from cells, was added to the culture. After further incubation for 4 h, the cells were stained for cell surface markers (CD3, CD4, or CD8, separately) for 30 min, using fluorescein isothiocyanate (FITC)-labeled anti-CD3/anti-CD4/anti-CD8 monoclonal antibodies. Red blood cells (RBCs) were then lysed with BD FACS lysing solution (BD Biosciences Pharmingen, San Diego, CA) and cells were fixed and permeabilized with BD Cytofix/Cytoperm solution (BD Biosciences Pharmingen) for 20 min. After washing with BD Perm/Wash buffer (BD Biosciences Pharmingen), the cells were stained for intracellular CD69 (an early activation marker) using CyChrome-labeled anti-CD69 antibody, and for intracellular cytokines (namely, IFN-γ, TNF-α, or interleukin [IL]-4) using phycoerythrin (PE)-labeled specific antibodies for 45 min (all staining antibodies were obtained from BD Biosciences Pharmingen). Data on the stained cells were acquired with a flow cytometer (FACSCalibur; BD Biosciences Immunocytometry Systems, San Jose, CA) and analyzed with CellQuest software (BD Biosciences Immunocytometry Systems). Mononuclear cells were gated on forward and side scatter parameters, and the proportions of the gated cells staining positive for various combinations of cell surface markers, intracellular CD69, and intracellular cytokines were determined. For each analysis, 20,000 events were acquired within the mononuclear cell gate based on size and granularity of the cells, and analyzed for three colors, that is, FITC (CD3, CD4, or CD8), CyChrome (CD69), and PE (IFN-γ, TNF-α, or IL-4) (Fig. 1). Appropriate isotype-matched negative control reagents were used for each fluorescent label.
FIG. 1.
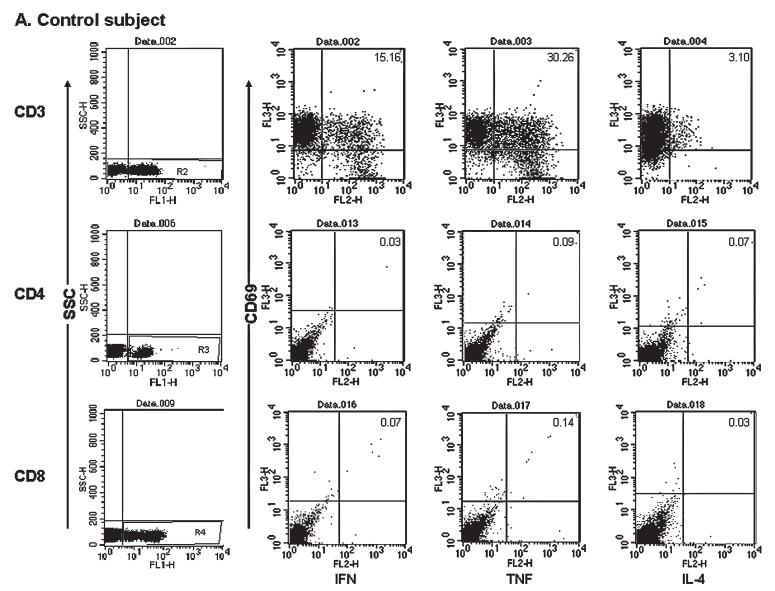

Representative dot plots of three-color fluorescence data for detection of cells staining for intracellular cytokines for one healthy control subject (A) and one patient (B). Both (A) and (B) show results after stimulation of whole blood with PMA and ionomycin (top row) or hepatitis E virus ORF2 protein (middle and bottom rows) for 6 h with addition of BD GolgiStop (BD Biosciences Pharmingen) for the last 5 h of culture. Cells were surface stained with fluorescein isothiocyanate (FITC)-labeled antibodies to CD3, CD4, or CD8; fixed; permeabilized; and then labeled with PerCP-labeled CD69 and one phycoerythrin (PE)-labeled anti-cytokine (IFN-α, TNF-α, or IL-2) antibody. The gate for mononuclear cells was drawn using forward scatter (FSC) and side scatter (SSC) parameters, and 20,000 events were acquired within this gate. Cells positive for CD3 (top row), CD4 (middle row), and CD8 (bottom row) were gated on FL-1 and SSC (first column). Within each gate, the proportion of CD69- and cytokine-positive cells was analyzed; the cutoffs used were based on isotype control for the CD3+ population (top row) and the corresponding unstimulated cells for the CD4+ and CD8+ cells (middle and bottom rows).
Cytokine EIAs in culture supernatants and serum samples
Peripheral blood mononuclear cells (PBMCs) were separated from 10 mL of heparinized (10 U/mL) blood by density-gradient centrifugation, using Histopaque (Sigma); washed in phosphate-buffered saline; and resuspended in complete RPMI 1640 containing 10% heat-inactivated fetal calf serum (FCS; Sigma), 2 mM glutamine, and antibiotic-antimycotic mixture (GIBCO brand; Invitrogen, Carlsbad, CA). PBMCs (1 × 10⁶/mL) were stimulated with either 1:100 phytohemagglutinin (GIBCO brand PHA; Invitrogen) or recombinant HEV ORF2 protein (10 μg/mL each) for 24 h in six-well plates at 37°C in a 5% CO2 atmosphere. An unstimulated culture was also set up to assess spontaneous production of cytokines. Culture supernatants were stored at -80°C for measurement of cytokine levels.
EIAs for IFN-γ, TNF-α, IL-4, IL-2, and interleukin-1β (IL-1β) were performed on the culture supernatants and on serum specimens using commercial kits (BD Biosciences Pharmingen). Briefly, Nunc-Immuno module wells (Nalge Nunc International, Copenhagen, Denmark) were coated with mouse anti-human anti-cytokine (capture) antibody diluted in coating buffer (0.1 M sodium carbonate, pH 9.5; 100 μL/well) and kept overnight at 4°C. Wells were washed with wash buffer (0.05% Tween 20 in phosphate-buffered saline [PBS]) three times and nonspecific sites were blocked by incubation with blocking buffer (10% FCS in PBS; 300 μL/well) for 1 h. After further washing, 100-μL samples of standards and test specimens were added to the wells and incubated for 2 h. Wells were washed, followed by addition of 100 μL of biotinylated goat anti-human anti-cytokine (detection) antibody plus streptavidin-horseradish peroxidase diluted in blocking buffer. After incubation for 1 h followed by washing, an enzyme substrate (100 μL/well) was added and the plates were incubated in the dark for 30 min. Finally, 50 μL of stop solution was added and plates were read in an EIA reader at 450 nm. The minimum detection limit was 4.7 pg/mL for IFN-γ, 15.6 pg/mL for TNF-α and IL-1β, and 7.8 pg/mL for IL-4 and IL-2.
Semiquantitative reverse transcriptase-polymerase chain reaction for cytokine mRNA
Total RNA was extracted from PBMCs obtained from three patients with acute hepatitis E and three healthy controls, using a mixture of guanidine thiocyanate and phenol in a monophase solution (TRI Reagent; Sigma) and reverse transcribed with avian myeloblastosis virus reverse transcriptase (Roche Molecular Systems, Branchburg, NJ) and random hexamer oligonucleotides (Roche Molecular Systems). The polymerase chain reaction (PCR) was performed in reaction volumes of 25 μL, using specific primer pairs for various cytokine genes encoding IFN-γ, TNF-α, IL-2, and IL-4; glyceraldehyde-3′-phosphate dehydrogenase (GAPDH) gene was used as a control (Table 1). The thermal profile consisted of an initial denaturation (95°C for 2 min), 35 amplification cycles (denaturation at 95°C for 1 min, annealing [IFN-γ, 56°C; TNF-α, 66°C; IL-4, 58°C; IL-2, 56°C; and GAPDH, 56°C] for 1 min, and extension at 72°C for 1 min), and a final extension at 72°C for 7 min. PCR products were subjected to 1.5% agarose gel electrophoresis and analyzed with a Kodak digital camera (DC-40) and image analysis software (Digital Science 1D). Results were expressed as ratios of intensity of bands of cytokine genes relative to that of the control gene.
Table 1.
Primer Sequences for Semiquantitative Reverse Transcription Polymerase Chain Reaction for mRNA of Cytokines and GAPDH
| Gene | Primer | Nucleotide sequence | Product size (bp) |
|---|---|---|---|
| IFN-γ | Sense | TCT GCA TCG TTT TGG GTT CTC | 321 |
| Antisense | TCA GCT TTT CGA AGT CAT CTC | ||
| TNF-α | Sense | GAG TGA CAA GCC TGT AGC CCA TGT TGT AGC | 444 |
| Antisense | GCA ATA ATC CCA AAG TAG ACC TGC CCA GAC T | ||
| IL-4 | Sense | CCT CTG TTC TTC CTG CTA GCA | 300 |
| Antisense | GCC GTT TCA GGA ATC GGA TCA | ||
| IL-2 | Sense | ATG TAC AGG ATG CAA CTC CTG TCT T | 502 |
| Antisense | GTT AGT GTT GAG ATG ATG CTT TGA C | ||
| GAPDH | Sense | GAA GGT GAA GGT CGG AGT C | 225 |
| Antisense | GAA GAT GGT GAT GGG ATT TC |
Abbreviations: bp, base pairs; GAPDH, glyceraldehyde-3-phosphate dehydrogenase; IFN, interferon; IL, interleukin; TNF, tumor necrosis factor.
Statistical analysis
Data were expressed as median (range). Intergroup comparisons were done by Mann-Whitney U test and SPSS 9.0 software (SPSS, Chicago, IL); p values less than 0.05 were considered significant.
RESULTS
Response to PMA and ionomycin
After stimulation with PMA and ionomycin, the proportions of mononuclear cells staining CD3+/CD69+/IFN-γ+ and CD3+/CD69+/TNF-α+ were lower in patients with acute hepatitis E than in healthy controls; there was no change in the proportion of CD3+/CD69+/IL-4+ cells (Table 2).
Table 2.
Proportions of Mononuclear Cells Staining Positive for CD3, CD69, and Intracellular Cytokines after Stimulation with PMA and Ionomycin in Patients with Acute Hepatitis E and Healthy Controlsa
| Parameter | Controls (n = 18) | Acute hepatitis E (n = 21) | p Value |
|---|---|---|---|
| CD3+/CD69+/IFN-γ+ | 10.2 (6.2-17.7) | 6.5 (0.31-69.6) | <0.05 |
| CD3+/CD69+/TNF-α+ | 17.5 (12.5-31.8) | 12.1 (2.1-53.2) | <0.05 |
| CD3+/CD69+/IL-4+ | 3.1 (1.1-8.2) | 1.9 (0.16-11.2) | NS |
All data are shown as the percentage of cells [median (range)].
The numbers of CD3+/CD69+/IFN-γ+, CD3+/CD69+/TNF-α+, and CD3+/CD69+/IL-4+ cells were comparable in acute hepatitis E patients with disease duration up to 14 d and in those with longer disease duration (detailed data not shown).
T cell subpopulations
The median proportion of mononuclear cells in the CD4+ subpopulation was higher in patients with acute hepatitis E (35.4 [range, 21.4-51.7]%) than in controls (30.1 [18.0-37.0]%; p < 0.01). The proportion of mononuclear cells was similar in patients with disease duration up to or longer than 14 d.
There was no difference in the CD8+ population between the two groups (30.1 [15.5-38.7]% vs. 31.1 [18.4-58.9]%; p = NS).
Antigen-specific responses to HEV ORF2 protein
The proportions of CD4+/CD69+ and CD8+/CD69+ cells producing IFN-γ, TNF-α, and IL-4 in response to stimulation with HEV ORF2 protein were similar in patients with acute hepatitis E and controls (Table 3).
Table 3.
Proportions of Mononuclear Cells Staining Positive for Various Cell Surface Markers, CD69, and Intracellular Cytokines After Stimulation with HEV ORF2 Protein in Patients with Acute Hepatitis E and Healthy Controlsa
| Parameter | Controls (n = 18) | Acute hepatitis E (n = 21) |
|---|---|---|
| CD4+/IFN-γ+/CD69+ | 0.04 (0-0.11) | 0.02 (0-0.11) |
| CD4+/TNF-α+/CD69+ | 0.04 (0-0.09) | 0.04 (0-0.52) |
| CD4+/IL-4+/CD69+ | 0.05 (0-1.92) | 0.02 (0-0.97) |
| CD8+/IFN-γ+/CD69+ | 0.04 (0.01-0.19) | 0.04 (0-0.61) |
| CD8+/TNF-α+/CD69+ | 0.07 (0-0.27) | 0.05 (0-0.78) |
| CD8+/IL-4+/CD69+ | 0.04 (0-0.07) | 0.03 (0-0.34) |
All data are shown as the percentage of mononuclear cells gated on forward and side scatter on flow cytometry; values represent median (range).
Cytokine levels in culture supernatants in response to ORF2 protein
IFN-γ levels in the supernatants of HEV ORF2 protein-stimulated cultures of PBMCs obtained from patients with acute hepatitis E were higher than those in similar supernatants obtained from PBMCs of controls. There was no difference in IL-2 and TNF-α levels in such supernatants from PBMCs of patients and controls. IL-2 and IL-4 were detected in supernatants from PBMCs of only five and one acute hepatitis E patient, respectively, after ORF2 stimulation, and in two and none of those from controls, respectively (Table 4).
Table 4.
Concentration of Cytokines in Culture Supernatants of Peripheral Blood Mononuclear Cells after Stimulation with HEV ORF2 Protein in Patients with Acute Hepatitis E and Healthy Controlsa,b
| Cytokine | Controls (n = 18) | Acute hepatitis E (n = 21) |
|---|---|---|
| IFN-γ | 11.8 (<4.7-275.9) | 47.8 (<4.7-517.9)c |
| TNF-α | 282.3 (<15.6-1726.0) | 258.2 (<15.6-3720.5) |
Data are shown as picograms per milliliter [median (range)].
IL-2 was detected in five patients with acute hepatitis E and in two healthy controls; IL-4 was detected in one patient and in none of the controls.
p = 0.05.
IFN-γ levels in the supernatants were similar in patients with disease duration up to or longer than 14 d.
Cytokine transcript levels in response to ORF2
mRNA data supported the EIA data on PBMC supernatants. Stimulation with HEV ORF2 protein resulted in upregulation of IFN-γ mRNA in PBMCs from patients with acute hepatitis, but not in those from healthy controls (Fig. 2). TNF-α and IL2 mRNA showed comparable upregulation in patients and controls. IL-4 mRNA expression was not detectable in either patients or controls. Stimulation with PHA led to upregulation of expression of all four cytokines.
FIG. 2.

Representative cytokine mRNA expression in peripheral blood mononuclear cells obtained from one patient with acute hepatitis E and one healthy control subject. Lane 1, unstimulated; lane 2, after stimulation with phytohemagglutinin (PHA); lane 3, after stimulation with HEV ORF2 protein.
Serum cytokine levels
The median serum IL-1β level was increased in acute hepatitis E as compared with controls (<15.6 [<15.6-498.3] pg/mL versus <15.6 [<15.6-92.4] pg/mL; p < 0.05) (Fig. 3). Serum levels of TNF-α and IFN-γ in patients (TNF-α, <15.6 [<15.6-94] pg/mL; IFN-γ, <4.7 [<4.7-64.5] pg/mL) were similar to those of controls (TNF-α, <15.6 [<15.6-15.6] pg/mL; IFN-γ, <4.7 [<4.7-30.3] pg/mL). IL-4 was not detected in any patient or control sera. There was no difference in cytokine levels between patients with shorter and longer duration of illness.
FIG. 3.

Interleukin-1β levels in serum samples from patients with acute hepatitis E and from controls.
DISCUSSION
In the present study, we investigated HEV-specific cellular immune responses among patients with acute hepatitis E and compared these with responses in healthy controls who lacked evidence of exposure to HEV, as indicated by the absence of IgG anti-HEV antibodies. We observed an overall increase in the proportion of CD4+ cells, but no change in that of CD8+ cells, in the peripheral blood of patients with acute hepatitis E. There was increased production of IFN-γ by PBMCs in response to stimulation with HEV ORF2 protein in patients with acute hepatitis E; however, the frequencies of HEV ORF2-stimulated cytokine-producing CD4+ and CD8+ cells were comparable in patients and healthy controls. The serum IL-1β level was elevated in patients with hepatitis E.
There was an expansion of the overall CD4+ cell population in patients with acute hepatitis E. However, this was not reflected by expansion of HEV ORF2-specific CD4+/CD69+ cells producing helper T cell type 1 (IFN-γ and TNF-α) or helper T cell type 2 (IL-4) cytokines. The expansion of CD4+ cells was not accompanied by a change in the overall proportion of CD8+ cells. This expansion of CD4+ cells could thus reflect an increase in NKT cells, which are either CD3+/CD4+ or CD3+/CD4-/CD8- (6), and/or an increase in the CD4+/CD25+ T regulatory cell population. The former possibility is supported by our observation of an increase in the secretion of IFN-γ protein and of the increased production of IFN-γ mRNA transcripts by HEV ORF2 protein-stimulated PBMCs from patients with acute hepatitis E. We have previously reported a similar increase in the production of IFN-γ by PBMCs obtained from a group of pregnant women with acute hepatitis E; the stimulating antigen in that study was a mixture of peptides spanning a small part of the HEV proteins and not the whole HEV ORF2 protein (19). However, we cannot exclude the possibility of an expansion of regulatory T cells because we did not look for IL-10 secretion, the hallmark cytokine for this population of T cell.
A large variety of cells, including monocytes, dendritic cells, NK cells, and NKT cells, can produce IFN-γ. Of these, NK cells and NKT cells are known to be potent sources of IFN-γ in the liver (21). In HBV infection, IFN-γ produced by antigen-specific cytotoxic T lymphocytes (CTLs) in the liver has been shown to recruit neutrophils, macrophages, NK cells, and NKT cells. NK, NKT, and CD4+ cells express Fas ligand (FasL), a glycoprotein that binds to Fas-positive cells, such as hepatocytes, and induces cell death (18,24). IFN-γ also has noncytopathic antiviral activity, which is important for HBV and HCV clearance (8,27). Thus, the increased IFN-γ production in patients with acute hepatitis E that we observed may be important in the pathogenesis of liver injury in these patients.
There was no expansion either of the total CD8+ population or of the HEV ORF2-specific CD8+/CD69+ cells that produced IFN-γ, TNF-α, or IL-4. The role of CD8+ cytotoxic cells in the pathogenesis and viral clearance in infections with hepatitis A virus, HBV, and HCV has been well documented. (9) However, unlike in these infections, in which expansion of antigen-specific CD8+ cells is detected in the peripheral blood (28,29), no increase in HEV-specific cytokine-producing CD8+ cells was found in patients with hepatitis E. This does not entirely rule out a role for cytotoxic T cells in this disease because the liver is known to harbor a disproportionately large number of CD8+ cells. Our failure to detect HEV-specific CD8+ cells in peripheral blood may be a consequence of their preferential sequestration in the liver.
One methodological issue may need specific consideration in relation to the current study. We used stimulation with exogenous recombinant HEV ORF2 protein to measure CD8+ cell responses. We therefore assessed activation of CD8+ cells through cross-presentation of HEV antigens and not through the conventional endogenous route of antigen presentation used by proteins synthesized by the virus-infected cells. Cross-presentation, that is, the processing of exogenous antigens by antigen-presenting cells (APCs) for presentation along with major histocompatibility complex class I molecules to the CD8+ cells, has been described in infections caused by viruses that do not directly infect APCs (23). Sinusoidal endothelial cells of the liver have been shown to efficiently cross-present exogenous antigens; thus, cross-presentation may be particularly relevant in the case of antigens of hepatotropic viruses (13). There is no evidence to suggest infection of nonhepatocyte cells by HEV, and hence we have no reason to suspect that failure of cross-presentation could have occurred in our experiments. Further studies will be needed to assess the relevance of this mechanism in vivo. In vitro assessment of antigen presentation to CD8+ cells by the classical endogenous pathway will need the use of 9- to 15 amino acid-long peptides, which can directly bind to the peptide groove of the HLA molecule.
We also found a decrease in the proportion of IFN-γ- and TNF-α-producing CD3+ cells in response to activation with PMA and ionomycin. Because these compounds are potent non-antigen-specific T cell stimulators, this observation suggests that there may be an inherent defect in the activation of T cells in HEV-infected individuals.
As mentioned previously, our data do not exclude the occurrence of antigen-specific responses altogether, because immune events during HEV infection may occur predominantly in the local milieu of the liver and hence be undetectable in the peripheral blood. In fact, the appearance of a strong anti-HEV antibody response early during the course of HEV infection indicates that T cells are able to provide adequate help for antibody production, providing indirect evidence of the activation of HEV-specific T cells. Clarification of this issue would need studies on immune events in liver tissue obtained from patients with acute hepatitis E; however, ethical considerations preclude liver biopsy in these patients.
Interpretation of our results may be limited by the nature of the control subjects studied. HEV infection is highly endemic in India. We selected healthy subjects who tested negative for anti-HEV IgG, assuming that lack of this serological marker reflects lack of exposure to HEV. However, absence of this antibody may be an imperfect marker for this purpose because anti-HEV IgG is known to wane over time and become undetectable in nearly 50% of those infected 14 yr previously (12). However, in the absence of a better marker, we had no option but to rely on it.
In conclusion, our data suggest that there is no detectable HEV ORF2-specific immune activation of CD4+ and CD8+ cells in the peripheral blood of HEV-infected patients during the acute phase of the disease. Increased IFN-γ production in the absence of specific CD8+ cell responses suggests that nonspecific innate mechanisms involving NK or NKT cells may play a significant role in the pathogenesis of hepatitis E. These innate mechanisms as well as the direct cytopathic effect of the virus need further investigation to provide better insights into the mechanism of liver cell injury during HEV infection.
ACKNOWLEDGMENT
This work was funded by an International Senior Research Fellowship in Biomedical Sciences (to S.J.) from the Welcome Trust, UK.
REFERENCES
- 1.Aggarwal R, Krawczynski K. Hepatitis E: An overview and recent advances in clinical and laboratory research. J Gastroenterol Hepatol. 2000;15:9–20. doi: 10.1046/j.1440-1746.2000.02006.x. [DOI] [PubMed] [Google Scholar]
- 2.Aggarwal R, Shukla R, Jameel S, Agrawal S, Puri P, Gupta VK, Patil AP, Naik S. T-cell epitope mapping of ORF2 and ORF3 proteins of human hepatitis E virus. J Viral Hepat. 2007 doi: 10.1111/j.1365-2893.2006.00796.x. in press. doi: 10.111lj.1365-2893. 2006.00796.x. [DOI] [PMC free article] [PubMed] [Google Scholar]
- 3.Arora NK, Nanda SK, Gulati S, Ansari IH, Chawla YK, Gupta SD, Panda SK. Acute viral hepatitis types E, A, and B singly and in combination in acute liver failure in children in north India. J Med Virol. 1996;48:215–221. doi: 10.1002/(SICI)1096-9071(199603)48:3<215::AID-JMV1>3.0.CO;2-B. [DOI] [PubMed] [Google Scholar]
- 4.Bradley DW, Krawczynski K, Cook EH, Jr, McCaustland KA, Humphrey CD, Spelbring JE, Myint H, Maynard JE. Enterically transmitted non-A, non-B hepatitis: Serial passage of disease in cynomolgus macaques and tamarins and recovery of disease-associated 27- to 34-nm viruslike particles. Proc Natl Acad Sci USA. 1987;84:6277–6281. doi: 10.1073/pnas.84.17.6277. [DOI] [PMC free article] [PubMed] [Google Scholar]
- 5.Doherty DG, O’Farrelley C. Lymphoid repertoires in healthy liver. In: Gershwin ME, Vierling JM, Manns MN, editors. Liver Immunology. Philadelphia: Hanley & Belfus; 2003. pp. 31–46. [Google Scholar]
- 6.Exley MA, Koziel MJ. To be or not to be NKT: Natural killer T cells in the liver. Hepatology. 2004;40:1033–1040. doi: 10.1002/hep.20433. [DOI] [PubMed] [Google Scholar]
- 7.Farci P, Alter HJ, Govindarajan S, Wong DC, Engle R, Lesniewski RR, Mushahwar IK, Desai SM, Miller RH, Ogata N, Purcell RH. Lack of protective immunity against reinfection with hepatitis C virus. Science. 1992;258:135–140. doi: 10.1126/science.1279801. [DOI] [PubMed] [Google Scholar]
- 8.Guidotti LG, Chisari FV. Noncytolytic control of viral infections by the innate and adaptive immune response. Annu Rev Immunol. 2001;19:65–91. doi: 10.1146/annurev.immunol.19.1.65. [DOI] [PubMed] [Google Scholar]
- 9.Guidotti LG, Chisari FV. Immunobiology and pathogenesis of viral hepatitis. Annu Rev Pathol Mech Dis. 2006;1:23–61. doi: 10.1146/annurev.pathol.1.110304.100230. [DOI] [PubMed] [Google Scholar]
- 10.Khuroo MS. Study of an epidemic of non-A, non-B hepatitis: Possibility of another human hepatitis virus distinct from post-transfusion non-A, non-B type. Am J Med. 1980;68:818–823. doi: 10.1016/0002-9343(80)90200-4. [DOI] [PubMed] [Google Scholar]
- 11.Khuroo MS, Teli RT, Skidmore S, Sofi MA, Khuroo HI. Incidence and severity of viral hepatitis in pregnancy. Am J Med. 1981;70:252–255. doi: 10.1016/0002-9343(81)90758-0. [DOI] [PubMed] [Google Scholar]
- 12.Khuroo MS, Kamili S, Dar MY, Moecklii R, Jameel S. Hepatitis E and long-term antibody status. Lancet. 1993;341:1355. [PubMed] [Google Scholar]
- 13.Knolle PA, Gerken G, Loser E, Dienes HP, Gantner F, Tiegs G, Meyer zum Buschenfelde KH, Lohse AW. Role of sinusoidal endothelial cells of the liver in concanavalin A-induced hepatic injury in mice. Hepatology. 1996;24:824–829. doi: 10.1002/hep.510240413. [DOI] [PubMed] [Google Scholar]
- 14.Krawczynski K, Aggarwal R, Kamili S. Hepatitis E. Infect Dis Clin North Am. 2000;14:669–687. doi: 10.1016/s0891-5520(05)70126-4. [DOI] [PubMed] [Google Scholar]
- 15.Murray K, Bruce SA, Hinnen A, Wingfield P, van Erd PM, de Reus A, Schellekens H. Hepatitis B virus antigens made in microbial cells immunise against viral infection. EMBO J. 1984;3:645–650. doi: 10.1002/j.1460-2075.1984.tb01861.x. [DOI] [PMC free article] [PubMed] [Google Scholar]
- 16.Naik S, Aggarwal R, Naik SR, Dwivedi S, Talwar S, Tyagi SK, Duhan SD, Coursaget P. Evidence for activation of cellular immune responses in patients with acute hepatitis E. Indian. J Gastroenterol. 2002;21:149–152. [PubMed] [Google Scholar]
- 17.Naik SR, Aggarwal R, Salunke PN, Mehrotra NN. A large waterborne viral hepatitis E epidemic in Kanpur, India. Bull World Health Organ. 1992;70:597–604. [PMC free article] [PubMed] [Google Scholar]
- 18.Ogasawara J, Watanabe-Fukunaga R, Adachi M, Matsuzawa A, Kasugai T, Kitamura Y, Itoh N, Suda T, Nagata S. Lethal effect of the anti-Fas antibody in mice. Nature. 1993;364:806–809. doi: 10.1038/364806a0. [DOI] [PubMed] [Google Scholar]
- 19.Pal R, Aggarwal R, Naik SR, Das V, Das S, Naik S. Immunological alterations in pregnant women with acute hepatitis E. J Gastroenterol Hepatol. 2005;20:1094–1101. doi: 10.1111/j.1440-1746.2005.03875.x. [DOI] [PubMed] [Google Scholar]
- 20.Pringle CR. Virus taxonomy: San Diego 1998. Arch Virol. 1998;143:1449–1459. doi: 10.1007/s007050050389. [DOI] [PubMed] [Google Scholar]
- 21.Rehermann B. Intrahepatic T cells. In: Gershwin ME, Vierling JM, Manns MN, editors. Liver Immunology. Philadelphia: Hanley & Belfus; 2003. pp. 47–58. [Google Scholar]
- 22.Schofield DJ, Glamann J, Emerson SU, Purcell RH. Identification by phage display and characterization of two neutralizing chimpanzee monoclonal antibodies to the hepatitis E virus capsid protein. J Virol. 2000;74:5548–5555. doi: 10.1128/jvi.74.12.5548-5555.2000. [DOI] [PMC free article] [PubMed] [Google Scholar]
- 23.Sigal LJ, Crotty S, Andino R, Rock KL. Cytotoxic T-cell immunity to virus-infected non-haematopoietic cells requires presentation of exogenous antigens. Nature. 1999;398:77–80. doi: 10.1038/18038. [DOI] [PubMed] [Google Scholar]
- 24.Smyth MJ, Cretney E, Kelly JM, Westwood JA, Street SE, Yagita H, Takeda K, van Dommelen SL, Degli-Esposti MA, Hayakawa Y. Activation of NK cell cytoxicity. Mol Immunol. 2005;42:501–510. doi: 10.1016/j.molimm.2004.07.034. [DOI] [PubMed] [Google Scholar]
- 25.Szomolanyi-Tsuda E, Brehm MA, Welsh RM. Acquired immunity against viral infections. In: Kaufmann SHE, Sher A, Ahmed R, editors. Immunology of Infectious Diseases. Washington, D.C.: ASM Press; 2002. pp. 247–265. [Google Scholar]
- 26.Tam AW, Smith MM, Guerra ME, Huang CC, Bradley DW, Fry KE, Reyes GR. Hepatitis E virus (HEV): Molecular cloning and sequencing of the full-length viral genome. Virology. 1991;185:120–131. doi: 10.1016/0042-6822(91)90760-9. [DOI] [PMC free article] [PubMed] [Google Scholar]
- 27.Thimme R, Oldach D, Chang KM, Steiger C, Ray SC, Chisari FV. Determinants of viral clearance and persistence during acute hepatitis C virus infection. J Exp Med. 2001;194:1395–1406. doi: 10.1084/jem.194.10.1395. [DOI] [PMC free article] [PubMed] [Google Scholar]
- 28.Thimme R, Bukh J, Spangenberg HC, Wieland S, Pemberton J, Steiger C, Govindarajan S, Purcell RH, Chisari FV. Viral and immunological determinants of hepatitis C virus clearance, persistence and disease. Proc Natl Acad Sci USA. 2002;99:15661–15668. doi: 10.1073/pnas.202608299. [DOI] [PMC free article] [PubMed] [Google Scholar]
- 29.Thimme R, Wieland S, Steiger C, Ghrayeb J, Reimann KA, Purcell RH, Chisari FV. CD8+ T cells mediate viral clearance and disease pathogenesis during acute hepatitis B virus infection. J Virol. 2003;77:68–76. doi: 10.1128/JVI.77.1.68-76.2003. [DOI] [PMC free article] [PubMed] [Google Scholar]
- 30.Vishwanathan R. Infectious hepatitis in Delhi (1955-56): A critical study: epidemiology. Indian J Med Res. 1957;45(Suppl 1):1–29. [Google Scholar]
- 31.Zafrullah M, Ozdener MH, Panda SK, Jameel S. The ORF3 protein of hepatitis E virus is a phosphoprotein that associates with the cytoskeleton. J Virol. 1997;71:9045–9053. doi: 10.1128/jvi.71.12.9045-9053.1997. [DOI] [PMC free article] [PubMed] [Google Scholar]
- 32.Zafrullah M, Khursheed Z, Yadav S, Sahgal D, Jameel S, Ahmad F. Acidic pH enhances structure and structural stability of the capsid protein of hepatitis E virus. Biochem Biophys Res Commun. 2004;313:67–73. doi: 10.1016/j.bbrc.2003.11.088. [DOI] [PubMed] [Google Scholar]