

Abstract
Natural consonant vowel syllables are reliably classified by most listeners as voiced or voiceless. However, our previous research (Liederman et al., 2005) suggests that among synthetic stimuli varying systematically in voice onset time (VOT), syllables that are classified reliably as voiceless are nonetheless perceived differently within and between listeners. This perceptual ambiguity was measured by variation in the accuracy of matching two identical stimuli presented in rapid succession. In the current experiment, we used magnetoencephalography (MEG) to examine the differential contribution of objective (i.e., VOT) and subjective (i.e., perceptual ambiguity) acoustic features on speech processing. Distributed source models estimated cortical activation within two regions of interest in the superior temporal gyrus (STG) and one in the inferior frontal gyrus. These regions were differentially modulated by VOT and perceptual ambiguity. Ambiguity strongly influenced lateralization of activation; however, the influence on lateralization was different in the anterior and middle/posterior portions of the STG. The influence of ambiguity on the relative amplitude of activity in the right and left anterior STG activity depended on VOT, whereas that of middle/posterior portions of the STG did not. These data support the idea that early cortical responses are bilaterally distributed whereas late processes are lateralized to the dominant hemisphere and support a “how/what” dual-stream auditory model. This study helps to clarify the role of the anterior STG, especially in the right hemisphere, in syllable perception. Moreover, our results demonstrate that both objective phonological and subjective perceptual characteristics of syllables independently modulate spatiotemporal patterns of cortical activation.
Keywords: laterality, magnetoencephalography, syllable perception, voice-onset time
Introduction
For most individuals, the acoustic signal of speech is accurately decoded into intelligible language regardless of the volume, accent, dynamic range or tonal quality of the speaker’s voice. During the process of speech perception the brain automatically extracts phonological features, such as syllables. Such speech features are acoustically complex, requiring processing at many cortical levels including bottom-up sensory and top-down higher order language areas (Bonte et al., 2006). Intracranial recordings, functional magnetic resonance imaging (fMRI), positron emission tomography (PET) and magnetoencephalography (MEG) studies suggest that cortical areas important for syllable perception include areas within the frontal and parietal cortices, the middle temporal gyrus, and regions in the superior temporal gyrus (STG) that lie anterior and posterior to the primary auditory cortices, including the planum polare (PP) and Brodmann’s area (BA) 22 (Ahveninen et al., 2006; Scott and Wise, 2004; Uppenkamp et al., 2006; Guenther et al., 2004).
Consonant-vowel syllables are defined by objective acoustic features, such as voice-onset time (VOT). VOT is defined as the interval between the release-burst of the initial stop consonant and the onset of voicing of the vowel. Although sublexical building blocks of speech, such as syllables, are defined by acoustically by continuous parameters such as VOT, they are perceived in discrete categories. Categorical perception was first described by Liberman et al. (1957) when studying the perception of stop-consonants that differed in place of articulation and later when studying the perception of syllables that systematically differed in VOT (Liberman et al., 1958). Liberman et al. (1958) found a steep labeling curve between syllable categories similar to that depicted in Fig 1B. A label for a particular syllable is consistent across a range of VOT values although we recently demonstrated that the perceived ambiguity of stimuli within a syllable label depends on distance on VOT from the syllable boundary (Liederman et al., 2005). In general, consonants in syllables with relatively short VOT values are perceived as voiced (e.g., /b/, /d/, /g/) while consonants in a syllables with relatively long VOT values are perceived as unvoiced or voiceless (e.g., /p/, /t/, /k/). For example, VOT is short for the voiced /ba/ as compared with the unvoiced /pa/ (Fig. 1B).
Figure 1.
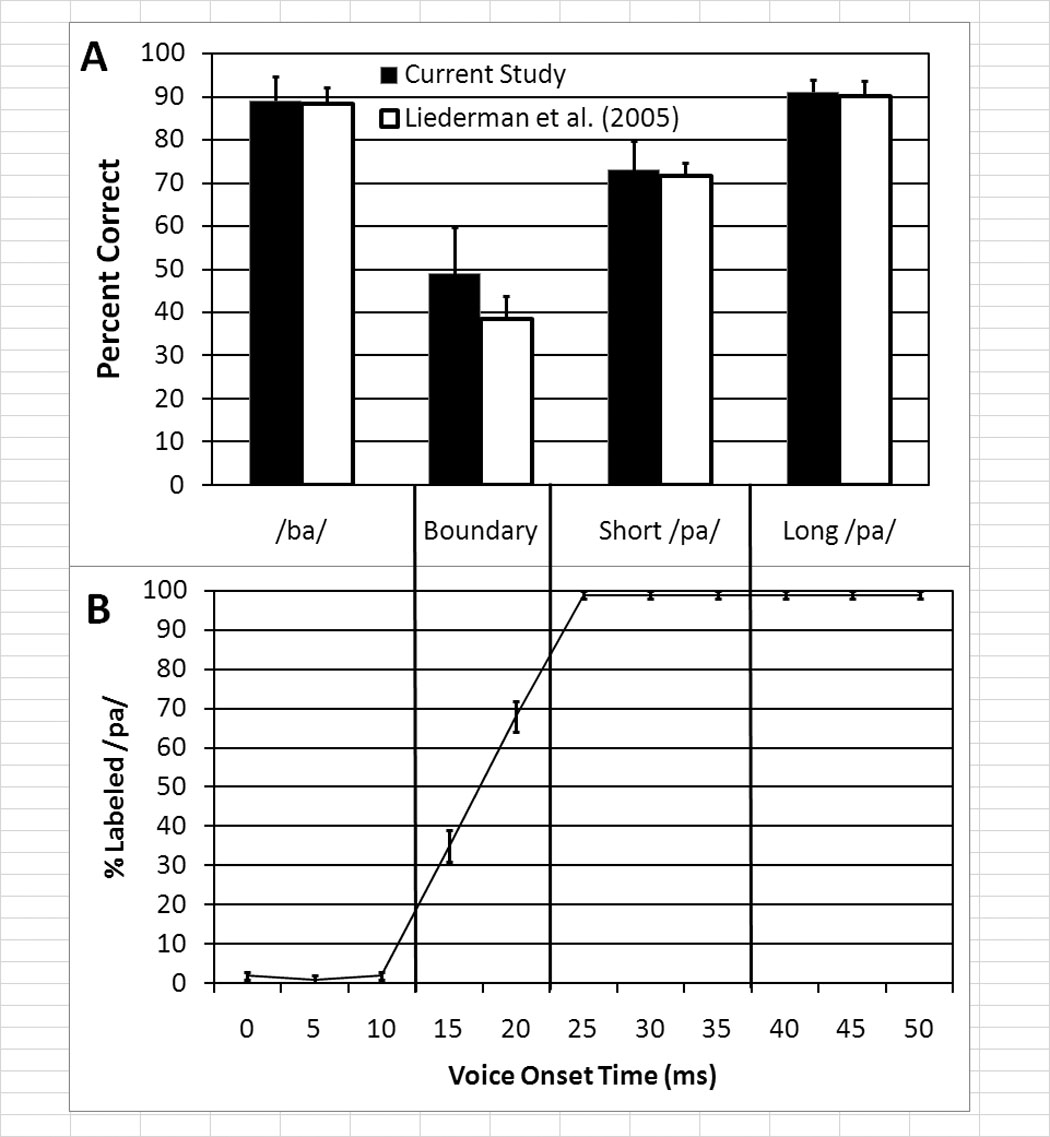
Perceptual characteristics of the consonant-vowel (CV) syllable continuum used in this study. (A) The bar graph depicts the percentage of time (mean with standard error bars) sequentially presented identical stimuli were correctly identified as matching during the discrimination task for the four VOT sectors defined in the current study. Data for the participants in the current study and participants in Experiment 3 from Liederman et al. (2005) are depicted. (B) The line graphs represent the percentage of trials that each VOT stimulus was categorized as sounding like the syllable /pa/. Data from Liederman et al (2005) in which 51 participants categorized all of the VOT stimuli in this continuum. The data shown are an average of the categorization before and after a VOT discrimination task. Syllables with shorter voice-onset times (VOTs; i.e., between 0ms and 10ms) were almost invariably perceived as a /ba/ while syllable stimuli whereas longer VOTs (25ms–50ms) were perceived as a /pa/. Stimuli with VOTs between the two phonemic categories (i.e., VOTs of 15 and 20 ms) represent a boundary region that is ambiguous.
Substantial variability in brain activation has been reported in neuroimaging studies focusing on the processing of the sublexical building blocks of speech. Such variability may be partly due to differences in the stimulus presentation paradigm, behavioral engagement of the participant, and the type of speech stimuli presented (Hertich et al., 2002; Poeppel, et al. 1996; Shtyrov et al., 2005). However, another mitigating factor is likely to be related to the perceived ambiguity of the stimuli for any particular individual. For example, although many people might unequivocally categorize a stimulus similarly, the particular perception is most certainly different for each individual (Papanicolaou, 2007). Assuming that each person represents a stimulus category with exemplars they have developed by their own experience, a stimulus may be more or less consistent with a particular person’s exemplar. This will cause the stimulus to be perceived as more or less ambiguous to one person as compared to another. In addition, as perceptual ability varies between people, some individuals will perceive a particular set of stimuli more or less ambiguously than others.
This perceptual ambiguity of speech stimuli has not been taken into account in previous neuroimaging studies. Indeed, most investigators assume that consonant-vowel syllables are almost unequivocally categorized as a particular sublexical language percept (e.g., /ba/ or /pa/) within a particular range of VOT values. However, we recently demonstrated that perceptual ambiguity may systematically vary within a single syllable depending on VOT. For example, we demonstrated that for the range of VOT values that were uniformly categorized as /pa/, stimuli with relatively shorter VOT values were perceived as more ambiguous than stimuli with relatively longer VOT values (Liederman et al., 2005). We conjectured that this finding was related to the proximity of the stimuli to the syllable category boundary. Using a discrimination paradigm we demonstrated that the same listeners who uniformly categorized six stimuli with different VOTs as /pa/ were less accurate at identifying matches between identical pairs of stimuli with the shortest VOTs as compared to the stimuli with the longest VOTs (Fig. 1A). This permitted us to define two specific sectors of the VOT continuum within the /pa/ syllable category: the “short /pa/” sector which was perceived more ambiguously than the “long /pa/” sector. We also found a context effect in discrimination performance that supported this notion of perceptual ambiguity (Liederman et al., 2005). Furthermore, unpublished goodness ratings collected in Dr. Liederman’s laboratory suggest that stimuli from the “long /pa/” sector are perceived with significantly better goodness than stimuli from the short /pa/ sector, further confirming the difference in the ambiguity of these equally categorized syllable stimuli. Our VOT continuum also included two other sectors which varied in perceptual ambiguity: the /ba/ sector and the boundary sector between /ba/ and /pa/. The ‘boundary’ sector is considered the region with maximal ambiguity, since participants inconsistently perceive the stimuli within this sector as belonging to one of the adjacent syllable categories.
The relationship between VOT and perceptual ambiguity is complex. For example, even though the difference in VOT between the boundary and short /pa/ sectors is equal to the difference in VOT between the short /pa/ and long /pa/ sectors, the change in perceptual ambiguity is much different, being large for the former but small for the latter. In addition, the relationship between VOT and perceptual ambiguity varies among individuals. In this study, we examine the influence of perceptual ambiguity on spatiotemporal patterns of cortical activation. To dissociate the effect of VOT per se from the effect of perceptual ambiguity we used linear mixed-modeling to statistically evaluate the influence of VOT and perceptual ambiguity on specific regions of interest. Both VOT and ambiguity were entered as fixed effects into the mixed-model simultaneously, allowing statistical analysis to account for the influence of each independent of the other. We then constructed functional contrast maps to visualize the significant effects related to VOT and perceptual ambiguity separately.
Recently, investigators have proposed the existence of dual processing streams in the auditory system similar to the ventral “what” and dorsal “where” streams defined for the visual system (Rauschecker and Tian, 2000). Some have argued that the dorsal stream in the auditory system represents a “how” system, being predominantly involved in action planning rather than a “where” system involved in spatial perception (Hickok et al., 2003). The cortical structures implicated in the dorsal auditory stream have been suggested to be strongly left lateralized and include the posterior dorsal frontal and temporal lobes and the parietal operculum, whereas the cortical structures implicated in the ventral auditory stream have been suggested to be more bilaterally distributed and include the middle and superior temporal lobes and the posterior ventral frontal lobe (Buchsbaum et al., 2005; Hickok and Poeppel, 2007).
By means of MEG, areas in the anterior portion of the left temporal gyrus have been identified as important and specific for syllable recognition and discrimination (Ahveninen et al., 2006). Similar areas have been found to correlate with the intelligibility of systematically distorted speech (Davis and Johnsrude, 2003). Given that such areas are important components of the ventral “what” auditory stream (Buchsbaum et al., 2005; Hickok and Poeppel, 2007), we hypothesize that such areas will be most markedly influenced by the perceptual ambiguity of our syllable stimulus. Due to the importance of the left anterior STG (Cohen et al., 2004; Price et al., 2005) in auditory language, we expect that this influence will be manifested as a shift in laterality in the ventral “what” auditory stream to the left hemisphere.
Using MEG sensor waveform analysis and equivalent dipole modeling, we recently demonstrated that VOT linearly modulated the latency and amplitude of the M100 response (Frye et al., 2007). Our analysis supported the idea that multiple simultaneous sources were responsible for the neuromagnetic response to syllable stimuli. In the present paper we used a distributed source model, the minimum-norm estimate, to investigate whether multiple cortical areas are differentially modulated by the acoustic feature of VOT as well as the perceptual ambiguity of the stimulus. The time-course and lateralization of cortical activation in three regions of interest (anterior STG, middle/posterior STG and inferior frontal gyrus (IFG)) were selected to examine how the activity in the ventral and dorsal auditory streams are influenced by both objective phonological (i.e., VOT) and subjective perceptual (i.e., ambiguity) characteristics of syllables.
Materials and Methods
Participants
This study was conducted in accordance with the Declaration of Helsinki and the Institutional Review Boards at the authors’ affiliated institutions. A total of ten right handed English speaking young adults participated in the MEG recording session after informed consent. Participants were screened for a history of psychiatric, neurologic, learning and hearing difficulties and had no contraindications for MEG or MRI. Participants were paid $20/hour. The signal-to-noise ratio for data from two of the participants was unacceptable, resulting in the exclusion of these participants from further analysis. The mean (SE) age of the remaining 8 participants was 21.6 years (SE 1.5); 4 of them were male.
Auditory Syllable Stimuli
In English, the syllables /ba/ and /pa/ differ only in VOT. This contrast represents a meaningful difference as can be seen in the minimal pair pad - bad. Semantically, these two lexical units carry completely different information that is signaled by the phonetic difference of VOT. An eleven-step VOT continuum was adapted from the University of Nebraska Speech Perception Laboratory Resource (http://hush.unl.edu/LabResources.html). The first three formant frequencies were 660, 1100, and 2500 Hz in the steady state of the vowel with a transition from the consonant to the vowel of approximately 30ms. Stimuli were 170ms in duration and VOT was measured from the end of the 5ms burst of the consonant to the beginning of a full pitch pulse of the vowel. The first token in the continuum had a VOT of 0 ms; and each syllable along the VOT continuum represented a 5ms VOT increment. In a previous report we showed that the first three tokens on the continuum (VOT 0–10ms) were consistently categorized as the syllable /ba/ while the last six tokens on the continuum (VOT 25–50ms) were consistently categorized as the syllable /pa/; tokens between these two areas were inconsistently categorized as either /ba/ or /pa/ (Liederman et al., 2005; see Fig. 1B).
Liederman et al. (2005) demonstrated that the six tokens categorized as /pa/ could be divided into two distinct sectors on the basis of discrimination data. These sectors were defined by their proximity to the /ba/-/pa/ category boundary. Among other things, it was found that the accuracy of recognizing two sequentially presented identical tokens as the same was significantly lower for /pa/ tokens closer to the /ba/-/pa/ boundary that /pa/ tokens further from the /ba/-/pa/ boundary.
Behavioral Task
The participants performed a forced-choice syllable discrimination task during the MEG recording session. The stimulus presentation was controlled by Presentation™ version 0.53 (Neurobehavioral Systems, Albany, CA). Participants were required to make same-different judgments between tokens with very close VOTs. Two consecutive tokens, separated by a 10ms interstimulus interval, were sequentially presented on each trial. Tokens were identical on half of the trials. The participant responded using an optical response pad by lifting the right index or middle finger to indicate whether or not the two tokens were identical. The next trial was presented three seconds after the participant’s response. All tokens and combinations of tokens were presented an equal number of times; the order was balanced across subjects.
Individual Differences in Perceptual Ambiguity
Similar to Liederman et al. (2005) we derived a measure of perceptual ambiguity for each VOT sector from each individual’s performance during the MEG recording by calculating the accuracy of correctly detecting that the two successive stimuli matched. It should be noted that a signal detection paradigm was considered for computing a d’ performance measure. However, such an approach was considered problematic for several reasons. First, ‘similar’ and ‘different’ trials were not comparable to the two distributions, i.e., signal and signal+noise, proposed by classical signal detection theory. Second, ‘different’ trials were not all ‘different’ in the same way since responses on ‘different’ trials depended on several complex factors, including whether the two stimuli were derived from the same VOT sector and whether the VOT of the first stimulus was higher or lower that the VOT of the second stimulus. Third, we believed that the performance measure in this experiment should be identical to our previous work.
Stimulus Presentation System
Auditory stimuli, stored as 8-bit monaural 22kHz wav files, were amplified to approximately 70dB and played through ER30 (Etymotics Research, Inc) earphones. The sound produced by the ER30 earphones was transmitted to the ER13 Horn Foam eartips (Etymotics Research, Inc) through hollow tubes. The frequency response of the system was flat within the normal speech range and the magnetic field artifact from the earphones was insignificant. The delay and jitter between the onset of the stimulus trigger and the auditory stimulus was 22ms and 8ms, respectively. All latency values were corrected for the delay.
Magnetoencephalography (MEG) Data Acquisition
MEG recordings were performed at the Massachusetts General Hospital Athinoula A. Martinos Center for Biomedical Imaging using a whole-head VectorView™ system (Elekta Neuromag Oy, Finland) inside a high performance magnetically-shielded room (Cohen, et al. 2002). The device has 306 SQUID (superconducting quantum interference device) sensors (204 planar gradiometers and 102 magnetometers) in a helmet-shaped array. Signals were filtered at 0.1 – 172 Hz and sampled at 601 Hz. In order to examine the neural activity evoked by the first auditory stimulus, data were extracted from 200ms before, to 180ms after, the onset of the first stimulus. Trials were sorted with respect to the VOT sector of the first auditory stimulus. For each participant at least 160 trials were averaged from each VOT sector. The averaged signals were bandpass filtered between 1.0 and 40.0 Hz.
Four head position indicator coils for determining the relative position of the head and the sensor array were attached to the scalp. The coils’ positions were measured using a low-intensity magnetic field generated by each coil at the start of each run. The location of the head position indicator coils, fiducial points and approximately 50 points outlining the participants’ scalp were recorded using a Polhemus FastTrack 3-D digitizer (Colchester, VT; Hämäläinen, et al. 1993) prior to the MEG recording to facilitate later MRI-MEG alignment. Vertical and horizontal electrooculography (EOG) was recorded to detect blinks and large eye movements. To exclude blinking and other artifacts, epochs with EOG amplitudes exceeding 150 µV or gradiometer signals exceeding 3000 fT/cm were removed. Typically, one or two MEG channels were excluded for each participant due to artifacts. The testing session was divided into eight 10 minute runs with each run containing approximately 180 trials for most participants, Runs were separated by three-minute intervals.
Magnetic Resonance Imaging (MRI)
Two sets of structural MR images were acquired for each participant using a 1.5T Siemens Sonata scanner (Malvern, PA) with a high-resolution 3-D T1-weighted magnetization-prepared 180 degrees radio-frequency pulses and rapid gradient-echo (MP-RAGE) sequence optimized for gray-white matter contrast differentiation. The two sets of scans were registered and averaged. The cortical white matter was segmented and the border between gray and white matter was tessellated, providing a representation of the cortical surface with ~150,000 vertices per hemisphere (Fischl et al., 2001). The folded tessellated surface was then “inflated” in order to unfold cortical sulci, thereby providing a convenient format for visualizing cortical activation patterns (Fischl et al., 1999).
MEG Source Current Estimation
The cortical currents underlying the measured MEG signals were estimated using a distributed source model, the ℓ2 minimum-norm estimate (Hämäläinen and Ilmoniemi, 1994). The sources were assumed to be anatomically constrained to the cortical surface reconstructed from the MRI (Dale and Sereno, 1993). The cortical surface representation was decimated to approximately 3000 vertices per hemisphere; thus, neighboring sources were separated by about 5–10 mm. The forward model was produced by calculating the signal expected at each MEG sensor from a source of unit amplitude at each vertex using the boundary element method (Hämäläinen and Sarvas, 1989). To reduce the sensitivity of the solution to small errors in the alignment between the MRI and MEG, the sources were not assumed to be strictly perpendicular to the cortical surface, but instead a small loose orientation parameter value of 0.1 was used (Lin et al., 2006a). Depth weighting was incorporated into the minimum-norm solution to reduce the bias of the solution towards superficial sources (Lin et al., 2006b). An estimate of cortical current at each source was then calculated every 1.6ms.
Dynamic statistical parameter maps (dSPM) were calculated to produce functional maps of cortical activity (Dale et al., 2000). The dSPMs are produced by normalizing the current estimate at each source for noise sensitivity. The dSPM values calculated without an orientation constraint have values that are F-distributed with 3 and n degrees of freedom (DOF) whereas sources calculated with a strict perpendicular orientation are F-distributed with 1 and n DOF (Dale et al., 2000). Since we used a partial orientation constraint (Lin et al., 2006a), the source values are expected to be F-distributed with numerator DOF between 1 and 2, with a conservative estimate being a DOF of 1. Since the square root of a 1 and n DOF F-distribution is a t-distribution with n DOF, we interpreted the dSPM values with a t-distribution with n DOF.
Since the source variance changes across source locations, direct inferences cannot be drawn regarding estimated source strength and comparisons cannot be made between source strengths at different cortical locations using dSPM values. Thus, we used dSPM values to select sources with significant activation at some time along the time course. The current estimates of these sources were mapped onto the cortical surface. These dSPM masked functional current estimate maps will be referred to as masked functional maps (MFM).
Given dSPM(s,t) as the array of dSPM values for all sources s ε S (S being the set of all modeled dipoles on the cortical surface) at time t ε T (T being all of the time point in the experimental epoch), we define an array of masking values
| (1) |
where Thresh is the dSPM threshold used to create the masking array. This array of Mask values were then used to select the MNE sources from the array MNE(s,t) to produce the array MFM(s,t):
| (2) |
To ensure that equivalent distributions of sources were selected from all participants regardless of individual baseline noise levels, the range of dSPM values was equated across participants by scaling the maximum absolute dSPM value for each participant to the average maximum absolute dSPM value for all participants. The average absolute maximum dSPM activity across all participants was found to be 15.7 (Standard Error = 0.47) while individual participant maximum dSPM values ranged from 12.75 to 18.06. The dSPM threshold was 5.0, which corresponds to a t-value of 5.0 (one-tailed p<0.000001) or a one degree-of-freedom F-value of 25.0.
The ℓ2 minimum-norm typically estimates distributed patterns, even when the true current source is focal (Dale et al., 2000). This spread results in estimated currents in the opposite bank of the sulcus or in the adjacent sulci, but with an orientation opposite to the true current. The M100, the predominant waveform evoked by syllable stimuli within the time course we are examining in the present study, has been found to have a cortical source in the STG (Heschl’s gyrus) that is oriented with an inward current direction (Bonte et al., 2006; Gunji et al., 2001; Shestakova et al., 2004). To reduce the influence of the spread of the sources estimates in the data analysis, we incorporated a directional constraint in the dSPM-based masking of the functional maps. Specifically, only cortical locations with significant inward dSPM values at some point along the time course were selected when producing MFMs. Since we have selected the sources by their maximum inward dSPM value, the significance of source activation at other times may be below threshold and may even be in the opposite direction.
MFMs were averaged across participants to provide a summary of cortical activity. The average activation was depicted on a representative cortical surface onto which the cortical surface for each participant was morphed (Fischl et al., 1999). Each participant’s cortical surface was transformed onto a spherical representation and registered with the representative brain by optimally aligning sulcal and gyral features, resulting in a linear mapping matrix between the two surfaces. For each participant, the cortical current estimate was mapped onto the representative cortical surface and the maps were averaged across participants. Since the exact vertices at which source activity is represented are not consistent across participants, an iterative procedure was used to spatially average activity from neighboring vertices. This procedure is linear and preserves amplitude information. It should also be noted that outward currents were present in some average maps.
Cortical Regions of Interest
Regions of interest (ROIs; see Fig. 2) were defined for: (a) anterior STG (aSTG); (b) middle and posterior STG (mpSTG); (c) inferior frontal gyrus (IFG); and (d) the superior temporal sulcus / middle temporal gyrus (STS/MTG). The STG was divided into two regions: one anterior of Heschl’s gyrus (HG) (aSTG) and the other which included HG and regions posterior to HG (mpSTG). This division was based upon recent MEG data that implicate the area just anterior to HG as sensitive to change in phoneme content (i.e., “what” auditory stream) and the area just posterior to HG as sensitive to change in phoneme location (i.e., “where” auditory steam; Ahveninen et al., 2006). The aSTG ROI was manually defined on each individual participant’s brain by defining the regions along the inferior bank of the Sylvian fissure anterior to HG, extending medial to the circular sulcus, lateral to the crest of the STG gyrus and anterior to the temporal pole. This area corresponded to the definition of the planum polare (PP) by Kim et al. (2000). The mpSTG ROI was similar manually defined as the region along the inferior bank of the Sylvain fissure posterior to the aSTG border and included the temporal operculum and Planum Temporale (PT). The IFG was defined by merging the three (Pars opercularis, Pars orbitalis, Pars triangularis) ROI labeled as IFG by an validated first order anisotropic non-stationary Markov random field model parcellation algorithm that incorporates both global and local position information (Fischl et al., 2004). The STS/MTG was defined in the same manner as the IFG. STS/MTG activity almost exactly paralleled mpSTG activity, suggesting that STS/MTG activity was, in large part, equivalent to activity in mpSTG. Thus, STS/MTG activity was not considered further.
Figure 2.
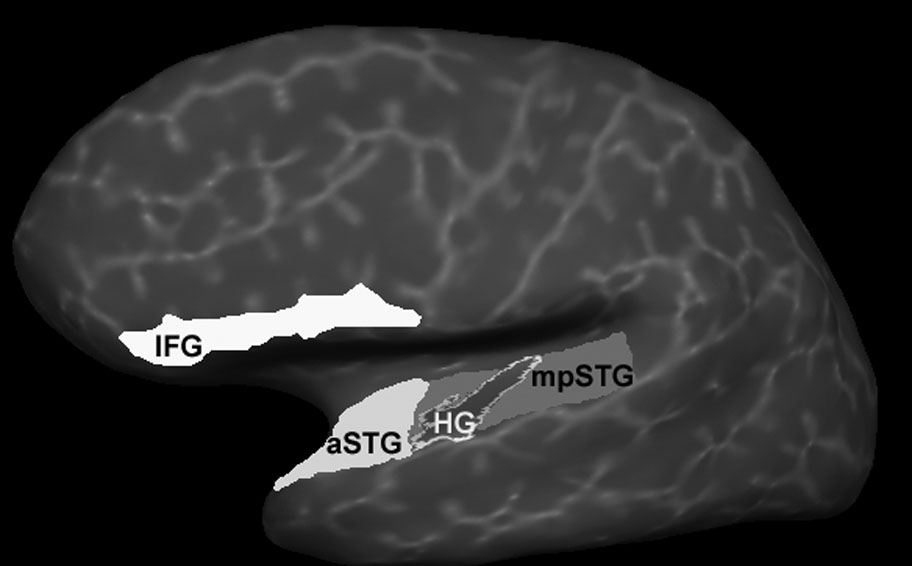
Cortical regions of interest (ROIs). The inferior frontal gyrus (IFG) and the anterior superior temporal gyrus (aSTG) are highlighted in white, the middle/posterior superior temporal gyrus is highlighted in light gray and Heschl’s gyrus (HG) in dark gray. In our analyses, HG was included as part of the mpSTG ROI. The ROIs are shown on the reconstructed cortical surface of one subject (lateral view of the left hemisphere); the surface has been inflated for better visualization of activity within sulci.
MEG Source Waveform Analysis
In order to quantitatively analyze the effects of hemisphere, VOT and perceptual ambiguity, mixed-models were fit to the time course of each ROI (See Appendix A) using the ‘mixed’ procedure of SAS 9.1 (SAS Institute Inc., Cary, NC). The cortical currents from the selected sources (see above) within each ROI were averaged to produce an activation time course. The statistical distribution of the cortical current was slightly skewed (−0.99) and slightly peaked (kurtosis = 1.08), but probability plots demonstrated little variations from normality.
Each mixed-model included two random effects: the participant and the first order parameter of time (linear). Fixed effects included hemisphere, VOT and perceptual ambiguity. Hemisphere and VOT were coded as categorical variables with hemisphere having two levels (left and right) and VOT having four levels, one for each sector. Perceptual ambiguity was modeled as a continuous variable that represented each participant’s performance for each VOT sector. All continuous variables (i.e., ambiguity and time) were centered prior to calculating the model. The model was calculated using the restricted maximum likelihood method.
In order to characterize the waveforms with a small number of model parameters, each waveform was modeled as a polynomial. To choose the correct polynomial order, we estimated the mixed-model, using a maximum likelihood procedure, with only random effects and an increasing number of polynomial time parameters, starting at the 2nd order polynomial and extending to the 5th order polynomial. The log-likelihood for each polynomial model was then subtracted from the previous polynomial model order. This quantity is asymptotically χ2 (df=1) distributed and represents the improvement in the model fit with the addition of the higher polynomial order. The 3rd order polynomial produced the greatest reduction in the log-likelihood for all ROIs [2nd vs. 3rd order: mpSTG χ2 =570.6, p=10−126, aSTG χ2=8.6, p=0.003, IFG χ2=143.2, p=10−33; 3rd vs. 4th order: mpSTG χ2=34.8, p=10−9, aSTG χ2 =3.2, p=0.07, IFG χ2 =20.6, p=10−6; 4th vs. 5th order: mpSTG χ2=154.2, p=10−35, aSTG χ2 =1.4, p=0.23, IFG χ2 =42.8, p=10−11].
Each ROI was analyzed with a separate mixed-model. F-values were calculated for the fixed effects, each polynomial time parameter, and interactions between these effects. To evaluate the influence of a fixed effect or the interaction of fixed effects on the curve shape, the significance of the change in the log-likelihood of the model was assessed using a χ2 distribution when the interaction of the fixed effect(s) with the polynomial time parameters were removed. When higher order interactions of the effects of interest with the polynomial time parameters occurred, separate models for each level of the effect were calculated. Reduced models that contained the significant effects but eliminated non-significant effects (unless such effects were dependent on higher order interactions) were used to calculate the parameters used to create the model curves depicted in Fig. 4, Fig. 6 and Fig. 8. Main effects, such as hemisphere, that were significant but did not interact with the polynomial time parameters are not discussed.
Figure 4.
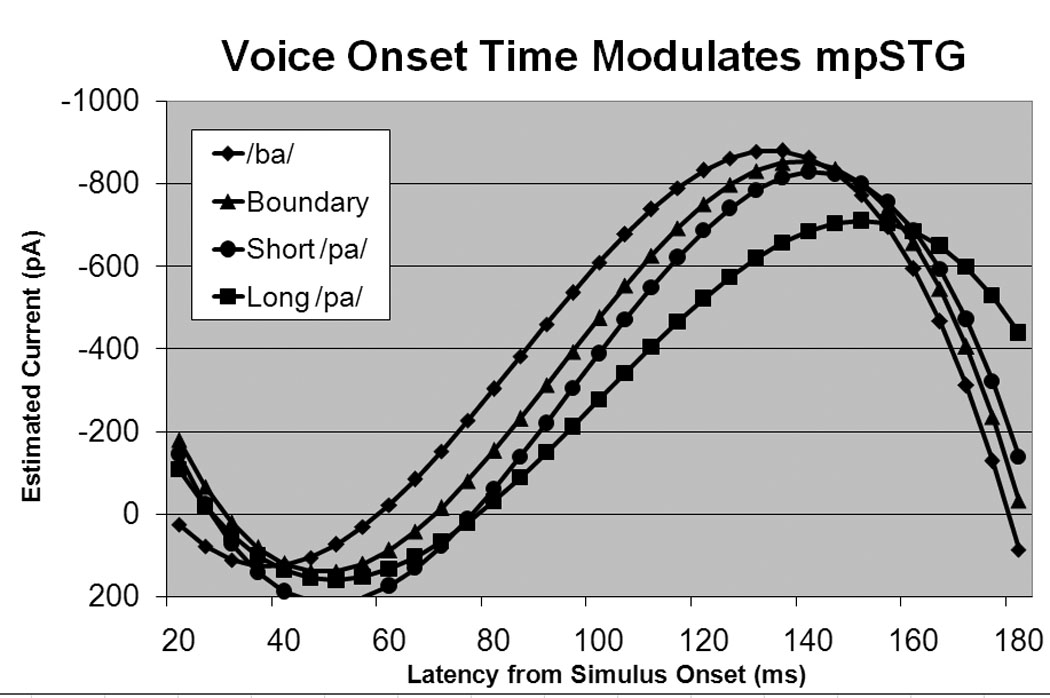
Cortical current waveforms predicted by the mixed-model for mpSTG. The current waveform in mpSTG is modulated by VOT with syllables with shorter VOT values resulting in a waveform with a early, higher peak as compared to syllables with longer VOT values.
Figure 6.
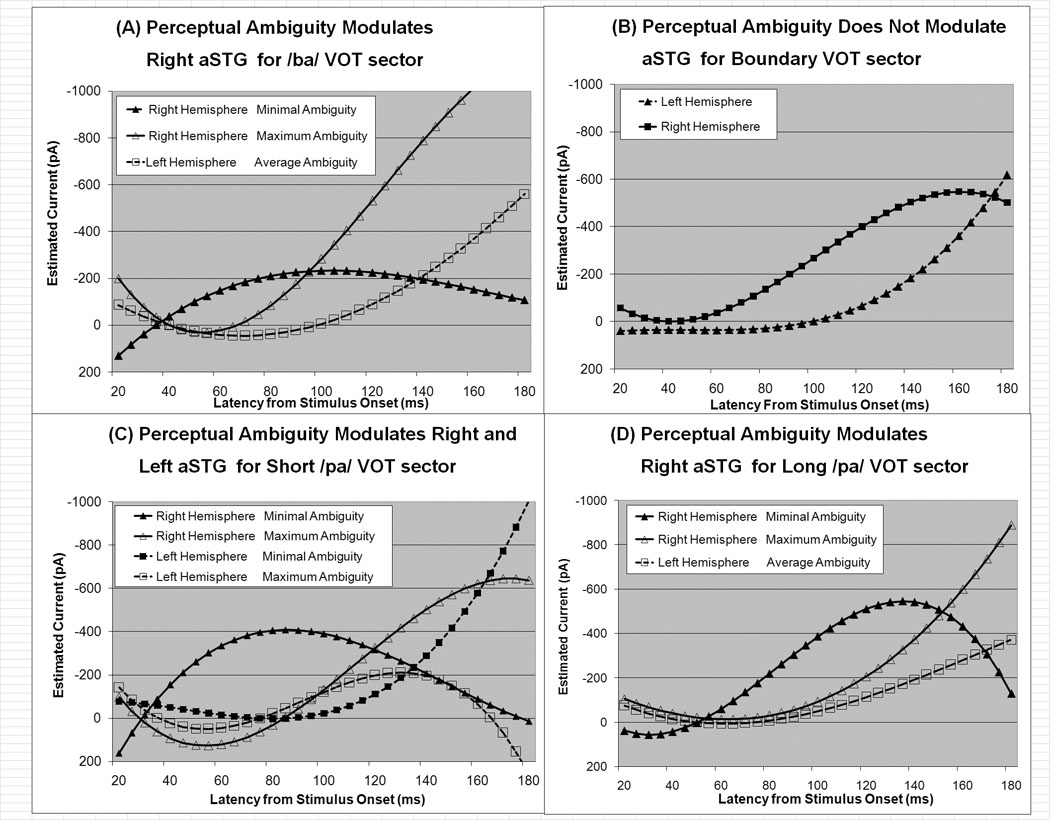
Cortical current waveforms predicted by the mixed-model for the aSTG ROI arranged by VOT sector: (A) /ba/. (B) Boundary, (C) Short /pa/, (D) Long /pa/. Activation curves for the right and left hemispheres are represented by triangles and squares, respectively. If perceptual ambiguity significantly influenced the current time course, two curves are provided: one for activation under conditions of maximum observed perceptual ambiguity (hollow symbols) and one for activation under conditions of minimal perceptual ambiguity (filled symbols). If perceptual ambiguity did not significantly influence the current time course, the curve provides a representation of activation under average perceptual ambiguity conditions.
Figure 8.
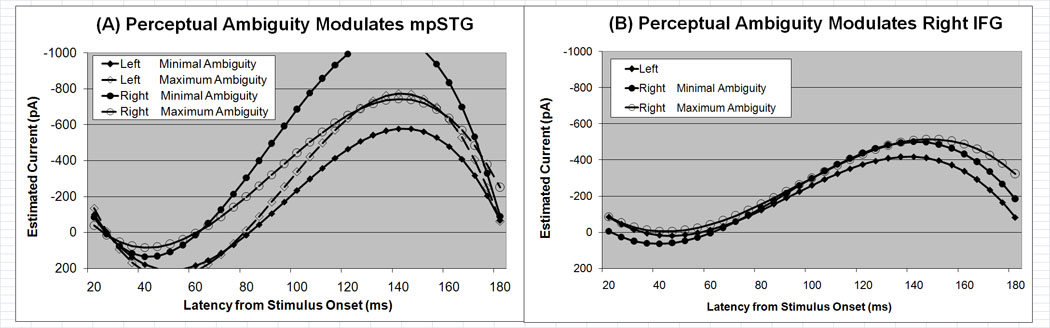
Cortical current waveforms predicted by the mixed-model for mpSTG and IFG ROIs. (A) Perceptual ambiguity modulates the right and left mpSTG current waveforms differently. Higher perceptual ambiguity is associated with more symmetric hemispheric activation in mpSTG whereas lower perceptual ambiguity is associated with an asymmetry in mpSTG activation with activation greater in the right, as compared to the left, mpSTG. (B) The time course of the current waveforms in the left and right IFG are similar. The right, but not the left, IFG waveform is modulated by perceptual ambiguity.
Calculating a goodness-of-fit measure for mixed-models is a complicated issue. The chi-square test for the proposed model can be calculated by comparing whether the initial model is better than no model at all, which it almost always is (and is in this case). To test the overall model fit, one would have to compare the proposed model to a saturated model. However, this is problematic since the estimation of the log-likelihood for the saturated model when using mixed-models that specifically account for individual variation is invalid for individual data. Therefore, deviance, which is twice the log likelihood, is most commonly not used to test overall model fit, but to compare fit between two nested models, which is the approach used in this study (Allison, 2007).
Functional Contrast Maps: Spatiotemporal Depiction of Fixed Effects
To examine the spatiotemporal characteristics of the fixed-effects in the mixed-models, MFMs were contrasted across conditions by weighted averaging. The weighting design was modeled after orthogonal post-hoc comparisons utilized following analysis of variance. Weights were designed so that opposing contrasting conditions summed to zero if they were equal. If the conditions were not equal, the condition with the larger value would predominate. Typically positive and negative weights differentiate two conditions (e.g., 1 for condition #1 and −1 for condition #2). A contrast computation resulting in a positive value indicates that condition #1 is larger than condition #2, while a negative value indicates the opposite. A series of conditions that can be represented along a continuum can also be compared.
To study the change in activity with change in VOT value, weights were assigned to the four VOT sectors in a linear manner: /ba/ 3, boundary 1, short /pa/ −1, long /pa/ −3. These weights produced contrast maps with positive values when cortical activation was related to stimuli with shorter VOT values, negative values when cortical activation was related to stimuli with longer VOT values and zero values for activation common to all stimuli. The linear arrangement of VOT weights minimized any contribution of perceptual ambiguity to the results of the contrast images since: (a) the relationship between VOT and perceptual ambiguity was not linear, (b) the relationship between VOT and perceptual ambiguity was different for each participant, and (c) the linear correlation between these two factors was quite low (r2=0.025).
Since different VOT sectors were associated with different average levels of perceptual ambiguity, contrast maps, and their weights, were created for each VOT sector separately. Weights were calculated by, first, rescaling individual perceptual ambiguity values relative to the group average, second, subtracting individual participants’ perceptual ambiguity values from the group average, and, lastly, dividing by the group range of perceptual ambiguity values (See Table 1). This weighting scheme produced positive values (red) in cortical areas that were more active for participants with lower perceptual ambiguity and negative values (blue) in cortical areas that were more active for participants with higher perceptual ambiguity.
Table 1.
Individual Participant Weights used to Calculate Perceptual ambiguity Functional Contrast Maps
| VOT Sector | ||||
|---|---|---|---|---|
| Participant | /ba/ | Boundary | Short /pa/ | Long /pa/ |
| 1 | 0.227 | 0.687 | 0.594 | 0.338 |
| 2 | 0.227 | 0.687 | 0.594 | 0.264 |
| 3 | 0.164 | −0.201 | 0.217 | 0.153 |
| 4 | 0.060 | −0.313 | −0.406 | 0.042 |
| 5 | 0.164 | −0.313 | −0.228 | −0.032 |
| 6 | −0.773 | −0.313 | −0.406 | −0.662 |
| 7 | −0.065 | −0.060 | −0.361 | −0.181 |
| 8 | −0.003 | −0.179 | −0.006 | 0.079 |
Results
Behavioral Data
Discrimination performance for correctly detecting matching identical stimuli was consistent with our previous behavioral study (Liederman et al., 2005; Fig 1A).
MEG Source Estimates
MFMs for the /ba/ syllable stimuli along with the waveforms for each VOT sector and ROI are presented in Fig. 3. An early outward current in the mpSTG ROI (first map in Fig. 3A) was seen at around 70 ms in the left hemisphere and 55ms in the right hemisphere. These were the only outward currents. The first inward (red) current exceeding 1600 pA/m (second map in Fig. 3A) was located between HG and PT and occurred slightly earlier in the right (~90ms) than the left hemisphere (~100ms; Fig. 3B). Inward current also developed in the IFG at this latency. Peak activity occurred at approximately 120–150ms within the mpSTG (third map in Fig. 3A), with peak activity occurring later for syllables with longer VOT (Fig. 3B). At approximately 120ms activity anterior to HG first appeared in the functional images, although the waveforms demonstrate that the onset of this activity occurs at about 60ms in the right hemisphere and between 90ms and 120ms in the left hemisphere. The maximum activity remained above 1600 pA/m until just after 145ms (fourth map in Fig. 3A). At this latency activity within and around HG and within IFG diminished.
Figure 3.
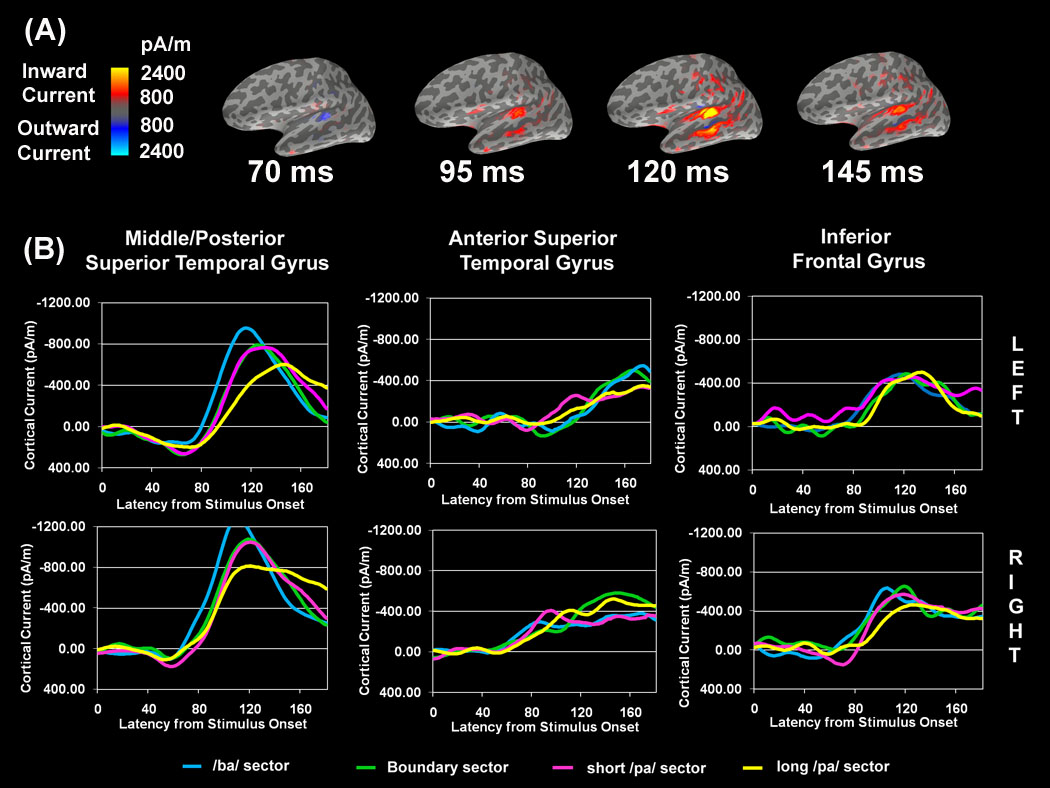
Estimates of MEG source currents averaged over 8 subjects. (A) Masked functional maps (MFMs) for the /ba/ VOT sector stimuli. Lateral view of the left hemisphere is shown. Two color scales, blue and red, are used to depict current that is flowing into and out of the cortex, respectively. Specific latencies were selected to highlight the spatiotemporal cortical dynamics. Activation is described in the text with respect to 1600 pA/m which is midway between the threshold for visualization of the minimum (800 pA/m) and maximum (2400 pA/m) current. (B) The average time courses (from 0ms to 180ms) of the estimated cortical current within ROIs for each VOT sector. Note that the current values of the waveforms are lower than the values displayed on the functional maps due to the fact that the waveforms are derived from an average activation of sources within a region of interest.
Effect of VOT
The mixed-model analysis indicated that the mpSTG waveform was influenced by VOT sector (Table 2). The peak of the waveform for the /ba/ VOT sector was higher and occurred earlier as compared to the long /pa/ VOT sector waveform, with the boundary and short /pa/ VOT sector waveforms demonstrating characteristics in between these extremes (Figure 4). The influence of VOT sector on the aSTG waveform will be considered in the next section, together with the influence of perceptual ambiguity. The VOT sector was not found to influence the IFG waveform.
Table 2.
Significant influences of hemisphere (Hemi), VOT sector (VOT), and ambiguity (Amb) on the waveform time course (T). DOF: degrees of freedom for the χ2 test.
| ROI | Hemisphere | VOT Sector | Interaction | DOF | χ2 |
|---|---|---|---|---|---|
| aSTG | Both | Hemi × VOT × Amb × T | 24 | 92.1*** | |
| Left | VOT × T | 12 | 21.1* | ||
| Amb × T | 3 | 11.8** | |||
| VOT × Amb × T | 12 | 43.2*** | |||
| short /pa/ | Amb × T | 3 | 54.6*** | ||
| Right | VOT × T | 12 | 33.4** | ||
| VOT × Amb × T | 12 | 67.0*** | |||
| /ba/ | Amb × T | 3 | 30.6*** | ||
| short /pa/ | Amb × T | 3 | 37.5*** | ||
| long /pa/ | Amb × T | 3 | 55.0*** | ||
| mpSTG | Both | Hemi × T | 6 | 13.5* | |
| VOT × T | 12 | 91.7*** | |||
| Hemi × Amb × T | 6 | 126.1*** | |||
| Left | Amb × T | 3 | 24.4*** | ||
| Right | Amb × T | 3 | 68.3*** | ||
| IFG | Both | Hemi × Amb × T | 6 | 14.2* | |
| Right | Amb × T | 3 | 13.8** |
p < 0.05,
p < 0.01,
p < 0.0001
Functional contrast maps illustrating differences in activation for different VOT sectors are shown in Fig. 5. Consistent with the mixed-model analysis, the maps indicate greater activity within the STG for stimuli with shorter VOTs early in the epoch and greater activity for stimuli with longer VOTs later in the epoch. Activity related to syllables with shorter VOTs (red) started at about 80ms and peaked at about 105ms in both hemispheres; however, it was sustained longer, up to 155ms, in the right but not the left hemisphere. Activity related to syllables with longer VOTs (blue) started later (155ms) in the left hemisphere than in the right hemisphere (105ms), but peaked at about 175ms for both hemispheres. Activity for syllables with both shorter (red) and longer (blue) VOTs appeared simultaneously in the right, but not the left, STG. In the right STG, activity related to syllables with shorter (red) and longer (blue) VOTs was spatially separated, with activity related to syllables with longer VOTs (blue) being initially more posterior but progressing from the posterior to the anterior STG as latency increased. This suggests that the cortical activity was sustained for a longer duration in the right hemisphere (i.e., from 80ms to 155ms for activity related to syllables with shorter VOTs and from 105ms to 175ms for activity related to syllables with longer VOTs), whereas such activity was briefer (i.e., from 80ms to 105ms for activity related to syllable with shorter VOTs and from 155ms to 175ms for activity related to syllables with longer VOTs) and temporally separated (i.e., activity related to syllables with both shorter (red) and longer (blue) VOTs did not occur simultaneously in the STG) in the left hemisphere
Figure 5.
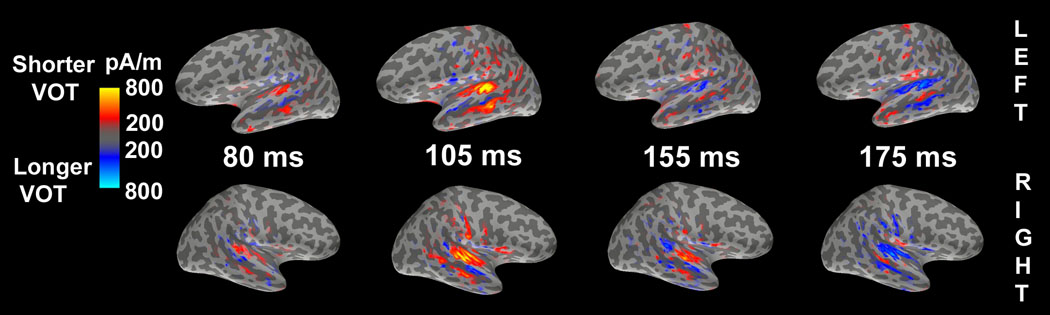
Functional contrast maps for VOT. The maps indicate differences in the activation related to the different VOT sectors. Red and blue represents greater activation for syllables with shorter and longer VOT, respectively.
Effect of Perceptual Ambiguity
The mixed-model analysis found complex interactions between VOT, hemisphere, perceptual ambiguity and the waveform in the aSTG ROI. The influence of perceptual ambiguity on the aSTG waveform was dependent on VOT in both the left and right hemispheres, although this dependency was different for the left and right hemispheres (Table 2). In the left hemisphere, only for the short /pa/ VOT sector ambiguity influenced the aSTG waveform. Lower perceptual ambiguity was associated with a progressive increase in left aSTG activity for the short /pa/ syllable (Fig. 6C). In the right hemisphere, there was an interaction between perceptual ambiguity and the aSTG waveform for all VOT sectors except the boundary sector. Lower perceptual ambiguity was associated with greater early right aSTG activation with this activity diminishing late in the time course where as an opposite profile, lower early activation and higher late activation, was associated with higher perceptual ambiguity (Fig. 6A,C,D). The spatiotemporal characteristics of this effect can be seen in the functional contrast maps in Fig. 7. In the right hemisphere higher perceptual ambiguity was associated with STG activity anterior to HG at the later latencies for VOT sectors associated with syllables that were consistently categorized as /ba/ or /pa/ (i.e., the /ba/, short /pa/ and long /pa/ VOT sectors).
Figure 7.
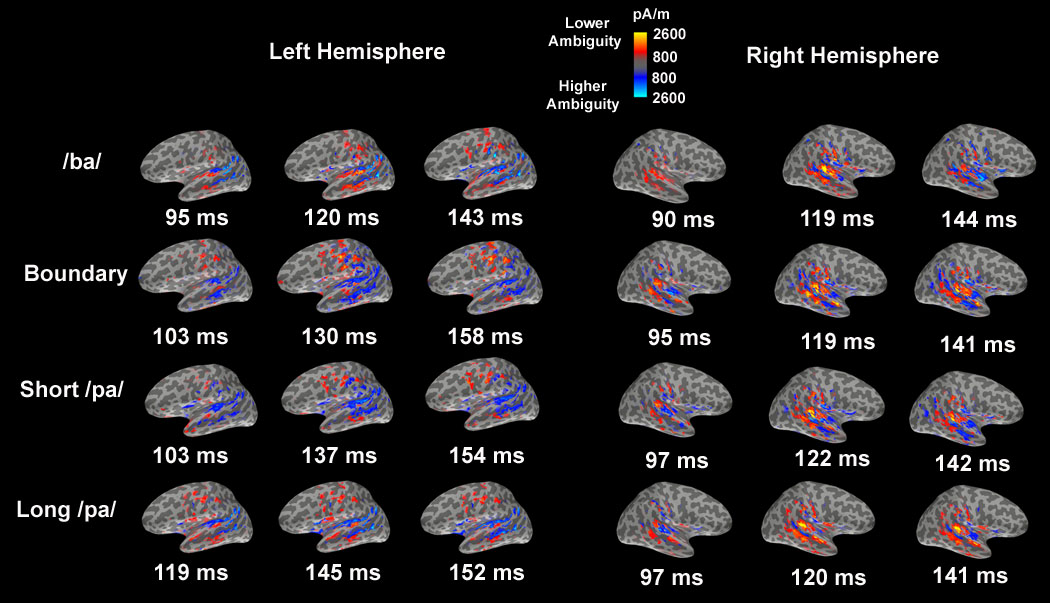
Functional contrast maps for perceptual ambiguity within each VOT sector. These maps were designed to highlight the differences in cortical activation due to perceptual ambiguity, with the red color demonstrating activation associated with lower perceptual ambiguity (more accurate responses) and the blue color associated with higher perceptual ambiguity (less accurate responses). The three latencies selected correspond to specific activation peaks on the average MFMs for each VOT sector and hemisphere (not shown) using the same criteria as that used to select the last three maps 2 to 4 of Fig. 3A. The latency of the first map from Fig. 3A was not selected because there was no consistent difference in activity due to perceptual ambiguity at this early latency.
The mixed-model analysis suggested that perceptual ambiguity influenced the mpSTG waveform with this influence being different in the left and right hemispheres (Table 2). Lower perceptual ambiguity was associated with a more asymmetric activation profile with a relatively higher peaked waveform in the right hemisphere and a relatively lower peaked waveform in the left hemisphere (Fig 8A). This effect is also evident in the functional contrast maps in Fig. 7. In the left hemisphere, activity posterior to HG was associated with higher perceptual ambiguity for all VOT sectors except for the /ba/ VOT sector while more medial activity was associated with higher perceptual ambiguity and more lateral activity was associated with lower perceptual ambiguity for the /ba/ VOT sector. In the right hemisphere, lower perceptual ambiguity was associated with prominent activity posterior to HG for all VOT sectors.
The mixed-model analysis demonstrated that perceptual ambiguity influenced the IFG waveform in the right, but not the left, hemisphere (Table 2). Lower perceptual ambiguity was associated with slightly higher peak and sustained waveform in the right hemisphere (Fig. 8B). This activity may be somewhat difficult to appreciate on the functional contrast maps (Fig. 7) since activity associated with both higher and lower perceptual ambiguity is seen in the IFG for several of the VOT sectors. Since the statistical analysis is based on the average activation within the entire IFG, activity related to both higher and lower perceptual ambiguity could average to zero if both were equal. The statistical analysis only provides a statistically significant result if activity related to either higher and lower perceptual ambiguity is greater overall. The functional activation maps demonstrate an interesting trend that the statistical analysis is not sensitive to – the activation related higher and lower perceptual ambiguity is spatially separated in the IFG with activity related to lower perceptual ambiguity located in the pars opercularis and activity related with higher perceptual ambiguity located in the pars triangularis.
DISCUSSION
This study examined the cortical responses to auditory stimuli derived from a /ba/-/pa/ VOT continuum. We manipulated VOT in order to create different variations in both the objective (i.e., VOT) and subjective (i.e., perceptual ambiguity) acoustical property of the auditory signal, thereby allowing the correlation of the neural activity with both of these property of the auditory signal. VOT was found to modulate activity in the anterior and middle/posterior STG but not in the IFG. Perceptual ambiguity was found to influence the spatiotemporal pattern of the neural response to auditory syllable stimuli differently for all three ROIs.
Cortical Response to Syllables: Effect of Perceptual Ambiguity
Perceptual ambiguity modulated the responses in the left and right aSTG and mpSTG, and in the right IFG. A bilateral symmetric response profile was associated with higher perceptual ambiguity while a more asymmetric profile was associated with lower perceptual ambiguity in both of STG ROIs. However, the direction of amplitude asymmetry and the temporal dynamics associated with lower perceptual ambiguity was different for aSTG and mpSTG. The significance of these findings is discussed below by ROI.
Anterior superior temporal gyrus
Perceptual ambiguity was found to be associated with right aSTG activity. Specifically, lower perceptual ambiguity was associated with a right aSTG waveform that peaked early and started to rapidly decrease prior to the activity peak in the left aSTG, whereas higher perceptual ambiguity was associated with a right aSTG waveform that continued to increase until the end of the stimulus (See Fig. 6 and Fig. 7). Activity in the left aSTG increased over the entire stimulus period and was unaffected by perceptual ambiguity. Activity of the right aSTG demonstrates a similar profile to the left aSTG during conditions of maximal perceptual ambiguity. The specific role of right aSTG activity is not clear, although its relationship to perceptual ambiguity suggests that it plays an important role. Early activity of the right aSTG may be important for stimulus processing, but it may be that this processing must finish early in the course of sublexical syllable identification in order to transfer of the neural information to other neural structures, possibly in the left hemisphere. Clearly the right aSTG can have a significant role in language processing as Crinion and Price (2005) have shown that the right aSTG may play a compensatory role in language for individuals with left temporal lesions.
The importance of aSTG in sublexical language processing is consistent with other functional imaging research (Ahveninen et al., 2006; Guenther et al., 2004; Hewson-Stoate et al., 2006; Uppenkamp et al., 2006). With the evidence that the aSTG is associated with the ‘what’ auditory stream and the fact that this area is activated by specific types of language (Friederici et al., 2000; Meyers et al., 2000; Noesselt et al., 2003) and non-language auditory stimuli (Altmann et al., 2007; Barrett and Hall, 2006; Koelsch et al., 2002; Patterson et al., 2002; Warren and Griffiths, 2003), certain authors have proposed that areas within the aSTG are important for categorizing behaviorally relevant classes of auditory objects (Obleser et al., 2006). The fact that the left aSTG is activated by auditory, but not written, words has raised the possibility that the aSTG is part of an auditory word form area that is analogous to the visual word form area in the fusiform gyrus (Cohen et al., 2004; Price et al., 2005). Indeed, the ability to reliably categorize a syllable stimulus should result in lower perceptual ambiguity. Clearly the relationship between perceptual ambiguity and the spatiotemporal dynamic of aSTG activation found in the current study is consistent with the importance of aSTG in language processing.
Middle / Posterior Superior Temporal Gyrus
The current study suggests that symmetric mpSTG activity is associated with higher perceptual ambiguity while asymmetric, right greater than left, mpSTG activity is associated with lower perceptual ambiguity. Some have suggested that posterior STG structures, particularly the PT, are important for decoding the general spatiotemporal structure of the auditory signal (Scott and Wise, 2004). Intracranial recordings have demonstrated separate early neural responses (<100ms) to the onset of both the initial consonant burst and vowel voicing in both left and right primary auditory cortices (Liegeois-Chauvel et al, 1999; Steinschneider, et al. 2005; Trébuchon-Da Fonseca et al., 2005), but only in the left, not right, secondary auditory and auditory association areas, such as the PT (Liegeois-Chauvel, de Graaf, Laguitton & Chauvel, 1999). Although some may interpret this evidence as supportive for the left hemisphere’s exclusive role in decoding the temporal characteristics of syllable stimuli (Liegeois-Chauvel, de Graaf, Laguitton & Chauvel, 1999), these data may also support the view that the left and right hemispheres are tuned to analyze stimuli at different timescales, with a longer integration time for the right hemisphere (Boemio et al., 2005). Indeed, longer integration times of the entire auditory signal in the right hemisphere and shorter integration of multiple (two or more) auditory signals in the left hemisphere would explain the sustained right hemisphere current waveform and the lower peaked slower rising left hemisphere waveform (Figs. 3B) as well as the overlapping activation of syllables with short and long VOT values in the right, but not left, STG (Fig. 5).
Inferior Frontal Gyrus
Perceptual ambiguity was found to modulate the right IFG waveform with higher peak activation in the right IFG associated with higher perceptual ambiguity. This is consistent with functional imaging studies on clinical populations (see below).
Cortical Response to Syllables: Effect of VOT
Temporal modulation of the neural response by VOT was first described in auditory evoked response studies (c.f. Sharma et al., 2000). Such studies suggest that voiced syllables (shorter VOT) produce an N100 response with shorter latencies than unvoiced syllables (longer VOT). The M100, the neuromagnetic analog of the N100, has been proposed to be generated by sources within the posterior portion of the superior temporal plane, in or near the PT (Godey et al., 2001; Halgren et al., 1995). Given that the M100 peak latency has been reported to depend on whether the stimulus is voiced or unvoiced (Ackermann et al., 1999; Frye et al., 2007), the data in this study supports the idea that one of the major generators of the M100 is located in the posterior portion of the STG and is temporally modulated by VOT. The fact that IFG activity was invariant with respect to VOT sector is consistent with previous fMRI studies on syllable perception (Blumstein et al., 2005; Boatman, 2004) and production (Bohland and Guenther, 2006). The current study also suggests that VOT and perceptual ambiguity interact to modulate activity in the anterior STG. This suggests a complex relationship between the latency and amplitude of the M100 and both VOT and perceptual ambiguity.
Relevance to Patients with Dyslexia
Neural mechanisms that underlie developmental language disorders may be better understood by examining the mechanisms associated with perceptual ambiguity in normal individuals. Since a sublexical language processing deficit is believed to underlie developmental dyslexia, we could assume that dyslexic individuals manifest higher perceptual ambiguity when processing sublexical stimuli such as syllables. Brain activation differences between dyslexic and normal individuals are consistent with this notion:
The current study’s association of symmetric mpSTG activation with greater perceptual ambiguity and asymmetric mpSTG activity, right greater than left, mpSTG activation with lower perceptual ambiguity is consisted with neuroimage studies on dyslexia. Paul et al. (2006) found that the N260m was more symmetric in dyslexic, as compared to normal, children, Helenius et al. (2002) found an unusually large left supratemporal response in dyslexic, as compare to normal, adults, and McCrory et al. (2000) found decreased right superior temporal activity in dyslexic, as compare to normal, adults.
The current study’s suggestion of the right aSTG’s importance in sublexical decoding is consistent with both Paul et al. (2006) and McCrory et al. (2000) who demonstrated decreased right anterior hemisphere activity in dyslexic, as compared to normal, individuals.
The current study’s association of increased right IFG activity with greater perceptual ambiguity is consistent with the findings of Dufor et al. (2007) who demonstrated increased right frontal cortex activity in dyslexic, as compared to normal, adults.
Thus, similar patterns of cortical activation that have been associated with higher perceptual ambiguity in the current study appear to also be associated with developmental dyslexia. This may suggest that abnormal patterns of brain activation seen in dyslexia represent an extreme variation of normal brain mechanisms. Indentifying and clarifying these patterns may allow us to understand the deficits involved in the abnormal perception of sublexical language components and provide guidance for developing treatment protocols.
Understanding the Interactions between Language Areas
Understand the roles of the dorsal and ventral auditory streams in sublexical processing and determining how and where these streams are integrated may provide a greater understanding of normal and abnormal language perception. Some have suggested that posterior STG structures, particularly PT, are important for decoding the general spatiotemporal structure of the auditory signal (Scott and Wise, 2004), whereas the more anterior temporal cortical structures are important for stimulus identification through the ventral auditory stream. If we assume that the structures in the PP are associated with the ventral auditory stream, the current data suggests that the specific timing of spatiotemporal activation of the dorsal and ventral auditory stream is important for speech perception.
IFG activity began and peaked with mpSTG activity, but disappeared well before the end of the epoch (Fig. 3). IFG activity appeared to peak near the onset of left aSTG activity. Thus, it is possible that IFG produces top-down information that is integrated into the ‘what’ stream in the left aSTG. This would be consistent with the IFG being part of the dorsal (‘where/how’) auditory stream (Hickok and Poeppel, 2007) while being highly connected with the ventral (‘what’) auditory stream (Buchsbaum et al., 2005). Indeed, the IFG may function as the interface between the two auditory streams, providing ‘top-down’ information to the ventral (‘what’) stream from the dorsal (‘where/how’) stream.
Since the left aSTG demonstrated the latest onset of activation, we propose that this area may be the site for integration of categorical information and the true final node of the auditory ‘what’ system, at least for language. Clinical evidence supports the importance of the left aSTG in language. For example, pure word deafness (auditory speech agnosia without aphasia) is associated with rare circumscribed anterior STG lesions (Bauer and Demery, 2003) and decreased white matter has been found in the left PP of children with developmental language disorders compared to healthy control children (Jäncke et al., 2007). Clearly, with the recent delineation of the auditory ‘what’ stream, the aSTG is receiving greater recognition. Further research of this important area of the temporal lobe with regards to its role in speech perception should hopefully be forthcoming.
Conclusions
The spatiotemporal cortical patterns of activation found in the present study confirm and clarify the findings from previous fMRI studies and are consistent with previous MEG investigations using dipole modeling. The present data are consistent with the idea that early cognitive language processing is bilaterally distributed, whereas late processing is lateralized to the dominant hemisphere (Merrifield et al., 2007; Papanicolaou et al., 2006). These data point to the importance of the dynamics of cortical activation for accurate processing of auditory sublexical stimuli and are consistent with the recently proposed dual-stream model of auditory processing. Specifically these data confirm that left ventral stream auditory structures appear to be associated with “what” information specific to language. Our data also suggest that dorsal stream auditory structures are associated with spectrotemporal analysis of the auditory signal. Since spectotemporal information is essential for motor-articulatory learning, our data support a “how” function of the dorsal-stream rather than a “where” function (Hickok and Poeppel, 2007). This study suggests that variations in individual perceptual characteristics may be important to take into account for when investigating the cortical response to language stimuli and demonstrates how such variation in performance can be used to understand abnormal cortical activation in clinical populations.
Acknowledgments
The authors would like to thank Alexis Coty, Polly Dhond, Deirdre Foxe, Matti Hämäläinen and Patrice Seyed for their assistance. This project was supported by NS046565 to Dr. Richard Frye, NS048778 to Ms. Janet McGraw Fisher, SPRiNG award from Boston University and NSF 0354378 to Dr. Jackie Liederman and NS18741 to Dr. Eric Halgren. This research was supported in part by the National Center for Research Resources (P41RR14075) and the Mental Illness and Neuroscience Discovery (MIND) Institute.
Appendix
Appendix A
The general mixed model is in matrix form
| (A.1) |
where y is the dependent variable, which in this case is the average current estimate of a ROI, X is the design matrix for the fixed effects, β is a vector containing the parameters of the fixed effects, Z is the design matrix for the random effects, γ contains the parameters of the random effects and ε is the variance-covariance matrix of the model error. The key assumption of the mixed model are that both γ and ε have the expected value of zero (i.e., E(γ) = 0 and E(ε) = 0) and known covariance structure given by the matrixes Var (γ) and Var(ε).
The values for each row (corresponding to the time course of one source element) of the fixed-effects design matrix X are given by
| (A.2) |
where c is the constant with value 1, t is the centered time of the time course in milliseconds, v is the VOT represented by the three dummy variables v1 … v3 (i.e., v1 = 1 for /ba/ sector and 0 otherwise, v2 = 1 for boundary sector and 0 otherwise, v3 = 1 for short /pa/ sector and 0 otherwise), h is the hemisphere as represented by a dummy variable (i.e., left hemisphere = 0, right hemisphere = 1), and a is the centered perceptual ambiguity value (percent correct) for the particular participant, p, and VOT sector, v. This example includes time parameters modeled with up to the third order polynomial. Note that the time parameters are modeled to interact with of the other fixed-effects but not with each other. The values for each row of the random-effects design matrix Z are given by
| (A.3) |
where p is the participant index and t is the centered time of the time course in millisecond, cpi is 1 for participant i and 0 otherwise and tpi is the centered time of the time course in millisecond for participant i and 0 otherwise.
Footnotes
Publisher's Disclaimer: This is a PDF file of an unedited manuscript that has been accepted for publication. As a service to our customers we are providing this early version of the manuscript. The manuscript will undergo copyediting, typesetting, and review of the resulting proof before it is published in its final citable form. Please note that during the production process errors may be discovered which could affect the content, and all legal disclaimers that apply to the journal pertain.
References
- Ackermann H, Lutzenberger W, Hertrich I. Hemispheric lateralization of neural encoding of temporal features: a whole-head magnetencephalography study. Brain Res Cogn Brain Res. 1999;7:511–518. doi: 10.1016/s0926-6410(98)00054-8. [DOI] [PubMed] [Google Scholar]
- Ahveninen J, Jääskeläinen IP, Raij T, Bonmassar G, Devore S, Hämäläinen M, Levänen S, Lin FH, Sams M, Shinn-Cunningham BG, Witzel T, Belliveau JW. Task-modulated "what" and "where" pathways in human auditory cortex. Proc. Natl. Acad. Sci. U.S.A. 2006;103(39):14608–14613. doi: 10.1073/pnas.0510480103. [DOI] [PMC free article] [PubMed] [Google Scholar]
- Allison PD. Logistic regression using the SAS®: Theory and Application. Cary, NC: SAS Institute, Inc.; 1999. [Google Scholar]
- Altmann CF, Bledowski C, Wibral M, Kaiser J. Processing of location and pattern changes of natural sounds in the human auditory cortex. Neuroimage. 2007;35(3):1192–1200. doi: 10.1016/j.neuroimage.2007.01.007. [DOI] [PubMed] [Google Scholar]
- Barrett DJ, Hall DA. Response preferences for "what" and "where" in human non-primary auditory cortex. Neuroimage. 2006;32(2):968–977. doi: 10.1016/j.neuroimage.2006.03.050. [DOI] [PubMed] [Google Scholar]
- Blumstein SE, Myers EB, Rissman J. The perception of voice onset time: an fMRI investigation of phonetic category structure. J Cogn Neurosci. 2005;17(9):1353–1366. doi: 10.1162/0898929054985473. [DOI] [PubMed] [Google Scholar]
- Boatman D. Cortical bases of speech perception: evidence from functional lesion studies. Cognition. 2004;92(1–2):47–65. doi: 10.1016/j.cognition.2003.09.010. [DOI] [PubMed] [Google Scholar]
- Boemio A, Fromm S, Braun A, Poeppel D. Hierarchical and asymmetric temporal sensitivity in human auditory cortices. Nat Neurosci. 2005;8:389–395. doi: 10.1038/nn1409. [DOI] [PubMed] [Google Scholar]
- Bohland JW, Guenther FH. An fMRI investigation of syllable sequence production. Neuroimage. 2006;32(2):821–841. doi: 10.1016/j.neuroimage.2006.04.173. [DOI] [PubMed] [Google Scholar]
- Bonte M, Parviainen T, Hytönen K, Salmelin R. Time course of top-down and bottom-up influences on syllable processing in the auditory cortex. Cereb Cortex. 2006;16(1):115–123. doi: 10.1093/cercor/bhi091. [DOI] [PubMed] [Google Scholar]
- Buchsbaum BR, Olsen RK, Koch P, Berman KF. Human dorsal and ventral auditory streams subserve rehearsal-based and echoic processes during verbal working memory. Neuron. 2005;48(4):687–697. doi: 10.1016/j.neuron.2005.09.029. [DOI] [PubMed] [Google Scholar]
- Cohen L, et al. Distinct unimodal and multimodal regions for word processing in the left temporal cortex. NeuroImage. 2004;23.4:1256–1270. doi: 10.1016/j.neuroimage.2004.07.052. [DOI] [PubMed] [Google Scholar]
- Crinion J, Price CJ. Right anterior superior temporal activation predicts auditory sentence comprehension following aphasic stroke. Brain. 2005;128(Pt 12):2858–2871. doi: 10.1093/brain/awh659. [DOI] [PubMed] [Google Scholar]
- Dale AM, Liu AK, Fischl BR, Buckner RL, Belliveau JW, Lewine JD, Halgren E. Dynamic statistical parametric mapping: combining fMRI and MEG for high-resolution imaging of cortical activity. Neuron. 2000;26(1):55–67. doi: 10.1016/s0896-6273(00)81138-1. [DOI] [PubMed] [Google Scholar]
- Davis MH, Johnsrude IS. Hierarchical processing in spoken language comprehension. J Neurosci. 2003;23(8):3423–3431. doi: 10.1523/JNEUROSCI.23-08-03423.2003. [DOI] [PMC free article] [PubMed] [Google Scholar]
- Dufor O, Serniclaes W, Sprenger-Charolles L, Démonet JF. Top-down processes during auditory phoneme categorization in dyslexia: a PET study. Neuroimage. 2007;34(4):1692–1707. doi: 10.1016/j.neuroimage.2006.10.034. [DOI] [PubMed] [Google Scholar]
- Fischl B, Liu A, Dale AM. Automated manifold surgery: constructing geometrically accurate and topologically correct models of the human cerebral cortex. IEEE Trans Med Imaging. 2001;20(1):70–80. doi: 10.1109/42.906426. [DOI] [PubMed] [Google Scholar]
- Fischl B, Salat DH, van der Kouwe AJ, Makris N, Ségonne F, Quinn BT, Dale AM. Sequence-independent segmentation of magnetic resonance images. Neuroimage. 2004;23 Suppl 1:S69–S84. doi: 10.1016/j.neuroimage.2004.07.016. [DOI] [PubMed] [Google Scholar]
- Fischl B, Sereno MI, Dale AM. Cortical surface-based analysis. II: Inflation, flattening, and a surface-based coordinate system. Neuroimage. 1999;9(2):195–207. doi: 10.1006/nimg.1998.0396. [DOI] [PubMed] [Google Scholar]
- Friederici AD, Meyer M, von Cramon DY. Auditory language comprehension: an event-related fMRI study on the processing of syntactic and lexical information. Brain Lang. 2000;75(3):289–300. [PubMed] [Google Scholar]
- Frye RE, McGraw , Fisher J, Coty A, Zarella M, Liederman J, Halgren E. Linear coding of voice onset time. J Cog Neurosci. 2007;19(9):1476–1487. doi: 10.1162/jocn.2007.19.9.1476. [DOI] [PMC free article] [PubMed] [Google Scholar]
- Godey B, Schwartz D, de Graaf JB, Chauvel P, Liegeois-Chauvel C. Neuromagnetic source localization of auditory evoked fields and intracerebral evoked potentials: a comparison of data in the same patients. Clin Neurophysiol. 2001;112:1850–1859. doi: 10.1016/s1388-2457(01)00636-8. [DOI] [PubMed] [Google Scholar]
- Guenther FH, Nieto-Castanon A, Ghosh SS, Tourville JA. Representation of sound categories in auditory cortical maps. J. Speech Lang. Hear. Res. 2004;47(1):46–57. doi: 10.1044/1092-4388(2004/005). [DOI] [PubMed] [Google Scholar]
- Gunji A, Hoshiyama M, Kakigi R. Auditory response following vocalization: a magnetoencephalographic study. Clin Neurophysiol. 2001;112(3):514–520. doi: 10.1016/s1388-2457(01)00462-x. [DOI] [PubMed] [Google Scholar]
- Halgren E, Baudena P, Clarke JM, Heit G, Liegeois C, Chauvel P, Musolino A. Intracerebral potentials to rare target and distracter auditory and visual stimuli. I. Superior temporal plane and parietal lobe. Electroencephalogr Clin Neurophysiol. 1995;94:191–220. doi: 10.1016/0013-4694(94)00259-n. [DOI] [PubMed] [Google Scholar]
- Hämäläinen M, Ilmoniemi RJ. Interpreting magnetic fields of the brain: minimum norm estimates. Med Biol Eng Comput. 1994;32(1):35–42. doi: 10.1007/BF02512476. [DOI] [PubMed] [Google Scholar]
- Hämäläinen M, Sarvas J. Realistic conductivity geometry model of the human head for interpretation of neuromagnetic data. IEEE Trans Biomed Eng. 1989;36(2):165–171. doi: 10.1109/10.16463. [DOI] [PubMed] [Google Scholar]
- Hämäläinen M, Hari R, Ilmoniemi R, Knuutila J, Lounasmaa O. Magnetoencephalography--theory, instrumentation, and applications to noninvasive studies of the working human brain. Rev Mod Phys. 1993;65:1–93. [Google Scholar]
- Helenius P, Salmelin R, Richardson U, Leinonen S, Lyytinen H. Abnormal auditory cortical activation in dyslexia 100 msec after speech onset. J Cogn Neurosci. 2002;14(4):603–617. doi: 10.1162/08989290260045846. [DOI] [PubMed] [Google Scholar]
- Hewson-Stoate N, Schönwiesner M, Krumbholz K. Vowel processing evokes a large sustained response anterior to primary auditory cortex. Eur. J. Neurosci. 2006;9:2661–2671. doi: 10.1111/j.1460-9568.2006.05096.x. [DOI] [PubMed] [Google Scholar]
- Hickok G, Buchsbaum B, Humphries C, Muftuler T. Auditory-motor interaction revealed by fMRI: speech, music, and working memory in area Spt. J Cogn Neurosci. 2003;15(5):673–682. doi: 10.1162/089892903322307393. [DOI] [PubMed] [Google Scholar]
- Hickok G, Poeppel D. The cortical organization of speech processing. Nat. Rev. Neurosci. 2007;8(5):393–402. doi: 10.1038/nrn2113. [DOI] [PubMed] [Google Scholar]
- Jäncke L, Siegenthaler T, Preis S, Steinmetz H. Decreased white-matter density in a left-sided fronto-temporal network in children with developmental language disorder: Evidence for anatomical anomalies in a motor-language network. Brain Lang. 2007;102(1):91–98. doi: 10.1016/j.bandl.2006.08.003. [DOI] [PubMed] [Google Scholar]
- Kim JJ, Crespo-Facorro B, Andreasen NC, O'Leary DS, Zhang B, Harris G, Magnotta VA. An MRI-based parcellation method for the temporal lobe. Neuroimage. 2000;11(4):271–288. doi: 10.1006/nimg.2000.0543. [DOI] [PubMed] [Google Scholar]
- Koelsch S, Gunter TC, v Cramon DY, Zysset S, Lohmann G, Friederici AD. Bach speaks: a cortical "language-network" serves the processing of music. Neuroimage. 2002;17(2):956–966. [PubMed] [Google Scholar]
- Liberman AM, Delattre PC, Cooper FS. Some cues for the distinction between voiced and voiceless stops in initial position. Lang Speech. 1958;1:153–167. [Google Scholar]
- Liberman AM, Harris KS, Hoffman HS, Griffith BC. The discrimination of speech sounds within and across phoneme boundaries. J Exp Psych. 1957;54:358–368. doi: 10.1037/h0044417. [DOI] [PubMed] [Google Scholar]
- Liederman J, Frye R, Fisher JM, Greenwood K, Alexander R. A temporally dynamic context effect that disrupts voice onset time discrimination of rapidly successive stimuli. Psychon Bull Rev. 2005;12:380–386. doi: 10.3758/bf03196388. [DOI] [PubMed] [Google Scholar]
- Liegeois-Chauvel C, de Graaf JB, Laguitton V, Chauvel P. Specialization of left auditory cortex for speech perception in man depends on temporal coding. Cereb Cortex. 1999;9(5):484–496. doi: 10.1093/cercor/9.5.484. [DOI] [PubMed] [Google Scholar]
- Lin FH, Belliveau JW, Dale AM, Hämäläinen MS. Distributed current estimates using cortical orientation constraints. Hum Brain Mapp. 2006a;27(1):1–13. doi: 10.1002/hbm.20155. [DOI] [PMC free article] [PubMed] [Google Scholar]
- Lin FH, Witzel T, Ahlfors SP, Stufflebeam SM, Belliveau JW, Hämäläinen MS. Assessing and improving the spatial accuracy in MEG source localization by depth-weighted minimum-norm estimates. Neuroimage. 2006b;31(1):160–171. doi: 10.1016/j.neuroimage.2005.11.054. [DOI] [PubMed] [Google Scholar]
- McCrory E, Frith U, Brunswick N, Price C. Abnormal functional activation during a simple word repetition task: A PET study of adult dyslexics. J Cogn Neurosci. 2000;12(5):753–762. doi: 10.1162/089892900562570. [DOI] [PubMed] [Google Scholar]
- Merrifield WS, Simos PG, Papanicolaou AC, Philpott LM, Sutherling WW. Hemispheric language dominance in magnetoencephalography: Sensitivity, specificity, and data reduction techniques. Epilepsy Behav. 2007;10(1):120–128. doi: 10.1016/j.yebeh.2006.10.012. [DOI] [PubMed] [Google Scholar]
- Meyer M, Friederici AD, von Cramon DY. Neurocognition of auditory sentence comprehension: event related fMRI reveals sensitivity to syntactic violations and task demands. Brain Res Cogn Brain Res. 2000;9(1):19–33. doi: 10.1016/s0926-6410(99)00039-7. [DOI] [PubMed] [Google Scholar]
- Noesselt T, Shah NJ, Jäncke L. Top-down and bottom-up modulation of language related areas--an fMRI study. BMC Neurosci. 2003;264:13. doi: 10.1186/1471-2202-4-13. [DOI] [PMC free article] [PubMed] [Google Scholar]
- Obleser J, Boecker H, Drzezga A, Haslinger B, Hennenlotter A, Roettinger M, Eulitz C, Rauschecker JP. Vowel sound extraction in anterior superior temporal cortex. Hum Brain Mapp. 2006;27(7):562–571. doi: 10.1002/hbm.20201. [DOI] [PMC free article] [PubMed] [Google Scholar]
- Papanicolaou AC. What aspects of experience can functional neuroimaging be expected to reveal? Int. J. Psychophysiol. 2007;64(1):101–105. doi: 10.1016/j.ijpsycho.2006.07.004. [DOI] [PubMed] [Google Scholar]
- Papanicolaou AC, Pazo-Alvarez P, Castillo EM, Billingsley-Marshall RL, Breier JI, Swank PR, Buchanan S, McManis M, Clear T, Passaro AD. Functional neuroimaging with MEG: normative language profiles. Neuroimage. 2006;33(1):326–342. doi: 10.1016/j.neuroimage.2006.06.020. [DOI] [PubMed] [Google Scholar]
- Patterson RD, Uppenkamp S, Johnsrude IS, Griffiths TD. The processing of temporal pitch and melody information in auditory cortex. Neuron. 2002;36(4):767–776. doi: 10.1016/s0896-6273(02)01060-7. [DOI] [PubMed] [Google Scholar]
- Paul I, Bott C, Heim S, Eulitz C, Elbert T. Reduced hemispheric asymmetry of the auditory N260m in dyslexia. Neuropsychologia. 2006;44(5):785–794. doi: 10.1016/j.neuropsychologia.2005.07.011. [DOI] [PubMed] [Google Scholar]
- Poeppel D, Yellin E, Phillips C, Roberts TP, Rowley HA, Wexler K, Marantz A. Task-induced asymmetry of the auditory evoked M100 neuromagnetic field elicited by speech sounds. Brain Res Cogn Brain Res. 1996;4(4):231–242. doi: 10.1016/s0926-6410(96)00643-x. [DOI] [PubMed] [Google Scholar]
- Price CJ, Thierry G, Griffiths T. Speech-specific auditory processing: where is it ? Trends Cogn. Sci. 2005;9.6:271–276. doi: 10.1016/j.tics.2005.03.009. [DOI] [PubMed] [Google Scholar]
- Rauschecker JP, Tian B. Mechanisms and streams for processing of "what" and "where" in auditory cortex. Proc. Natl. Acad. Sci. U.S.A. 2000;97(22):11800–11806. doi: 10.1073/pnas.97.22.11800. [DOI] [PMC free article] [PubMed] [Google Scholar]
- Scott SK, Wise RJ. The functional neuroanatomy of prelexical processing in speech perception. Cognition. 2004;92(1–2):13–45. doi: 10.1016/j.cognition.2002.12.002. [DOI] [PubMed] [Google Scholar]
- Sharma A, Marsh CM, Dorman MF. Relationship between N1 evoked potential morphology and the perception of voicing. J. Acoust. Soc. Am. 2000;108:3030–3035. doi: 10.1121/1.1320474. [DOI] [PubMed] [Google Scholar]
- Shestakova A, Brattico E, Soloviev A, Klucharev V, Huotilainen M. Orderly cortical representation of vowel categories presented by multiple exemplars. Brain Res. Cogn. Brain Res. 2004;21(3):342–350. doi: 10.1016/j.cogbrainres.2004.06.011. [DOI] [PubMed] [Google Scholar]
- Shtyrov Y, Pihko E, Pulvermûller F. Determinants of dominance: is language laterality explained by physical or linguistic features of speech? Neuroimage. 2005;27(1):37–47. doi: 10.1016/j.neuroimage.2005.02.003. [DOI] [PubMed] [Google Scholar]
- Steinschneider M, Volkov IO, Fishman YI, Oya H, Arezzo JC, Howard MA., 3rd Intracortical responses in human and monkey primary auditory cortex support a temporal processing mechanism for encoding of the voice onset time phonetic parameter. Cereb. Cortex. 2005;15(2):170–186. doi: 10.1093/cercor/bhh120. [DOI] [PubMed] [Google Scholar]
- Trebuchon-Da Fonseca A, Giraud K, Badier JM, Chauvel P, Liegeois-Chauvel C. Hemispheric lateralization of voice onset time (VOT) comparison between depth and scalp EEG recordings. Neuroimage. 2005;27(1):1–14. doi: 10.1016/j.neuroimage.2004.12.064. [DOI] [PubMed] [Google Scholar]
- Uppenkamp S, Johnsrude IS, Norris D, Marslen-Wilson W, Patterson RD. Locating the initial stages of speech-sound processing in human temporal cortex. Neuroimage. 2006;31(3):1284–1296. doi: 10.1016/j.neuroimage.2006.01.004. [DOI] [PubMed] [Google Scholar]
- Warren JD, Griffiths TD. Distinct mechanisms for processing spatial sequences and pitch sequences in the human auditory brain. J. Neurosci. 2003;23(13):5799–5804. doi: 10.1523/JNEUROSCI.23-13-05799.2003. [DOI] [PMC free article] [PubMed] [Google Scholar]