
Figure 3.
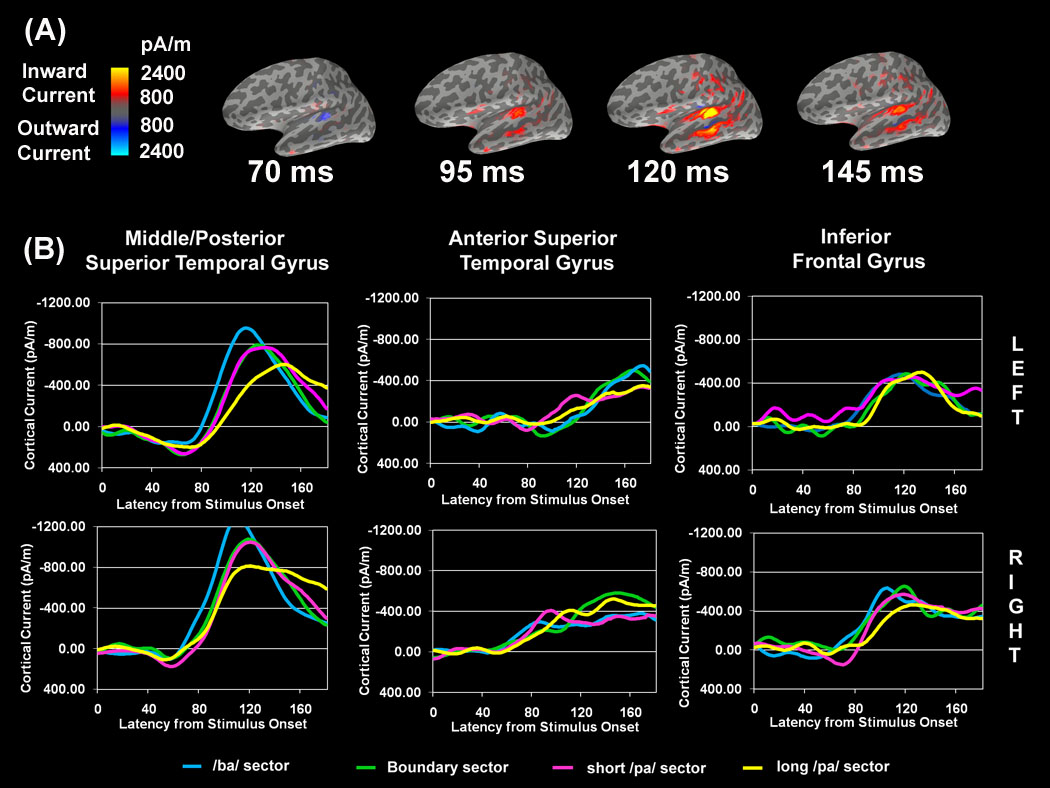
Estimates of MEG source currents averaged over 8 subjects. (A) Masked functional maps (MFMs) for the /ba/ VOT sector stimuli. Lateral view of the left hemisphere is shown. Two color scales, blue and red, are used to depict current that is flowing into and out of the cortex, respectively. Specific latencies were selected to highlight the spatiotemporal cortical dynamics. Activation is described in the text with respect to 1600 pA/m which is midway between the threshold for visualization of the minimum (800 pA/m) and maximum (2400 pA/m) current. (B) The average time courses (from 0ms to 180ms) of the estimated cortical current within ROIs for each VOT sector. Note that the current values of the waveforms are lower than the values displayed on the functional maps due to the fact that the waveforms are derived from an average activation of sources within a region of interest.