

Abstract
The purpose of this study was to describe age-related changes in vibrotactile sensitivity in participants of the Baltimore Longitudinal Study of Aging and to identify factors that are associated with impairment in vibrotactile sensitivity independent of age. Participants (n=523, age:26–95 years) underwent measurements of vibration perception threshold (VPT, 100Hz) under the 2nd metatarsal head, glucose tolerance, serum inflammatory markers, nerve conduction parameters, movement time and cognition. Univariate and multivariate regression analyses were performed to identify factors that predicted VPT independent of age. Structural equation modeling was used to describe relationships between these variables. VPT was progressively higher with older age. Adjusting for age and height, VPT was similar in men and women and the slope of age-related decline was similar in the two genders. Age, height, peroneal nerve conduction velocity and peroneal nerve amplitude were independent predictors of VPT. Structural equation model demonstrated a direct relationship between peripheral nerve function and VPT. Height and circulating inflammatory markers may influence age-related decline in vibrotactile sensitivity through their negative impacts on peripheral nerve function.
Keywords: vibrotactile sensitivity, vibration perception threshold, aging, peripheral nerve function
1. Introduction
Assessment of vibrotactile sensitivity is a common test used in a neurological examination for evaluating sensory function. Interest in measuring vibrotactile sensitivity using objective methods is growing due to a proposed association with functional mobility in older adults [31] and also in connection with clinical studies testing the effectiveness of interventions aimed at improving peripheral nerve function especially in diabetic patients [36]. Accordingly, commercial devices have been developed that assess vibration sensitivity through psychophysical techniques aimed at identifying the minimum amplitude of vibratory stimulus required for perception (VPT). It has been proposed that in human glabrous skin, high frequency vibration (60–250 Hz) is detected by fast adapting subcutaneous mechanoreceptors such as Pacinian corpuscles and the information is conveyed to the central nervous system by their corresponding nerve fibers (Fast Adapting Type II: FAIIs) [15,19].
Researchers have reported a significant age-related decline in vibrotactile sensitivity as shown by increase in threshold for perception of vibration [12,23,27,34,40]. Within a healthy older population (age >65 years), the increase in thresholds is particularly notable for high frequency vibrations after the age of 70 years [27]. However, the age-related physiological changes that account for such a decline are still unclear. Some pathologic conditions that tend to be more prevalent and severe in older persons adversely influence peripheral neural function. For example, significant deterioration in nerve conduction parameters and increased threshold for various sensory modalities has been shown in diabetes mellitus (DM) [17]. Reduction in motor nerve conduction velocity is also reported in subjects with impaired glucose tolerance (IGT) in absence of DM [39] possibly due to the pro-oxidative effects of chronic hyperglycemia on nervous cell structures [37]. However, it is not known whether age-related decline in vibrotactile sensitivity can be partly attributed to progressive derangement of glucose metabolism.
It is proposed that primary dysregulation of the immune system results in a chronic mild proinflammatory state in the elderly [4]. It has been suggested that high levels of circulating proinflammatory cytokines may cause neural cell apoptosis and, feasibly, play an important role in age-related decline in central nervous system function [2,30]. Inflammatory cytokines exert their biological effects through their interactions with specific receptors. Studies performed on cell culture have demonstrated that the costimulation of Tumor Necrosis Factor –α Receptor1 (TNF-αR1) and Tumor Necrosis Factor –α Receptor2 (TNF-αR2) is a powerful pro-apoptotic stimulus [10]. Further, using data from a large population-based study, Di Iorio et al [6] have recently reported a significant inverse association between peroneal nerve conduction velocity and circulating levels of serum Interleukin-6 Receptor (sIL-6R). Thus, it is reasonable to hypothesize that the mild pro-inflammatory state that is often encountered in older adults may account, at least in part, for the progressive decline of vibrotactile sensitivity.
The aim of the present study was to describe age-related changes in the vibrotactile sensitivity across the adult life span in a well-described cohort enrolled in the Baltimore Longitudinal Study of Aging [35] and to identify factors that, independent of age, are associated with decrements in vibrotactile sensitivity. In particular, we tested the hypothesis that independent of the confounding effects of age, lower vibrotactile sensitivity is correlated with the glucose metabolism homeostasis and circulating levels of inflammatory markers.
2 Methods
2.1 Participants
The BLSA participants are men and women aged 19–90+ years from a prospective study of aging that started in 1958. Participants in the BLSA are community residing volunteers who generally have above average income, high education levels and good access to medical care. Over 90% of BLSA participants rate their health as good or excellent at study entry. At ~2-year intervals, participants visit the National Institute on Aging Research Unit in Baltimore, MD for 2–2.5 days of research testing. Details about recruitment and testing have been reported elsewhere [35]. In 2004–2005, out of 583 BLSA study participants, 523 participants (263 females, age: 26–95 years and 260 males, age: 28–95 years) were tested for vibrotactile sensitivity. The data from all 523 participants were included in the present study. From those who reported alcohol intake (n = 350), 17% participants were teetotalers, 77% were mild drinkers and 6% were heavy drinkers. Thirty-six participants (6.5%) were diabetic (Type II). Within the diabetics, 22 participants were on oral hypoglycemics and one was on insulin treatment.
2.2 Outcome measures
Vibration perception threshold (VPT): The testing was performed in a quiet room. Vibration perception thresholds were measured using a commercial device (Medoc VSA 3000 Advance Medical Systems, Minneapolis, MN). The diameter of the stimulating probe was 1.25 cm. If the initial limb temperature was below 32°C, the foot was heated with a heating pad until 32°C was achieved. The participant was asked to sit in a chair and the bare testing foot was placed on the foot plate with the probe surface under the head of the 2nd metatarsal. The vibratory stimulus was delivered at 100 Hz and the method of limits was used. The machine delivered the stimulus with increasing intensity in the steps of 0.5 micrometers (µm). The participant was instructed to concentrate on the foot and to click the mouse as soon as s/he perceived the vibration. The test was repeated 6 times. The highest and the lowest scores were eliminated and the average of the remaining four trials was recorded as the VPT (µm). Testing was performed on the right foot unless contraindicated. Participants were excluded if they had both great toes missing (e.g., if both great toes were amputated), or bilateral foot ulcers, trauma, or surgery.
Glucose tolerance measure: Oral Glucose Tolerance Test (OGTT) was performed using a standard dose of 75 gm Fructose [33] (n = 466). A 5 cc blood sample was removed using an indwelling catheter once prior to oral glucose administration and then at designated intervals. The last sample was collected at 120 minutes post administration. Plasma glucose levels were measured using a glucose oxidase-based assay (Glucose Analyzer 2, Beckman Coulter In., Brea, CA). Fasting glucose and glucose level 120 minutes post glucose administration (Glucose120) were used in the analysis as indicators of glucose tolerance [25]. Glucose tolerance test was not performed if the participant was on insulin treatment, s\he had used steroids in the previous three months or had exercised on the morning of the scheduled procedure.
Inflammatory markers: Enzyme linked immunosorbent assay (ELISA) method (R & D Systems Inc., Minneapolis, MN) was used to determine serum levels of Tumor Necrosis Factor –α Receptor1 (TNF-αR1), TNF-αR2, and serum interleukin 6 receptor (sIL-6R DR 600) from the blood samples obtained after overnight fast. The samples were stored at −70°C Upon arrival in the laboratory, the samples were centrifuged at 2000 Gs at +4°C for 15 to 20 minutes. The lower detectable limit was 6.5 pg/ml for sIL-6R DR 600, 6.7 pg/ml for TNF-αR1 and 2.3 pg/ml for TNF-αR2. The interassay coefficient of variation was < 6.7% for all three assays. Measuring serum level of Tumor Necrosis Factor –α (TNF-α) is notoriously difficult and unreliable, therefore, it was excluded and serum interleukin 6 (sIL-6) was measured for descriptive purposes only. Serum inflammatory markers level data were available up to July, 2005 and provided data for a total of 188 participants. This is 36% of the total sample. The distribution in the 5 quintile groups was quite compatible and was as follows: 30%, 37%, 34%, 44% and 32%.
Peripheral nerve function: Peripheral nerve function was examined for sural and peroneal nerves using a standardized neurophysiological technique described by Aminoff [3] (Nicolet Viking Select, Madison, WI). Testing was performed on the right leg unless contraindicated. Contraindications included amputation, ulcer, trauma, knee replacement, or surgery. If the initial limb temperature was below 32°C, the leg was heated with a heating pad until 32°C was achieved. The skin was cleaned with alcohol or a degreaser. Surface electrodes were placed on the testing leg with conducting gel. For peroneal nerve testing, recording electrode was placed on the extensor digiti minimi belly and the stimulating electrode was placed on the nerve where it winds around the fibular head. Distal stimulation was applied at 8.5 cm proximal to the recording electrode, lateral to the tibialis anterior tendon, and the ground was placed on the 5th metatarso-phalangeal joint, lateral to the long extensor tendons. For sural nerve testing, the recording electrode was applied approximately 2 cm behind the lateral malleolus and the ground was placed four centimeters more distal on the foot (usually directly below the lateral malleolus). The stimulation electrode was applied 10 cm proximal to the recording site. Nerve conduction velocity (NCV) and signal amplitude (Amp) were measured for both, sural and peroneal nerves from sensory action potential and compound muscle action potential, respectively. Amplitude measurements were performed all at the same sweep speed of final waveform acquisition. NCV was calculated in m/s and approximated to nearest one decimal [3] (n = 442).
Movement time was measured using a finger tapping test of the dominant hand [5]. The wrist was rested on the table and the participant was instructed to tap as quickly as possible in a continuous succession with his/her index finger, on the spacebar key of the desktop key board. The total number of taps (TFT) in ten seconds was counted by the computer. The current finger tapping test was introduced in the BLSA protocol in February 2004, which is after the vibrotactile testing was introduced. Therefore, only 325 participants had data on finger tapping. Cognitive function of the participants was evaluated using the Short Blessed Test (SBT) (n = 419) [20].
Height and body weight were measured to the nearest 0.5 cm and 0.1 kg, respectively. Body Mass Index was calculated as weight divided by height squared (kg/m2).
2.3 Statistical analysis
All statistical analyses were conducted using SPSS version 13.0. Data are presented as means ± SD unless mentioned otherwise. Distributions of continuous variables were tested for normality and, as appropriate, non-parametric tests or log10 transformations of skewed variables (fasting glucose, Glucose120, TNFα-R1, TNFα-R2, SuralAmp and PeronealAmp) were used in subsequent analyses. The participants were stratified in four age groups (20–40, 40–60, 60–80 and >80 years). General Linear Model (GLM) was used to test for age-group differences. Analysis of covariance was performed in GLM to test for differences between groups while adjusting for potential confounders. Relationships between continuous variables were assessed using Pearson correlation coefficients. Multiple linear regression models were constructed to identify factors independently associated with VPT. For regression analyses, missing values were adjusted as the average values calculated from the respective age-group. A p <0.05 was considered statistically significant. Structural equation modeling [11] was used to describe relationships between the dependent and independent variables, taking into account the inter-relationships between the independent variables. The correlation matrix was used in the analysis, because of convergence problems using the covariance matrix which resulted from the marked differences in the size of the variances for different variables. The model fit statistics, standard error and standardized correlation coefficients were estimated. A non-significant χ2 test (p >0.05) implied that the model was consistent with the underlying correlation matrix.
3. Results
Vibration perception threshold data were log10 transformed to achieve normal distribution (logVPT) (Figure 1). Table 1 describes the study population according to VPT quintiles. The average age, height, Glucose120, TNF-αR1 and TNF-αR2 were significantly higher with higher VPT. In contrast, mean Sural and Peroneal Amp, PeronealNCV and TFT tended to be lower with higher VPT (Table 1).
Figure 1.
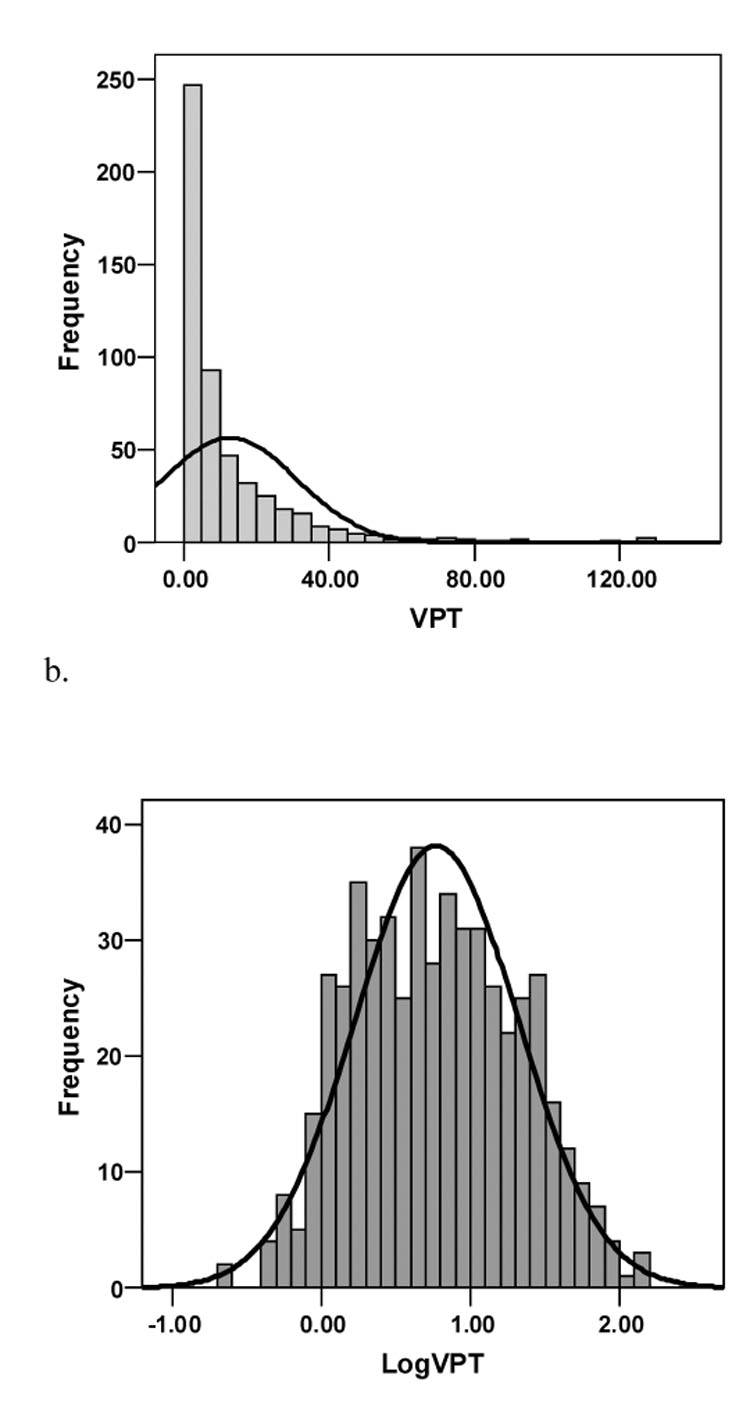
Vibration perception threshold (VPT) data were significantly skewed (a). Therefore, data were log10 transformed to achieve normal distribution (logVPT) (b).
Table 1.
Population characteristics (±SD) according to quintiles of logVPT. χ2 test was used to identify gender differences and Kruskal-Wallis test was used for fasting glucose, Glucose120, sIL-6, TNF-αR1, TNF-αR2, SuralAmp and PeronealAmp due to their skewed distribution. Abbreviations are explained in the footnote.
| Variable | Overall | 1st | 2nd | 3rd | 4th | 5th | p |
|---|---|---|---|---|---|---|---|
| Age (yrs) | 67.6 ± 14.5 | 56.6 ± 15.5 | 61.9 ± 13.0 | 67.2 ± 10.5 | 74.2 ± 10.2 | 78.5 ± 10.7 | < 0.001 |
| Gender (f/m) | 263/260 | 73/34 | 55/48 | 56/48 | 47/58 | 32/72 | < 0.001 |
| Height (cm) | 168.88 ± 9.46 | 166.96 ± 8.06 | 169.22 ± 9.94 | 168.06 ± 8.77 | 168.93 ± 9.99 | 171.29 ± 10.07 | 0.018 |
| BMI (kg/m2) | 26.11 ± 4.43 | 26.75 ± 6.11 | 27.25 ± 4.72 | 26.97 ± 4.61 | 26.60 ± 4.05 | 26.60 ± 4.05 | 0.522 |
| Fasting Glucose (mg/dl) | 94.69 ± 15.24 | 93.78 ± 18.52 | 92.73 ± 10.41 | 96.90 ± 13.65 | 95.48 ± 17.63 | 94.54 ± 14.46 | 0.061 |
| Glucose120 (mg/dl) | 125.97 ± 52.36 | 122.67 ± 54.64 | 110.18 ± 36.25 | 131.69 ± 59.05 | 130.26 ± 53.46 | 136.51 ± 52.38 | 0.003 |
| sIL-6 (pg/ml) | 2.32 ± 1.55 | 1.65 ± 1.00 | 2.04 ± 1.25 | 2.39 ± 1.47 | 2.41 ± 1.69 | 3.07 ± 1.87 | < 0.001 |
| sIL-6R (pg/ml) | 35259.9 ± 9337.3 | 34147.6 ± 8034.6 | 34429.4 ± 9019.0 | 36451.8 ± 10795.4 | 33353.6 ± 7309.6 | 372888.6 ± 103888.1 | 0.326 |
| TNF-αR1 (pg/ml) | 1548.64 ± 554.31 | 1309.17 ± 235.81 | 1373.07 ± 281.38 | 1467.57 ± 486.88 | 1536.79 ± 286.46 | 2012.53 ± 829.86 | < 0.001 |
| TNF-αR2 (pg/ml) | 2610.54 ± 1016.77 | 2171.23 ± 410.00 | 2266.62 ± 466.99 | 2510.67 ± 1056.88 | 2499.44 ± 512.16 | 3500.35 ± 1421.63 | < 0.001 |
| SuralNCV (m/s) | 46.4 ± 7.6 | 47.4 ± 7.1 | 46.8 ± 6.4 | 46.1 ± 7.7 | 45.9 ± 8.0 | 45.8 ± 9.1 | 0.600 |
| SuralAmp (mV) | 8.44 ± 7.64 | 10.66 ± 9.46 | 9.36 ± 8.57 | 9.08 ± 7.68 | 7.03 ± 5.39 | 5.09 ± 3.63 | < 0.001 |
| PeronealNCV (m/s) | 47.4 ± 7.4 | 50.0 ± 5.7 | 49.2 ± 7.3 | 48.2 ± 5.4 | 45.7 ± 5.8 | 43.2 ± 9.9 | < 0.001 |
| PeronealAmp (mV) | 3.8 ± 2.4 | 4.85 ± 2.38 | 4.33 ± 2.64 | 4.13 ± 2.12 | 3.3 ± 1.7 | 2.3 ± 1.9 | < 0.001 |
| TFT | 23.6 ± 3.9 | 24.3 ± 3.9 | 24.4 ± 4.1 | 23.7 ± 3.7 | 22.6 ± 3.6 | 23.1 ± 3.6 | 0.037 |
| SBT | 1.4 ± 1.8 | 1.0 ± 1.1 | 1.3 ± 2.1 | 1.5 ± 1.8 | 1.5 ± 1.9 | 1.6 ± 1.9 | 0.432 |
Abbreviations: Glucose120: serum glucose at 120 minutes of the oral glucose tolerance test
sIL-6: Serum Interleukin-6
sIL-6R: Serum Interleukin-6 Receptor
TNF-αR1: Tumor necrosis factor- α receptor 1
TNF-αR2: Tumor necrosis factor- α receptor 2
SuralNCV: Sural nerve conduction velocity
SuralAmp: Sural nerve amplitude
peronealNCV: Peroneal nerve conduction velocity
PeronealAmp: Peroneal nerve amplitude
TFT: Total finger taps
SBT: Short Blessed test
Older age (F(3,515) = 71.987, p < 0.001) and male gender (F(1,515) = 17.302, p < 0.001) were independently associated with higher VPT (Figure 2). A lack of age x gender interaction (F(3,515) = 0.342, p = 0.795) suggested that the slope of age-related decline in vibrotactile sensitivity is similar in the two sexes. After adjusting for differences between genders in age and height, gender was no longer a significant independent correlate of logVPT (F(1,504) = 0.0230, p = 0.879). In the final multivariate model, age and height, but not sex, were significant covariates of logVPT (F(1,504) = 256.977, p < 0.001 and (F(1,504) = 25.514, p < 0.001, respectively). Based on these findings, correlation analyses were performed with the genders pooled.
Figure 2.

Vibrotactile sensitivity according to age and gender groups. The vibration perception thresholds (VPT) are plotted on a logarithmic scale scale. Tukey’s post hoc analysis demonstrated significant difference between age groups. Vibration thresholds were significantly higher in males. Black bars represent women and grey bars represent men.
Bivariate correlation analysis demonstrated a significant association between logVPT and age. In addition, height, logGlucose120, logTNFα-R1, logTNFα-R2, logSuralAmp, PeronealNCV, logPeronealAmp, TFT and SBT were significantly correlated with both age and logVPT (Table 2).
Table 2.
Bivariate correlation coefficients of study variables with age and VPT. The abbreviations are explained in the Table 1 footnote.
| Variable | Pearson correlation coefficient(r) with logVPT | Pearson correlation coefficient(r) with Age |
|---|---|---|
| Age | 0.566** | |
| Height | 0.133** | −0.195** |
| BMI | 0.019 | −0.027 |
| logFastingGlucose | 0.069 | 0.091* |
| logGlucose120 | 0.144** | 0.228** |
| sIL-6R | 0.085 | 0.139 |
| logTNFα-R1 | 0.484** | 0.541** |
| logTNFα-R2 | 0.478** | 0.527** |
| Sural NCV | 0.075 | 0.083 |
| logSuralAmp | −0.238** | −0.259** |
| Peroneal NCV | −0.357** | −0.303** |
| logPeronealAmp | −0.420** | −0.433** |
| TFT | −0.168** | −0.329** |
| SBT | 0.098* | 0.207** |
p < 0.05
p < 0.001
In linear regression analysis, age explained 32% of the variance in logVPT (β coefficient = 0.021 ± 0.001, p < 0.001). After including height, gender and BMI as main effects in the linear regression model (Table 3, model 1) the percent variance explained in logVPT increased to 38%. Age and height but not gender and BMI were independently associated with logVPT as suggested by the corresponding p values (Table 3, model 1).
Table 3.
Multiple linear regression factors associated with vibrotactile sensitivity. The abbreviations are explained in the Table 1 footnote.
| variable | Model 1 | Model 2 | Model 3 | |||
|---|---|---|---|---|---|---|
| β ± SE | p | β ± SE | p | β ± SE | p | |
| Age | 0.023 ± 0.001 | < 0.001 | 0.018 ± 0.001 | < 0.001 | 0.020 ± 0.001 | < 0.001 |
| Height | 0.015 ± 0.002 | < 0.001 | 0.012 ± 0.002 | < 0.001 | 0.011 ± 0.002 | < 0.001 |
| Gender | −0.002 ± 0.038 | 0.958 | −0.006 ± 0.038 | 0.877 | 0.004 ± 0.037 | 0.911 |
| BMI | 0.003 ± 0.003 | 0.281 | 0.003 ± 0.003 | 0.293 | 0.004 ± 0.003 | 0.191 |
| logGlucose120 | 0.072 ± 0.099 | 0.471 | ||||
| logTNF-αR1 | 0.508 ± 0.312 | 0.104 | ||||
| logTNF-αR2 | 0.289 ± 0.227 | 0.297 | ||||
| logSuralAmp | −0.011 ± 0.051 | 0.831 | ||||
| PeronealNCV | −0.008 ± 0.002 | < 0.001 | −0.009 ± 0.002 | < 0.001 | ||
| logPeronealAmp | −0.221 ± 0.047 | < 0.001 | −0.236 ± 0.047 | < 0.001 | ||
| TFT | −0.005 ± 0.005 | 0.249 | ||||
| SBT | 0.008 ± 0.008 | 0.344 | ||||
| Constant | −3.351 ± 0.349 | < 0.001 | −4.687± 0.770 | < 0.001 | −2.082 ± 0.394 | < 0.001 |
In further analyses, the variables that were found to be associated with both age and logVPT (logGlucose120, logTNF-αR1, logTNF-αR2, logSuralAmp, PeronealNCV, logPeronealAmp, TFT and SBT scores) were introduced as main effects in a multiple regression model predicting VPT in addition to age, height, gender and BMI, (Table 3, model 2). Beyond age and height, only PeronealNCV and logPeronealAmp were found to be independent predictors of logVPT. Consequently, only demographic variables (age, height, gender and BMI) and Peroneal NCV and logPeronealAmp were retained in the final model (Table 3, model 3). This model could explain 40.8% of variance in logVPT.
We fitted a structural equation model summarizing the overall relationship between age, height, fasting glucose, Glucose120 and latent variables Inflammatory Markers, Peripheral Nerve Function and Central Nervous System function (Figure 3). The latent variables were estimated from the measured variables of common characteristics (shown in small rectangles with dashed arrows going from the respective latent variable to the measured variables). The model was based on assumptions that age would directly influence the other variables and the latent and other variables would influence logVPT. The directionality of the relationships was assigned based on theoretical assumptions. Gender and BMI were eliminated from the model because they did not contribute to the fit. A high correlation between SuralNCV and logSuralAmp introduced a bias on its latent variable (Peripheral Nerve Function). Since SuralNCV was neither associated with age nor with VPT, it was removed from the model.In this model (Figure 3) age directly influenced height, Glucose120, Inflammatory Markers, Peripheral Nerve Function and Central Nervous System function. No direct association was found between age and logVPT. Peripheral Nerve Function was the only variable that was significantly directly associated (negatively) with logVPT. Inflammatory Markers negatively impacted Peripheral Nerve Function Height had an inverse effect on Peripheral Nerve Function and a positive influence of CNS function.
Figure 3.
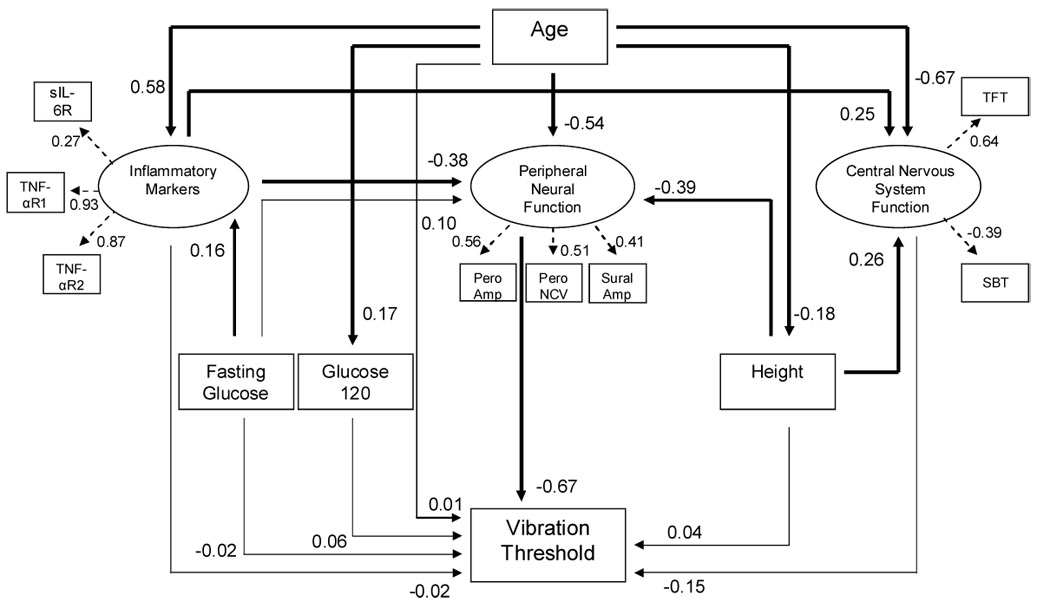
Structural equation model displays the relationships among the vibration perception threshold and age, inflammatory markers, peripheral neural function, central nervous system function, glucose120 and height (χ2 = 45.283, df = 40, p = 0.261). The arrows denote the assigned direction of the relationship between the variables that was based on theoretical perspective. The numbers denote standardized correlation coefficients. The variables at the head of the dashed arrows show the measured variables that contributed to estimation of the respective latent variable. Thick lines represent statistically significant standardized correlation coefficients and thin lines represent non-significant standardized correlation coefficients. Abbreviations are explained in the footnote.
Fasting glucose or Glucose120 were not associated with vibration threshold. To get further insight in this finding, participants were stratified into normals, an impaired glucose tolerance (IGT) and diabetes mellitus (DM) [25]. The VPT was significantly higher in IGT and DM groups compared to the normals (p = 0.046 and 0.040, respectively). Adjusting for age, the trend was no longer statistically significant. However, this finding should be interpreted with caution due to the limited number of diabetic participants in our population.
4 Discussion
Using cross-sectional data collected from a population based sample we found a progressively increasing loss of vibrotactile sensitivity with age across the adult lifespan. The age-associated decline was found to be similar in men and women. When controlled for age and height differences, VPTs were comparable in the two sexes. Glucose120, circulating levels of inflammatory markers TNF-αR1 and TNF-αR2, peripheral nerve function variables such as signal amplitude of sural and peroneal nerves, peroneal nerve conduction velocity, movement time and cognition were associated with vibrotactile sensitivity and age. Age, height, peronealNCV and peroneal nerve amplitude were independently associated with vibrotactile sensitivity. Structural equation analysis suggested that peripheral neural function may directly impact vibrotactile sensitivity, whereas age, inflammatory markers and height possibly exerted their influence on VPT through their association with peripheral nerve function.
Age significantly influences morphology and function of the nervous system. Since quantitative sensory testing captures the overall function of the sensory neuroanatomical circuitry, age-related decline detected in our study could potentially arise from deterioration in multiple components of the sensory pathway, ranging from structural deformation and reduced density of sensory receptors to degraded information processing in the somatosensory cortex [23]. Studies investigating aging effects on spatial and temporal summation characteristics of the P channels that are mediated by Pacinian corpuscles and their corresponding nerve fibers suggest that the primary factor responsible for elevation in the detection thresholds of high frequency vibration in older subjects is a reduced afferent input to central nervous system (CNS) [12,13]. It has been also hypothesized that age-related reduction in receptor density, morphological modification of the surviving receptors, and possibly degeneration of corresponding peripheral nerve fibers may all contribute to the decline in tactile and proprioceptive sensitivity that is often observed in older persons [12,21,38].
The relationship observed between the logVPT and age is consistent with previous findings of an accelerated loss of vibrotactile sensitivity in the thenar eminence over the aging process [38] and is also in line with the measurements used for quantifying other sensory functions such as auditory function [7] or visual contrast sensitivity [26]. Notably, the age-associated decline in tactile sensitivity is steeper for vibration compared to other sensory modalities such as touch [34] and age contributes the most to increase in vibration threshold [8,23] leading to suggestions that the decline in vibrotactile sensitivity is an inherent manifestation of nervous system aging. Functionally, impaired vibrotactile sensitivity in older adults is associated with increased falls [24] and impaired compensatory stepping responses [28]. Therefore, it would of great interest to develop protocols for early identification of older persons with impaired vibrotactile sensitivity that can benefit from interventions aimed at reducing the risk of falls.
It has been previously demonstrated that height, which affects the length of peripheral nerves, may substantially influence measures of sensitivity [16,32]. Accordingly, in our study height was significantly associated with tactile sensitivity. This is also in accordance with the studies that showed a significant relationship between the height and vibration perception thresholds tested at the medial malleolus or great toe [8,16,17]. Thus our findings support the notion that in addition to age, height of the participant should be considered as an important covariate while interpreting results of vibration perception threshold for clinical purposes, particularly when sensitivity is tested on distal sites of the lower limb.
The evidence for a gender effect on VPT is not clear in literature. Lin et al.[23] reported a significant effect of gender on vibration threshold measured at the lateral malleolus. However, the authors neither mentioned the direction of this relationship nor did they control for height differences between men and women. In our study, males demonstrated significantly higher VPTs. However, males were also significantly older and taller than the females. After adjusting for age and height sex-related difference disappeared.
In the multiple regression analysis (Table 3, model 3) age, height, PeronealNCV and PeronealAmp were independently associated with logVPT. Age accounted for most of the explained variance (32%). When adjusted for age, height accounted for 6% of the explained variance, whereas peroneal nerve conduction parameters accounted for only 2.8% of variance in logVPT (Table 4). We also found that Glucose120, TNF-αR1, TNF-αR2, SuralAmp, Total Finger Taps and Short Blessed Test scores were not independently associated with the vibrotactile sensitivity. However, a potential indirect contribution, particularly of inflammatory markers, should not be ruled out as the correlation matrix demonstrated a significant negative association of TNF-αR1 and TNF-αR2 with Peroneal nerve conduction parameters (r = −0.277 to −0.337; p < 0.001).
Table 4.
r2 obtained from main effect multiple regression analyses by successively adding independent variables.
| Model | Variables | r2 |
|---|---|---|
| 1 | Age | 0.320 |
| 2 | Age, height | 0.380 |
| 3 | Age, height, Gender | 0.380 |
| 4 | Age, height, Gender, BMI | 0.380 |
| 5 | Age, height, Gender, BMI, Peroneal Nerve Function* | 0.408 |
Peripheral Nerve Function: PeronealNCV and logPeronealAmp
Structural equation analysis was used to better understand the relationship of vibrotactile sensitivity with the multiple variables in the structural equation model. Unlike multiple linear regression analysis, structural equation analysis takes into consideration the dynamics of the relationship among the independent variables and therefore allows for the evaluation of direct (independent) as well as potential indirect influences of independent variables on dependent variables. We used a model that was based on the theoretical construct of the complex relationships between the multiple variables (Figure 3). We assumed that the inflammatory markers had a common feature that could be represented by a single latent variable that has been designated “Inflammatory Markers”. Likewise, the peripheral nerve measurements were represented by “Peripheral Nerve Function”, and the tapping test and Short Blessed mental test were together represented by “Central Nervous System Function”. Age exerted a direct influence on Glucose120, Inflammatory Markers, Peripheral Nerve Function, height and Central Nervous System function [5,6,29,30,32]. When the mediating effect of these variables was accounted for, we found no residual direct effect of age on vibration threshold. Noteworthy, Peripheral Nerve Function was the only variable that exerted a direct influence (inverse) on vibration perception threshold in the model model. Thus, our findings support the results of previous research that suggested a primary role of reduced afferent input to central nervous system centers in age-related decline in vibrotactile sensitivity [12,39]. Our research suggests that age, height and inflammatory markers may not be directly associated with the decline in vibrotactile sensitivity. However, they could possibly contribute through their effects on peripheral nerve function (figure 3). A problem with this interpretation is that our study did not directly measure the function of the tibial nerve or its branch, the medial plantar cutaneous nerve that supplies the foot sole which is where the tactile sensitivity was measured. However, the assessment of sural and peroneal nerves is generally considered a standard practice for getting insight into overall lower limb peripheral nerve function. It is important to underline that the results of the structural equation model do not prove causal relationships as the model is based on a correlation analysis. However, since the directionality of the relationships between the variables was ‘apriori’ before fitting the statistical model, the results reasonably support the underlying mechanisms.
Contrary to our initial hypothesis, we failed to demonstrate an effect of Glucose120 on vibration perception threshold. However, previous studies have shown significantly better peripheral nerve conduction in individuals with IGT and DM on controlled diet and exercise regime [9,14]. As mentioned in the results section, this unexpected finding may be due to sample size limitations.
Although, we were unable to demonstrate a significant direct association of the Central Nervous System function on VPT (Figure 3), a role of the central nervous system in the age-related decline in detection of tactile stimulus cannot be ruled out. It is possible that the two measures of central nervous system function that we used did not sufficiently capture the components of tactile processing. Nonetheless, a considerable inverse association with vibrotactile sensitivity suggests a connection between efferent and afferent function, and possibly an overall delay in information processing. The structural equation analysis also demonstrated that height had a positive association with central nervous system function. Similar relationship has been previously described in older adults, in cross-sectional as well as prospective studies, particularly with respect to cognitive function [1,22]. Interestingly, we could not find an evidence of the positive relationship between Inflammatory Markers and Central Nervous System function.
The main limitation of the study is that other variables that can potentially influence vibration perception threshold, such as status of peripheral arterial circulation, skin thickness and receptor density were not taken into consideration. Inclusion of these variables could possibly help in explaining a much larger variance in vibrotactile sensitivity. In addition, because of the cross-sectional nature of our analysis, the extent of the causal relationship can be reasonably hypothesized but not definitely demonstrated.
In conclusion, various factors may contribute to age-related decline in cutaneous vibrotactile sensitivity, as measured by threshold for perception of vibration. The results of this study indicate that decline in peripheral nerve function has a direct bearing on age related decline in vibrotactile sensitivity. The model suggested that height and circulating inflammatory markers may further influence age related decline in vibrotactile sensitivity through their negative impact on peripheral nerve function.
Acknowledgements
The BLSA research was conducted as a component of the Intramural Research Program of the National Institute on Aging.
Footnotes
Publisher's Disclaimer: This is a PDF file of an unedited manuscript that has been accepted for publication. As a service to our customers we are providing this early version of the manuscript. The manuscript will undergo copyediting, typesetting, and review of the resulting proof before it is published in its final citable form. Please note that during the production process errors may be discovered which could affect the content, and all legal disclaimers that apply to the journal pertain.
Disclosure Statement: All coauthors have seen and agree with the contents of the manuscript. There are no financial interests involved and this manuscript is not under review at any other publication.
Contributor Information
Dr Nandini Deshpande, Longitudinal Study Section, Clinical Research Branch, National Institute on Aging, National Institute of Health, Harbor Hospital, 3001 S. Hanover Street, Baltimore, MD 21225, USA, Tel: 410 350 7375, Fax: 410 350 7304, Email: deshpanden@mail.nih.gov.
Dr Jeffery Metter, Longitudinal Study Section, Clinical Research Branch, National Institute on Aging, National Institute of Health, Harbor Hospital, 3001 S. Hanover Street, Baltimore, MD 21225, USA, Tel: 410 350 3980, Fax: 410 350 7304.
Dr Shari Ling, Translational Research and Medical Services Section, Clinical Research Branch, National Institute on Aging, National Institute of Health, Harbor Hospital, 3001 S. Hanover Street, Baltimore, MD 21225, USA, Tel: 410 350 3934, Fax: 410 350 7304.
Dr Robin Conwit, National Institute of Neurological Disorders and Stroke, National Institutes of Health, Neuroscience Center, Bethesda, MD 20850, USA, Tel: 301-496-9135, Fax: 301-480-1080.
Dr Luigi Ferrucci, Longitudinal Study Section, Clinical Research Branch, National Institute on Aging, National Institute of Health, Harbor Hospital, 3001 S. Hanover Street, Baltimore, MD 21225, USA, Tel: 410 350 3936, Fax: 410 350 7304.
References
- 1.Abbott RD, White LR, Ross GW, Petrovitch H, Masaki KH, Snowdon DA, Curb JD. Height as a marker of childhood development and late-life cognitive function: the Honolulu-Asia Aging Study. Pediatrics. 1998;102(3 Pt 1):602–609. doi: 10.1542/peds.102.3.602. [DOI] [PubMed] [Google Scholar]
- 2.Akiyama H, Barger S, Barnum S, Bradt B, Bauer J, Cole GM, Cooper NR, Eikelenboom P, Emmerling M, Fiebich BL, Finch CE, Frautschy S, Griffin WS, Hampel H, Hull M, Landreth G, Lue L, Mrak R, Mackenzie IR, McGeer PL, O'Banion MK, Pachter J, Pasinetti G, Plata-Salaman C, Rogers J, Rydel R, Shen Y, Streit W, Strohmeyer R, Tooyoma I, Van Muiswinkel FL, Veerhuis R, Walker D, Webster S, Wegrzyniak B, Wenk G, Wyss-Coray T. Inflammation and Alzheimer's disease. Neurobiol Aging. 2000;21(3):383–421. doi: 10.1016/s0197-4580(00)00124-x. [DOI] [PMC free article] [PubMed] [Google Scholar]
- 3.Aminoff M. In: Clinical Electromyography in Clinical Practice. 3rd Edition. Aminoff Michael., editor. Churchill-Livingstone: 1998. pp. 488–489. [Google Scholar]
- 4.Caruso C, Candore G, Colonna-Romano G, Lio D, Franceschi C. Inflammation and life-span. Science. 2005;14(3075707):208–209. doi: 10.1126/science.307.5707.208. [DOI] [PubMed] [Google Scholar]
- 5.Cousins MS, Corrow C, Finn M, Salamone JD. Temporal measures of human finger tapping: effects of age. Pharmacol Biochem Behav. 1998;59(2):445–449. doi: 10.1016/s0091-3057(97)00443-7. [DOI] [PubMed] [Google Scholar]
- 6.Di Iorio A, Cherubini A, Volpato S, Sparvieri E, Lauretani F, Franceschi C, Senin U, Abate G, Paganelli R, Martin A, Andres-Lacueva C, Ferrucci L. Markers of inflammation, Vitamin E and peripheral nervous system function The InCHIANTI study. Neurobiol Aging. 2006;27(9):1280–1288. doi: 10.1016/j.neurobiolaging.2005.07.004. [DOI] [PMC free article] [PubMed] [Google Scholar]
- 7.Divenyi PL, Stark PB, Haupt KM. Decline of speech understanding and auditory thresholds in the elderly. J Acoust Soc Am. 2005;118(2):1089–1100. doi: 10.1121/1.1953207. [DOI] [PMC free article] [PubMed] [Google Scholar]
- 8.Era P, Jokela J, Suominen H, Heikkinen E. Correlates of vibrotactile thresholds in men of different ages. Acta Neurol Scand. 1986;74(3):210–217. doi: 10.1111/j.1600-0404.1986.tb07857.x. [DOI] [PubMed] [Google Scholar]
- 9.Eriksson KF, Nilsson V, Lindgarde F, Osterlin S, Dahlin LB, Lilja B, Rosen I, Sundkvist G. Diabetes mellitus but not impaired glucose tolerance is associated with dysfunction in peripheral nerves. Diabet Med. 1994;11(3):279–285. doi: 10.1111/j.1464-5491.1994.tb00272.x. [DOI] [PubMed] [Google Scholar]
- 10.Fotin-Mleczek M, Henkler F, Samel D, Reichwein M, Hausser A, Parmryd I, Scheurich P, Schmid JA, Wajant H. Apoptotic crosstalk of TNF receptors: TNF-R2-induces depletion of TRAF2 and IAP proteins and accelerates TNF-R1-dependent activation of caspase-8. J Cell Sci. 2002;1(115Pt 13):2757–2770. doi: 10.1242/jcs.115.13.2757. [DOI] [PubMed] [Google Scholar]
- 11.Fox J. An R and S-PLUS companion to applied regression. Sage Publications. 2002 [Google Scholar]
- 12.Gescheider GA, Edwards RR, Lackner EA, Bolanowski SJ, Verrillo RT. The effects of aging on information-processing channels in the sense of touch:III. Differential sensitivity to changes in stimulus intensity. Somatosens Mot Res. 1996;13(1):73–80. doi: 10.3109/08990229609028914. [DOI] [PubMed] [Google Scholar]
- 13.Gescheider GA, Beiles EJ, Checkosky CM, Bolanowski SJ, Verrillo RT. The effects of aging on information-processing channels in the sense of touch:II. Temporal summation in the P channel. Somatosens Mot Res. 1994;11(4):359–365. doi: 10.3109/08990229409028879. [DOI] [PubMed] [Google Scholar]
- 14.Gordon SA, Robinson SJ. Idiopathic neuropathy, prediabetes and the metabolic syndrome. J Neurol Sci. 2006;242(1–2):9–14. doi: 10.1016/j.jns.2005.11.020. [DOI] [PubMed] [Google Scholar]
- 15.Greenstein J, Kavanagh P, Rowe MJ. Phase coherence in vibration-induced responses of tactile fibres associated with Pacinian corpuscle receptors in the cat. J Physiol. 1987;386:263–275. doi: 10.1113/jphysiol.1987.sp016533. [DOI] [PMC free article] [PubMed] [Google Scholar]
- 16.Gerr F, Letz R. Covariates of human peripheral nerve function: II. Vibrotactile and thermal thresholds. Neurotoxicol Teratol. 1994;16(1):105–112. doi: 10.1016/0892-0362(94)90015-9. [DOI] [PubMed] [Google Scholar]
- 17.Inami K, Chiba K, Toyama Y. Determination of reference intervals for vibratory perception thresholds of the lower extremities in normal subjects. J Orthop Sci. 2005;10(3):291–297. doi: 10.1007/s00776-005-0897-5. [DOI] [PubMed] [Google Scholar]
- 18.Kamei N, Yamane K, Nakanishi S, Yamashita Y, Tamura T, Ohshita K, Watanabe H, Fujikawa R, Okubo M, Kohno N. Effectiveness of Semmes-Weinstein monofilament examination for diabetic peripheral neuropathy screening. J Diabetes Complications. 2005;19(1):47–53. doi: 10.1016/j.jdiacomp.2003.12.006. [DOI] [PubMed] [Google Scholar]
- 19.Kandel ER. Principles of neural sciences. 4th edition. New York: Mc Graw-Hill; 2000. [Google Scholar]
- 20.Katzman R, Brown T, Fuld P, Peck A, Schechter R, Schimmel H. Validation of a short orientation-memory-concentration test of cognitive impairment. American Journal Psvchiatrv. 1983;140(6):734–739. doi: 10.1176/ajp.140.6.734. [DOI] [PubMed] [Google Scholar]
- 21.Kenshalo DR., Sr. Somesthetic sensitivity in young and elderly humans. J Gerontol. 1986;41(6):732–742. doi: 10.1093/geronj/41.6.732. [DOI] [PubMed] [Google Scholar]
- 22.Kim JM, Stewart R, Shin IS, Yoon JS. Limb length and dementia in an older Korean population. J Neurol Neurosurg Psychiatry. 2003;74(4):427–432. doi: 10.1136/jnnp.74.4.427. [DOI] [PMC free article] [PubMed] [Google Scholar]
- 23.Lin YH, Hsieh SC, Chao CC, Chang YC, Hsieh ST. Influence of aging on thermal and vibratory thresholds of quantitative sensory testing. JPNS. 2005;10:269–281. doi: 10.1111/j.1085-9489.2005.10305.x. [DOI] [PubMed] [Google Scholar]
- 24.Lord SR, Ward JA, Williams P, Anstey KJ. Physiological factors associated with falls in older community-dwelling women. J Am Geriatr Soc. 1994;42(10):1110–1117. doi: 10.1111/j.1532-5415.1994.tb06218.x. [DOI] [PubMed] [Google Scholar]
- 25.Mayfield J. Diagnosis and classification of diabetes mellitus: new criteria. Am Fam Physician. 1998;58(6):1355–1370. [PubMed] [Google Scholar]
- 26.Pelli DG, Robson JG, Wilkins AJ. The design of a new letter chart for measuring contrast sensitivity. Clin Vision Sci. 1988;2(3):187–199. [Google Scholar]
- 27.Perry SD. Evaluation of age-related plantar-surface insensitivity and onset age of advanced insensitivity in older adults using vibratory and touch sensation tests. Neurosci Lett. 2006;392(1–2):62–67. doi: 10.1016/j.neulet.2005.08.060. [DOI] [PubMed] [Google Scholar]
- 28.Perry SD, McIlroy WE, Maki BE. The role of plantar cutaneous mechanoreceptors in the control of compensatory stepping reactions evoked by unpredictable, multidirectional perturbation. Brain Res. 2000;877(2):401–406. doi: 10.1016/s0006-8993(00)02712-8. [DOI] [PubMed] [Google Scholar]
- 29.Peters R. Ageing and the brain. Postgrad Med J. 2006;82(964):84–88. doi: 10.1136/pgmj.2005.036665. Review. [DOI] [PMC free article] [PubMed] [Google Scholar]
- 30.Prolla TA, Mattson MP. Molecular mechanisms of brain aging and neurodegenerative disorders: lessons from dietary restriction. Trends Neurosci. 2001;24(11 Suppl):S21–S31. doi: 10.1016/s0166-2236(00)01957-3. Review. [DOI] [PubMed] [Google Scholar]
- 31.Resnick HE, Vinik AI, Schwartz AV, Leveille SG, Brancati FL, Balfour J, Guralnik JM. Independent effects of peripheral nerve dysfunction on lower-extremity physical function in old age: the Women's Health and Aging Study. Diabetes Care. 2000;23(11):1642–1647. doi: 10.2337/diacare.23.11.1642. [DOI] [PubMed] [Google Scholar]
- 32.Rivner MH, Swift TR, Malik K. Influence of age and height on nerve conduction. Muscle Nerve. 2001;24(9):1134–1141. doi: 10.1002/mus.1124. [DOI] [PubMed] [Google Scholar]
- 33.Sacks DB. In: Tietz textbook of clinical chemistry. 3rd ed. Burtis C, Ashwood E, editors. Philadelphia: WB Saunders; 1999. [Google Scholar]
- 34.Sands ML, Schwartz AV, Brown BW, Nevitt MC, Seeley DG, Kelsey JL. Relationship of neurological function and age in older women. The study of osteoporotic fractures. Neuroepidemiology. 1998;17(6):318–329. doi: 10.1159/000026186. [DOI] [PubMed] [Google Scholar]
- 35.Shock NWGR, Andres RA, Arenberg D, et al. Bethesda, MD: NIH; Design and operation of the Baltimore longitudinal study of aging. 1984
- 36.Sima AA, Calvani M, Mehra M, Amato A. Acetyl-L-Carnitine Study Group. Acetyl-L-carnitine improves pain, nerve regeneration, and vibratory perception in patients with chronic diabetic neuropathy: an analysis of two randomized placebo-controlled trials. Diabetes Care. 2005;28(1):89–94. doi: 10.2337/diacare.28.1.89. [DOI] [PubMed] [Google Scholar]
- 37.Van Dam PS, Van Asbeck BS, Erkelens DW, Marx JJ, Gispen WH, Bravenboer B. The role of oxidative stress in neuropathy and other diabetic complications. Diabetes Metab Rev. 1995;11(3):181–192. doi: 10.1002/dmr.5610110303. Review. [DOI] [PubMed] [Google Scholar]
- 38.Verrillo RT. Age related changes in the sensitivity to vibration. J Gerontol. 1980;35(2):185–193. doi: 10.1093/geronj/35.2.185. [DOI] [PubMed] [Google Scholar]
- 39.Viswanathan V, Seena R, Nair MB, Snehalatha C, Bhoopathy RM, Ramachandran A. Nerve conduction abnormalities in different stages of glucose intolerance. Neurol India. 2004;52(4):466–469. [PubMed] [Google Scholar]
- 40.Wells C, Ward LM, Chua R, Inglis JT. Regional variation and changes with ageing in vibrotactile sensitivity in the human footsole. J Gerontol A Biol Sci Med Sci. 2003;58(8):680–686. doi: 10.1093/gerona/58.8.b680. [DOI] [PubMed] [Google Scholar]