Abstract
The vibrational energy relaxation of carbon monoxide in the heme pocket of sperm whale myoglobin was studied by using molecular dynamics simulation and normal mode analysis methods. Molecular dynamics trajectories of solvated myoglobin were run at 300 K for both the δ- and ɛ-tautomers of the distal His-64. Vibrational population relaxation times of 335 ± 115 ps for the δ-tautomer and 640 ± 185 ps for the ɛ-tautomer were estimated by using the Landau–Teller model. Normal mode analysis was used to identify those protein residues that act as the primary “doorway” modes in the vibrational relaxation of the oscillator. Although the CO relaxation rates in both the ɛ- and δ-tautomers are similar in magnitude, the simulations predict that the vibrational relaxation of the CO is faster in the δ-tautomer with the distal His playing an important role in the energy relaxation mechanism. Time-resolved mid-IR absorbance measurements were performed on photolyzed carbonmonoxy hemoglobin (Hb13CO). From these measurements, a T1 time of 600 ± 150 ps was determined. The simulation and experimental estimates are compared and discussed.
Since the pioneering efforts of Landau and Teller (1), the problem of vibrational energy redistribution has attracted much theoretical attention (2–6). With the advent of ultrafast time-resolved IR spectroscopy, there is renewed interest in this problem as researchers can now probe directly the lifetimes of specific vibrational modes and, therefore, explore mechanisms of vibrational relaxation (7). In particular, the vibrational relaxation of metal carbonyl compounds has received considerable attention with CO population relaxation times (T1) found to range from the picosecond to nanosecond time scales, depending on the metal carbonyl and its surroundings (8). In that study, both chemical bonding and surrounding solvent were found to influence the vibrational relaxation time of the carbonyl. In addition to this seminal work, there have been several experimental probes of CO relaxation when bound to model heme compounds and heme proteins (9–11).
The vibrational relaxation of bound CO in heme proteins was found to be very fast (≈20 ps) compared to other CO ligated compounds. In addition, Fayer and coworkers found that (i) the T1 population relaxation time for the carbonyl ligand stretch is largely independent of temperature from 20 to 300 K (12); (ii) the vibrational lifetimes vary among different vibrational substates of the same protein (13); (iii) changes in the vibrational lifetime of bound CO are highly correlated with a change in the vibrational frequency of CO (13); and (iv) intermolecular transfer of vibrational energy is relatively unimportant in the relaxation process of bound CO (13).
Vibrational relaxation tends to be more efficient through strong covalent interactions, yet there is only one such interaction between the CO and the heme. To explain the fast relaxation of bound CO in heme proteins, it has been suggested that the manifold of vibrational states within the heme is responsible.
The absence of temperature-dependent relaxation up to 300 K suggests that these “bath” modes have frequencies greater than ≈400 cm−1 (13). This argument excludes the protein’s lowest frequency collective modes and indicates that the bath modes responsible for vibrational relaxation correspond to localized vibrations. One possibility is the Fe-C vibration at approximately 500 cm−1; frequency shifts in this mode have been shown to be inversely correlated with those in the CO stretch (14).
In contrast to the detailed picture that has emerged for energy relaxation of bound CO in heme proteins, little is known about CO energy relaxation in the photolyzed state, where CO is not covalently attached but is trapped within a docking site. The structure and dynamics of the photolyzed state have been recently probed using x-ray diffraction (15–18), vibrational spectroscopy (19–22) and computer simulation (23–25). Photolysis of heme proteins produces a small but significant population of CO in its excited vibrational state (21); its population dynamics can be probed to determine its rate of vibrational relaxation. Because the photodetached CO has no covalent interactions, its relaxation time T1 should be significantly longer than that observed in the bound state. Measurement of this relaxation time will give a picture of the role of the protein “solvent” in the relaxation of the CO.
In this note, we describe theoretical and experimental studies of the vibrational relaxation of photodissociated CO in the heme pocket of myoglobin. The empirical charmm potential energy function (26, 27) is used to model protein and solvent. It is combined with the CO potential of Straub and Karplus that accurately models the electrostatic potential and vibrational anharmonicity of the diatomic molecule. The CO dynamics is analyzed in terms of a Landau–Teller theory used to estimate the population relaxation time T1. Such a “classical” theory is expected to provide an accurate estimate of T1 when the system and bath are effectively harmonic and quantum corrections are small (28). Our results suggest that our computational model provides a reasonable estimate of the system dynamics and is well suited to identify putative doorway modes for vibrational relaxation.
Materials and Methods
Sample Preparation.
Human hemoglobin A (Hb) was prepared from the hemolysate of fresh red blood cells (29) and purified by chromatography on a DEAE-Sephacel column. The solution was dialyzed against D2O buffered with 0.1 M potassium phosphate, pD 7.5. The HbO2 was converted to Hb13CO by stirring under 1 atm of 13CO for 12 h. The final concentration of Hb13CO was ≈4 mM. The sample was loaded into a gas-tight IR cell comprised of two CaF2 windows separated by a 100-μm-thick spacer. The 13CO isotope was used instead of 12CO to shift the CO vibrational absorbance into a region with somewhat greater D2O transparency.
Time-Resolved Mid-IR Spectrometer.
Time-resolved mid-IR spectra of photolyzed HbCO were measured by using a transient spectrometer that has been described elsewhere (30). The sample cell was confined within a temperature-controlled enclosure set at 10°C and was rotated to provide a fresh sample volume for each photolysis pulse. The sample was photolyzed with picosecond laser pulses (35 ps, 527 nm) and probed with optically delayed femtosecond IR pulses (200 fs, ≈5 μm). The laser pulse photolyzed approximately 35% of the HbCO found within the probe-illuminated volume. For this study, a prism-based optical compressor minimized the chirp of the amplified continuum used to generate femtosecond mid-IR probe pulses, thereby shortening their duration to <200 fs and enlarging their bandwidth to ≥250 cm−1. After passing through the sample, the broadband IR probe pulse was spectrally dispersed with a monochromator (3 cm−1 bandpass) and its intensity was measured as a function of wavelength with a liquid-nitrogen-cooled InSb photodetector. The photodetector signal was normalized with respect to a reference signal to obtain the sample transmittance at a wavelength determined by the monochromator and delay time determined by an optical delay stage. The photolysis-induced change in the sample absorbance, ΔA, was computed from sample transmittances measured with and without the photolysis pulse. To maximize the signal level, the photolysis and probe pulses were polarized parallel to one another (21). The 1.5-kHz repetition frequency of the laser system permitted extensive signal averaging and contributed to the high quality time-resolved spectra reported here.
Computational Model of the Photolyzed State of Solvated Carbonmonoxy Myoglobin.
The computer simulation studies employed a computational model of the fully solvated myoglobin molecule. For the starting configuration, the 20 K x-ray structure of photolyzed carbonmonoxy myoglobin (Mb*CO) reported by Schlichting et al. (15) was used. The Mb*CO was introduced into a 56.570 × 56.570 × 37.712 Å3 box of equilibrated TIP3P water molecules. After removing water molecules lying within 2.5Å of the protein molecule, excess potential energy caused by bad contacts and strain was reduced by using the steepest descent method. This resulted in 2,553 protein and ligand atoms and 2,982 water molecules for a total of 11,499 atoms (24, 31).
By using classical molecular dynamics the system temperature was gradually raised to 300 K. Once a temperature of 300 K was achieved, molecular dynamics was run for 20 ps and the temperature was monitored. If a drift was detected, the velocities were resampled according to the Maxwell distribution. During the last 10 ps of the run such velocity reassignment was not necessary, indicating the system had relaxed to a near equilibrium state.
The molecular dynamics time step was 1.0 fs using the Verlet algorithm (32). The intermolecular potential was truncated at 10.5 Å. The three-site CO model of Straub and Karplus (23, 24), in which charges are centered on the carbon and oxygen atoms as well as the center of mass, was employed. The bond stretch was represented by the Huffaker RRKR potential (33). This simple model has been shown to reproduce the experimental dipole and quadrupole moments of the CO molecule, as well as ab initio interaction energies of CO with a variety of molecules, including water and formamide (23).
The computational model employed has been developed to describe local, high-frequency vibrations, such as those involving CC, CO, NH, and CH stretches, with good accuracy (typically within a few percent accuracy) (27). Lower-frequency motions on the order of hundreds of wavenumbers, such as torsional and out-of-plane ring bending motions, are typically within 10 percent accuracy. The greatest uncertainty is found in the modeling of the lowest-frequency motions (below 100 wavenumbers). Experimental comparisons have been carried out, and they suggest that empirical force field models, such as the one used in this study, can be reasonably accurate. However, the exact results are sensitive to the details of the treatment of the long-range electrostatic interactions (34, 35). In this study, we demonstrate that the CO stretching motion is most strongly coupled to the higher-frequency local modes (above 1,000 wavenumbers), which are those modes most accurately modeled by the force field employed.
Computational Method for Computing T1.
The most commonly employed model for vibrational population relaxation begins with the approximation that the system is well-described as an anharmonic oscillator bilinearly coupled to a bath of harmonic oscillators. Zwanzig (5) demonstrated that the classical dynamics of such a system can be represented exactly in the form of a generalized Langevin equation. For this model the relaxation has been shown to be approximated by a Landau–Teller result of the form (2, 6, 31, 36–42)
 |
1 |
where ζ(t) is the time-dependent friction acting on the oscillator, μ is the reduced mass, and ω0 is the frequency of the oscillator‖ as determined by the environment (43).
By the second fluctuation–dissipation theorem, the friction is proportional to the equilibrium time correlation function of the fluctuating force, δF = F − 〈F〉, acting on the oscillator
 |
2 |
This approximate model has been employed to study, among other systems (44–46), dioxygen relaxation in a rare gas solvent (38), and relaxation of a polar solute (methyl chloride) in a polar solvent (water) (41). The latter study found the Landau–Teller theory to be valid in that the simulation result of the vibrational energy relaxation was exponential in time and in good agreement with the Landau–Teller theoretical prediction. Subsequently, Bader and Berne demonstrated that this Landau–Teller expression is exact for both (i) a classical solute in a classical solvent and (ii) a quantum solute in a quantum solvent (28). Therefore, if the bath is well approximated as a set of bilinearly coupled harmonic oscillators, resulting in a Gaussian model of the fluctuating force autocorrelation function, the fully quantum result can be computed from a fully classical simulation. Considerable effort has been made to test, improve on, and extend this model (38–40, 47).
When the system dynamics is not exactly harmonic the model predictions will be approximate. What is the best estimate of the size of the quantum corrections to the classical Landau–Teller model? In general, it is not known how this should be done. However, Skinner and coworkers (48) have recently made careful comparisons of a number of models with experimental estimates for the rate of vibrational relaxation in neat, liquid dioxygen. For that system, they found the quantum corrections to be large and on the order of 2 × 10⁵. This and other work has raised questions concerning the accuracy of previous simulation estimates based on classical simulations interpreted using the Landau–Teller theory.
Compared with the systems mentioned above, the system studied here is a particularly good case for application of the Landau–Teller model owing to the predominately harmonic high frequency dynamics and weak coupling of the CO to the protein and solvent bath. That assertion is supported by the fact that preliminary estimates of the population relaxation time based on the Egelstaff theory show that it agrees with the Landau–Teller theory estimate to within a factor of three (J. L. Skinner, personal communication).
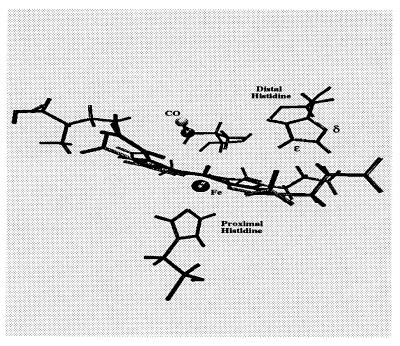
During the simulations the CO bond was constrained to its equilibrium length (1.128 Å) using the SHAKE algorithm and the force along the bond was determined. The force autocorrelation function and its Fourier transform were then computed and used to determine the time-dependent friction acting on the bond. This calculation was performed for both the δ- and ɛ-tautomers of the distal His (see Fig. 1) and used to compute T1 as a function of the oscillator frequency.
Figure 1.
A closeup of the carbonmonoxy myoglobin active site. The δ and ɛ symbols mark the location of the δ and ɛ nitrogens of the distal His. This configuration was taken from one of the molecular dynamics trajectories described in the text. The ɛ-tautomer is shown here.
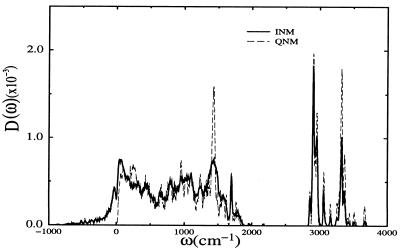
The density of vibrational states of the protein and solvent “bath” can be used to identify vibrational “doorway” modes participating in the vibrational relaxation of the CO molecule. The vibrational density of states
 |
3 |
was determined using both quenched normal mode (QNM) and instantaneous normal mode (INM) methods. In each case, the normal mode spectrum was determined by taking “snap shot” configurations from the dynamical trajectories used to compute the time-dependent friction. For the QNM spectrum, the geometry was optimized to the nearest local minimum of the potential energy (producing a “quenched” state), and the normal mode analysis was performed for the mechanically stable configuration. In computing the INM spectrum (49–56), the normal mode analysis was carried out on the “snap shot” configuration itself.
Results and Discussion
Time-Resolved mid-IR Absorbance Data.
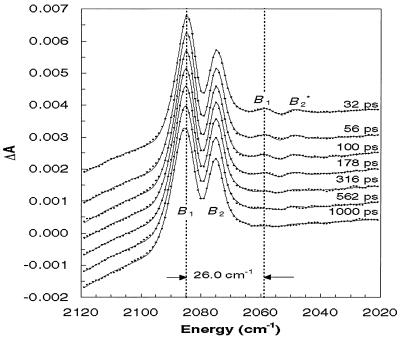
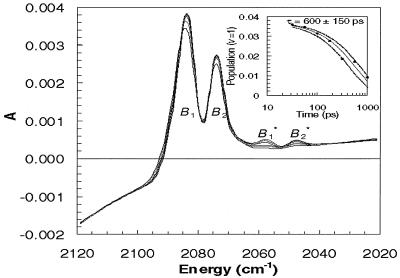
Time-resolved mid-IR absorbance spectra of photolyzed Hb13CO were measured at a series of times equally spaced on a logarithmic time scale (see Fig. 2). Four features are readily apparent in the early time spectra, but only two features, labeled B1 and B2, survive in the later time spectra.** The surviving features correspond to 13CO in its ground vibrational state (ν = 0) and trapped within a protein docking site (20). The two satellite features labeled B*1 and B*2 decay with time and are well described as red-shifted replicas of B1 and B2. The experimentally determined shift between B1 (B2) and B*1 (B*2) is 26 cm−1, similar to the 25.3 cm−1 shift between the ground (1 ← 0) and hot band (2 ← 1) vibrational transitions of 13CO in the gas phase (57). Consequently, B*1 and B*2 arise from 13CO generated in its first excited vibrational state (ν = 1). The spectral evolution of 13CO is shown more clearly in Fig. 3, where the raw data are omitted and the best-fit spectra‡‡ are overlaid rather than offset. The decay of the integrated intensity of B*1 and B*2, shown in Fig. 3 Inset, is well described as an exponential function with a decay time constant of 600 ± 150 ps. To convert the integrated absorbances into an estimate of the relative hot band population, the absorbance cross section for the first hot band transition (2 ← 1) was assumed to be twice that of the ground state transition (1 ← 0). [In the harmonic oscillator approximation, the integrated absorbance for a vibrational transition is proportional to (ν + 1) (58).]
Figure 2.
Picosecond time-resolved mid-IR absorbance spectra of photolyzed Hb13CO. Photolysis of Hb13CO detaches 13CO from the heme. The 13CO is produced predominately in its ground vibrational state (ν = 0) and gives rise to two major features, B1 and B2. A small (3.6%) portion of the 13CO is produced in its excited vibrational state (ν = 1) and gives rise to two satellite features, B*1 and B*2. Vibrational relaxation back to the ground state (ν = 1 → 0) causes the red-shifted satellite features to disappear. The solid curves were obtained by a least squares fitting to experimental spectra with the constrained model involving the Gaussian functions.
Figure 3.
Overlay of best-fit spectra at 56, 100, 178, 316, 562, and 1000 ps. (Inset) Time-dependent population of CO in its ν = 1 vibrational state (reported as a percentage of the total population of docked CO). The nascent yield of vibrationally excited CO is about 3.6%. The population of vibrationally excited CO decays exponentially with a time constant of 600 ± 150 ps.
A 3.6% nascent population in ν = 1 corresponds to a Boltzmann temperature of 825 K, which is about 50% hotter than would be expected if the photon energy beyond that required to break the Fe-CO bond were distributed over all degrees of freedom of the heme and if the CO was in thermal equilibrium with the heme at the time of its release (59, 60). It would seem that this near correspondence is coincidental: the time scale for CO release is within 100 fs of photoexcitation (20, 61), so it is unlikely that the CO can emerge in thermal equilibrium with the heme. If the dissociated CO were to come into thermal equilibrium with the heme after its release, collisions with the ambient protein would limit its rise in temperature to approximately half that of the heme. Consequently, the partitioning between the ground and first excited vibration of CO is dictated by the dissociation mechanism, not by any mechanism for thermalization.
A modest (6.7%) decrease in integrated B-state absorbance is observed at 1 ns and likely corresponds to departure of CO out of the heme pocket docking site. Because ligand escape is far slower than vibrational relaxation, vibrational relaxation of CO occurs while trapped within a well-defined region of the protein.
Simulation Estimates of T1 and Identification of “Doorway” Modes.
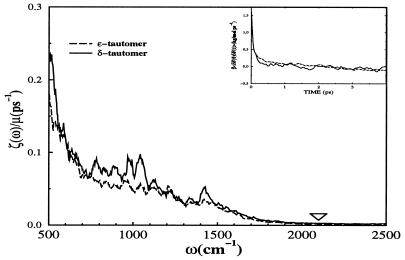
Molecular dynamics simulation was used to compute the frequency-dependent friction on the CO oscillator in the heme pocket of solvated myoglobin. The computation of the vibrational relaxation time employed the standard preexisting potential functions used previously in the simulation of carbonmonoxy myoglobin (23, 24). Given the dynamical time series it is straightforward to compute the force correlation function, its Fourier transform, and the resulting relaxation time. As such, the computed time depends only on the dynamics, which is determined by the potential and the initial conditions. The results are shown in Fig. 4. The magnitude of the frequency-dependent friction at the frequency of the CO was used to compute the population relaxation time through Eq. 1.
Figure 4.
The frequency dependent friction kernel, ζ̃(ω), for the carbon monoxide ligand in the heme pocket of sperm whale myoglobin is shown for both tautomers of the distal His. Displayed in the inlay is the fluctuating force autocorrelation function for the carbon monoxide ligand stretch. This function was computed as an average over 20 trajectories for CO in the heme pocket at 300 K. The ∇ marks the approximate CO oscillator frequency. The ζ̄(ω) data have been smoothed for clarity.
Table 1 lists the results for the vibrational relaxation times in both the δ- and ɛ-tautomers. Note that the frequencies listed in Table 1 are shifted slightly from those seen in Fig. 2. This shift is due to the different local environments found in the myoglobin (simulation) and hemoglobin (experimental) studies. The results have error bars comparable to those derived from the experimental measurements (31). Our calculations predict a measurable difference in the relaxation time depending on the protonation state of the distal His. The simulation estimate based on the approximate Landau–Teller theory is in good agreement with the experimentally measured relaxation time of 600 ± 150 ps and the simulated relaxation time of the ɛ-tautomer. The larger rate for T1 in the system of the ɛ-tautomer suggests that the dominant protonation state of the distal His in the experimental system may be the ɛ-tautomer. However, considering the nature of the simulation, the possibility that the experimental system is the δ-tautomer should not be excluded.
Table 1.
Vibrational population relaxation times, T1, for the dissociated CO in the heme pocket of solvated myoglobin at room temperature
| His-64 | B1 2131 cm−1 | B2 2119 cm−1 |
|---|---|---|
| δ-tautomer | 335 ± 115 | 330 ± 145 |
| ɛ-tautomer | 640 ± 185 | 590 ± 175 |
Estimates are made at CO frequencies of 2,131 and 2,119 cm−1, which are identified with the B1 and B2 states of photolyzed CO in myoglobin. Times are given in ps.
The QNM and INM density of states for the ɛ-tautomer are shown in Fig. 5. General features of the computed D(ω) include a rapid rise at low frequency caused by collective modes and a wide band of torsional and ring deformation modes mixed with bond and angle stretches up through the carbonyl stretches at approximately 1,600 cm−1. Following this dense band there is a clear separation of states between 1,800 and 2,800 cm−1. This separation effectively isolates the CO vibration from the remainder of the system. As a result, CO vibrational coupling to the protein/solvent bath is weak. As we move up in frequency the modes become much more localized. In fact modes from 2,000 to 3,200 cm−1 are due to the hydrogen stretching of only 1–2 residues. At higher frequencies the states are highly localized OH and NH stretching modes.
Figure 5.
The QNM and INM vibrational density of states of the ɛ-tautomer of sperm whale myoglobin.
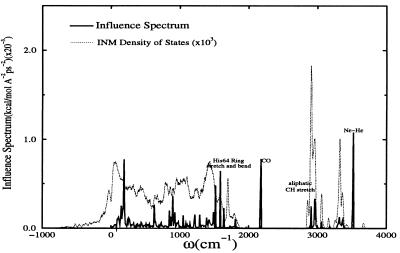
To identify the doorway modes, we computed the coupling constants between the CO stretch and the bath modes from the INM spectrum. The distribution of the square of the coupling constants is called the influence spectrum, which graphically illustrates the frequencies to which the CO stretch (15) strongly coupled. For the ɛ-tautomer of the distal His, the influence spectrum, seen in Fig. 6, has a noticeable peak at a frequency of ≈3,515 cm−1 corresponding to the Nɛ-Hɛ stretch of the distal His. The second most prominent peak can be seen in the region from 1,500 to 1,700 cm−1. The modes found here are a combination of angle bend and bond stretching motions. Once again, His-64 plays a key role. The influence spectrum for the δ-tautomer exhibited similar couplings but lacks the Nɛ-Hɛ stretch.
Figure 6.
The square of the vibrational coupling constants against a backdrop of the INM density of states for myoglobin at 300 K. The results above are averaged over 10 configurations taken from separate molecular dynamics trajectories. The spike at ≈2,100 cm−1 corresponds to the CO vibrational frequency.
While there is some solvent coupling evident between 3,200 and 3,300 cm−1, the effect appears to be minimal. This information suggests that the principle modes responsible for CO relaxation in myoglobin are extremely localized and that large-scale collective motions are relatively unimportant in the relaxation process. This is in agreement with the interpretation of experiments of Fayer et al. (12) in which they attributed high frequency, localized modes to the relaxation of the CO ligand in myoglobin. Furthermore, the residues most strongly involved in the relaxation tend to be those closest to the CO molecule. This behavior is similar to that found in liquids, in which the fluctuations in the first solvation shell of an oscillator strongly contribute to vibrational relaxation (62).
Summary
Investigation of CO relaxation in heme proteins can provide information concerning the cooperative nature of ligand binding and rebinding, in particular, and protein dynamics, in general. The computational estimates of the vibrational relaxation time agree favorably with the relaxation time determined by the time-resolved mid-IR spectroscopic measurements reported above. The agreement is especially good when comparing the computational results of the ɛ-tautomer with those obtained from the experimental measurements. However, one must have in mind that quantum corrections could alter these estimates. Preliminary calculations based on the Egelstaff theory suggest that our Landau–Teller theory values might overestimate the quantum corrected values. The calculations therefore suggest that the ɛ-tautomer, which yields the largest T1 values, may be the dominant form in HbCO and MbCO. The estimated vibrational relaxation times predict that the relaxation rate is more than an order of magnitude slower than that observed for bound CO. Identification of high frequency vibrations of the distal His as important to the relaxation mechanism indicates that the temperature dependence of T1 will be weak as is the case for the bound CO. These estimates can be tested experimentally for the absolute time scale and the predicted role of the distal His in the energy relaxation mechanism. Measurements of T1 for myoglobin mutants of the distal His should show a significant change in the relaxation time and mechanism.
Abbreviations
- T1, relaxation time
QNM, quenched normal mode
- INM
instantaneous normal mode
Footnotes
The coordinate time correlation function of the oscillator may have a finite recurrence time, trecur, and a true relaxation time cannot be rigorously defined. However, we expect that for a large system, the relaxation time will be far shorter than the recurrence time. Therefore, we may define an observation time, tobs, such that T1 < tobs ≪ trecur and the computed relaxation time is insensitive to the exact choice of tobs.
Experimental evidence suggests that CO has a preferred orientation within the protein docking site and the anisotropic field surrounding the docked ligand causes a Stark splitting of the isotropic 13CO vibrational spectrum into B1 and B2 (19–21).
The features denoted B1 and B2 are poorly described by single Gaussian functions; however, they are both quite well described by a sum of two Gaussians (12 parameters), i.e., B′1 (B′2) and B″1 (B″2) (19). The hot bands were modeled as shifted replicas of the B1 and B2 features (2 additional parameters: amplitude and shift). Finally, the background was modeled as a cubic polynomial (4 parameters). To make the least-squares optimization of 18 parameters for each time point more robust, several parameters were invoked as global parameters over all time points. For example, the shift between B′1 and B″1 (B′2 and B″2), their relative width, their relative integrated area, and the hot band shift were made global parameters without compromising the quality of the fits. Furthermore, the shift between B′1 and B″1 and their relative area was made to be the same as those for B′2 and B″2. These constraints elevated the chi-squared parameter minimally and facilitated the convergence of all parameters toward their assumed global minimum.
References
- 1.Landau L, Teller E. Z Sowjetunion. 1936;10:34. [Google Scholar]
- 2.Zwanzig R. J Chem Phys. 1961;34:1931–1935. [Google Scholar]
- 3.Berne B J, Jortner J, Gordon R. J Chem Phys. 1967;47:1600–1608. [Google Scholar]
- 4.Berne B J, Gordon R, Sears V F. J Chem Phys. 1968;49:475–476. [Google Scholar]
- 5.Zwanzig R. J Stat Phys. 1973;9:215–220. [Google Scholar]
- 6.Oxtoby D W. Adv Chem Phys. 1981;47:487–519. [Google Scholar]
- 7.Owrutsky J C, Rafert D, Hochstrasser R M. Annu Rev Phys Chem. 1994;45:519–555. doi: 10.1146/annurev.pc.45.100194.002511. [DOI] [PubMed] [Google Scholar]
- 8.Heilweil E J, Cavanaugh R R, Stephenson J C. Chem Phys Lett. 1987;134:181–188. [Google Scholar]
- 9.Hill J R, Ziegler C J, Suslick K S, Dlott D D, Rella C W, Fayer M D. J Phys Chem. 1996;100:18023–18032. [Google Scholar]
- 10.Rector K D, Rella C W, Hill J R, Kwok A S, Sligar S, Chien E Y T, Dlott D D, Fayer M D. J Phys Chem B. 1997;101:1468–1475. [Google Scholar]
- 11.Owrutsky J C, Li M, Locke B, Hochstrasser R M. J Phys Chem. 1995;99:4842–4846. [Google Scholar]
- 12.Hill J R, Tokmakoff A, Peterson K A, Sauter B, Zimdars D, Dlott D D, Fayer M D. J Phys Chem. 1994;98:11213–11219. [Google Scholar]
- 13.Hill J R, Dlott D D, Rella C W, Peterson K A, Decatur S M, Boxer S G, Fayer M D. J Phys Chem. 1996;100:12100–12107. [Google Scholar]
- 14.Ray G B, Li X-Y, Ibers J A, Sessler J L, Spiro T G. J Am Chem Soc. 1994;116:162–176. [Google Scholar]
- 15.Schlichting I, Berendzen J, Phillips G N, Jr, Sweet R M. Nature (London) 1994;371:808–812. doi: 10.1038/371808a0. [DOI] [PubMed] [Google Scholar]
- 16.Teng T-Y, Šrajer V, Moffat K. Nat Struct Biol. 1994;1:701–705. doi: 10.1038/nsb1094-701. [DOI] [PubMed] [Google Scholar]
- 17.Hartmann H, Zinser S, Komninos P, Schneider R T, Nienhaus G U, Parak F. Proc Natl Acad Sci USA. 1996;93:7013–7016. doi: 10.1073/pnas.93.14.7013. [DOI] [PMC free article] [PubMed] [Google Scholar]
- 18.Srajer V, Teng T, Ursby T, Pradervand C, Ren Z, Adachi S, Schildkamp W, Bourgeois D, Wulff M, Moffat K. Science. 1996;274:1726–1729. doi: 10.1126/science.274.5293.1726. [DOI] [PubMed] [Google Scholar]
- 19.Lim M, Jackson T A, Anfinrud P A. J Chem Phys. 1995;102:4355–4366. [Google Scholar]
- 20.Lim M, Jackson T A, Anfinrud P A. Nat Struct Biol. 1997;4:209–214. doi: 10.1038/nsb0397-209. [DOI] [PubMed] [Google Scholar]
- 21.Lim M, Jackson T A, Anfinrud P A. Science. 1995;269:962–966. doi: 10.1126/science.7638619. [DOI] [PubMed] [Google Scholar]
- 22.Ansari A, Berendzen J, Braunstein D, Johnson J B, Ormos P, Sauke T S, Scholl R, Schulte A. Biophys Chem. 1987;26:337–355. doi: 10.1016/0301-4622(87)80034-0. [DOI] [PubMed] [Google Scholar]
- 23.Straub J E, Karplus M. Chem Phys. 1991;158:221–248. [Google Scholar]
- 24.Ma J, Huo S, Straub J E. J Am Chem Soc. 1997;119:2541–2551. [Google Scholar]
- 25.Vitkup D, Petsko G, Karplus M. Nat Struct Biol. 1997;4:202–208. doi: 10.1038/nsb0397-202. [DOI] [PubMed] [Google Scholar]
- 26.Brooks B R, Bruccoleri R D, Olafson B O, States D J, Swaminathan S, Karplus M. J Comp Chem. 1983;4:187–207. [Google Scholar]
- 27.Mackerell A, Jr, Bashford D, Bellott M, Dunbrack R, Jr, Evanseck J, Field M, Fischer S, Gao J, Guo H, Ha S, et al. J Phys Chem B. 1998;102:3586–3616. doi: 10.1021/jp973084f. [DOI] [PubMed] [Google Scholar]
- 28.Bader J S, Berne B J. J Chem Phys. 1994;100:8359–8356. [Google Scholar]
- 29.Antonini E, Brunori M. Hemoglobin and Myoglobin in Their Reactions with Ligands. Amsterdam: North-Holland; 1971. [Google Scholar]
- 30.Anfinrud P A, Lim M, Jackson T A. Proc SPIE-Int Soc Opt Eng. 1994;2138:107–115. [Google Scholar]
- 31.Sagnella D E, Straub J E. Biophys J. 1999;108:70–84. doi: 10.1016/S0006-3495(99)76873-6. [DOI] [PMC free article] [PubMed] [Google Scholar]
- 32.Allen M, Tildesley D. Computer Simulations of Liquids. New York: Oxford Univ. Press; 1989. [Google Scholar]
- 33.Huffaker J N. J Chem Phys. 1976;64:4564–4570. [Google Scholar]
- 34.Smith J, Cusack S, Tidor B, Karplus M. J Chem Phys. 1990;93:2974–2991. [Google Scholar]
- 35.Smith J C. Q Rev Biophys. 1991;24:227–291. doi: 10.1017/s0033583500003723. [DOI] [PubMed] [Google Scholar]
- 36.Oxtoby D W. J Chem Phys. 1979;70:2605–2610. [Google Scholar]
- 37.Grote R F, Hynes J T. J Chem Phys. 1982;77:3736–3743. [Google Scholar]
- 38.Adelman S A, Stote R H. J Chem Phys. 1988;88:4397–4414. [Google Scholar]
- 39.Stote R H, Adelman S A. J Chem Phys. 1988;88:4415–4420. [Google Scholar]
- 40.Adelman S A, Muralidhar R, Stote R H. J Chem Phys. 1991;95:2738–2751. [Google Scholar]
- 41.Whitnell R M, Wilson K R, Hynes J T. J Phys Chem. 1990;94:8625–8628. [Google Scholar]
- 42.Whitnell R M, Wilson K R, Hynes J T. J Chem Phys. 1992;96:5354–5369. [Google Scholar]
- 43.Tuckerman M E, Berne B J. J Chem Phys. 1993;98:7301–7318. [Google Scholar]
- 44.Gnanakaran S, Hochstrasser R M. J Phys Chem. 1996;105:3486–3496. [Google Scholar]
- 45.Rey R, Hynes J T. J Chem Phys. 1998;108:142–153. [Google Scholar]
- 46.Morita A, Kato S. J Chem Phys. 1998;109:5511–5523. [Google Scholar]
- 47.Egerov S A, Skinner J L. J Chem Phys. 1996;105:7047–7058. [Google Scholar]
- 48.Everitt K F, Egerov S A, Skinner J L. Chem Phys. 1998;235:115–122. [Google Scholar]
- 49.Madan B. J Chem Phys. 1993;98:3342–3350. [Google Scholar]
- 50.Madan B, Keyes T, Seeley G. J Chem Phys. 1990;92:7565–7569. [Google Scholar]
- 51.Seeley G, Keyes T, Madan B. J Chem Phys. 1991;95:3847–3849. [Google Scholar]
- 52.Cho M, Fleming G R, Saito S, Ohmine I, Stratt R M. J Chem Phys. 1994;100:6672–6683. [Google Scholar]
- 53.Straub J E, Thirumalai D. Proc Natl Acad Sci USA. 1993;90:809–813. doi: 10.1073/pnas.90.3.809. [DOI] [PMC free article] [PubMed] [Google Scholar]
- 54.Straub J E, Thirumalai D. Proteins. 1993;15:360–373. doi: 10.1002/prot.340150404. [DOI] [PubMed] [Google Scholar]
- 55.Straub J E, Choi J-K. J Phys Chem. 1994;98:10978–10987. [Google Scholar]
- 56.Goodyear G, Stratt R M. J Chem Phys. 1996;105:10050–10071. [Google Scholar]
- 57.Guelachvili G, Rao K N. Handbook of Infrared Standards. Boston: Academic; 1986. [Google Scholar]
- 58.Wilson E B, Decius J C, Cross P C. Molecular Vibrations: The Theory of Infrared and Raman Vibrational Spectra. New York: Dover; 1955. [Google Scholar]
- 59.Lim M, Jackson T A, Anfinrud P A. J Phys Chem. 1996;100:12043–12051. [Google Scholar]
- 60.Henry E R, Eaton W A, Hochstrasser R M. Proc Natl Acad Sci USA. 1986;83:8982–8986. doi: 10.1073/pnas.83.23.8982. [DOI] [PMC free article] [PubMed] [Google Scholar]
- 61.Petrich J W, Poyart C, Martin J L. Biochemistry. 1988;27:4049–4060. doi: 10.1021/bi00411a022. [DOI] [PubMed] [Google Scholar]
- 62.Stratt R M, Maroncelli M. J Phys Chem. 1996;100:12981–12996. [Google Scholar]


