

Abstract
Objective
Previous research has shown that students overestimate the drinking of their peers, and that perceived norms are strongly associated with drinking behavior. Explanations for these findings have been based largely on cross-sectional data, precluding the ability to evaluate the stability of normative misperceptions or to disentangle the direction of influence between perceived norms and drinking. The present research was designed to evaluate (1) the stability of normative misperceptions and (2) temporal precedence of perceived norms and drinking.
Method
Participants were college students (N = 164; 94 women) who completed assessments of perceived norms and reported behavior for drinking frequency and weekly quantity. Most participants (68%) completed the same measures again two months later.
Results
Results indicated large and stable overestimations of peer drinking for frequency and weekly quantity. Results also showed that for weekly quantity, perceived norms predicted later drinking, but drinking also predicted later perceived norms. Results for frequency revealed perceived norms predicted later drinking, but drinking did not predict later perceived norms.
Conclusion
These findings underscore the importance of longitudinal designs in evaluating normative influences on drinking. The present findings suggest that normative misperceptions are stable, at least over a relatively short time period. Findings support a mutual influence model of the relationship between perceived norms and drinking quantity but are more strongly associated with conformity explanations for the relationship between perceived norms and drinking frequency. Results are discussed in terms of implications for prevention interventions.
Descriptive social norms have been pervasively incorporated in adolescent and college student alcohol interventions based on two key relationships; (1) perceived norms are typically higher than actual norms, and (2) perceived norms are positively correlated with drinking. With few exceptions (Marks et al 1992; Read el al., 2005), most studies have been cross-sectional or have examined only how perceived norms are associated with later drinking, rather than how drinking relates to later perceived norms (Kahler et al., 2003; Larimer et al., 2004; Read el al., 2002). The present research was designed to evaluate the stability of normative misperceptions, perceived norms, and drinking. In addition, the ability of perceived norms to predict future drinking is compared with the ability of drinking to predict future perceived norms.
As a general term, “social norm” usually refers to what is considered to be normal within a given population of people. Terminology used in empirical investigations related to social norms is discordant and varied but can perhaps best be understood by considering two dimensions: injunctive versus descriptive norms and perceived versus actual norms. The “injunctive versus descriptive” distinction was suggested by Cialdini and colleagues (1990). “Injunctive norms” refer to the extent to which some population approves or disapproves of a given behavior. “Descriptive norms” refer to the frequency or quantity of a given behavior within some population. The present research focuses on descriptive norms. The “perceived versus actual” distinction is important because people often do not know the extent to which others approve, disapprove, or engage in a particular behavior. It is usually the perception of others’ attitudes or behaviors that is directly influential on the individual rather than others’ actual attitudes or behaviors (Lewin, 1943).
Past research has shown that college students overestimate the prevalence of peers’ drinking (Borsari and Carey, 2003). Moreover, the magnitude of overestimation is associated with more problematic drinking (Baer and Carney, 1993; Baer et al 1991; Lewis and Neighbors. 2004; Perkins and Berkowitz, 1986). Perceived approval and prevalence of peer drinking is associated with one’s own drinking (Borsari and Carey, 2001; Lewis and Neighbors, 2004; Perkins, 2002; Prentice and Miller, 1993). It is clear from previous studies that perceived norms and behaviors go hand in hand: the reason for this, however, is less clear. Several explanations have been offered regarding normative misperceptions, including pluralistic ignorance (Miller and Prentice, 1996; Prentice and Miller, 1993), false consensus (Ross et al., 1977; Marks and Miller, 1987), and false uniqueness (Suls et al., 1988). The temporal relationship between perceived norms and drinking remains unclear.
In theory, perceived norms about drinking will influence people’s behavior to the extent that they are motivated to be seen as similar to the group. If individuals are afraid to be viewed as deviants, they will behave in accordance with what they believe the group norm to be. These ideas are supported by classic research on conformity (Asch, 1951; Deutsch and Gerard, 1955; Sherif, 1936), as well as by a host of literature related to social comparison theory (Festinger, 1954), social impact theory (Latane, 1981), and social identity and self-categorization theories (Tajfel and Turner, 1986; Turner et al., 1987). Empirical support for the notion that perceived norms temporally precede drinking can be derived indirectly from intervention studies incorporating normative feedback. Perceived norms are experimentally manipulated by providing feedback that highlights the discrepancies between one’s own drinking, one’s perceptions of peer drinking, and peers’ actual drinking. A number of studies have found provision of normative feedback to result in drinking reductions (Agostinelli et al., 1995; Collins et al., 2002; Walters and Neighbors, 2005; Walters et al., 2000). Other studies have shown that reductions in perceived norms mediate drinking reductions (Borsari and Carey, 2000; Mattern and Neighbors, 2004; Neighbors et al., in press).
In contrast to the notion that perceived norms temporally precede drinking, at least two phenomena—projection and social selection—suggest the opposite. Students may base their estimates of others’ drinking on their own behavior This idea is consistent with false consensus (Marks and Miller, 1987; Ross et al., 1977) and false uniqueness (Suls et al., 1988) effects. An alternative is that heavier drinkers may choose to associate with heavier-drinking peers, which may influence both their perceived norms and subsequent drinking. Previous research suggests that social or peer selection has a clear impact on student drinking (Bullers et al., 2001; Kahler et al., 2003; Read et al., 2005).
In sum, previous research and theory suggest three possibilities: perceived norms will be better predictors of later drinking, drinking will be a better predictor of later perceived norms, or both will be equally predictive of the other. The present study was designed to examine mean differences in, and correlations between, perceived and actual drinking norms among college students over time.
Method
Participants
Participants were undergraduate psychology students (N = 164; 94 women, 69 men, 1 not reported) at a medium-sized Midwestern university. The majority of participants were freshmen (46%) and sophomores (33%), and the average (SD) age was 19.94 (2.72) years. The sample was 92% white; the remaining 8% consisted of Native American, black, Asian, and other ethnicities. The majority of participants (92%) did not belong to a sorority or fraternity, and just over half (52%) lived in residence halls or dorm rooms. In exchange for participating, students received extra credit in their coursework. The majority of students (84%) reported some drinking at either Time 1 (T1) or Time 2 (T2). With respect to drinking frequency, about half of the students (54.3% at T1; 54.5% at T2) reported drinking two or three times per month or less; most of the remaining students reported drinking between one and four times per week (44.5% at T1; 42.9% at T2). Regarding drinking quantity, about half of the students (53.7% at T1; 54.5% at T2) reported drinking six drinks per week or less; most of the remaining students reported drinking 7-30 drinks per week (41.5% at T1; 43.8% at T2).
Procedure
After providing informed consent, participants completed questionnaires that included measures of perceived norms and drinking behavior, in addition to other measures unrelated to this article. Participants were instructed to respond honestly and were reminded that answers would remain anonymous. Two months later, participants returned to the lab and completed the same series of questions. A time interval of 2 months was chosen for two reasons. First, a long-term aim of this research is to better understand the application of feedback to correct normative misperceptions in prevention strategies, and a majority of studies evaluating these intervention approaches have utilized follow-up assessments using similar time periods (e.g., 6 weeks; Agostinelli et al., 1995; Borsari and Carey, 2000; Collins et al., 2002; Walters, 2000; Walters et al., 2000). Second, 2 months fit the timeframe of the study, the intention of which was completion within one semester. All procedures were reviewed and approved by the University’s committee for the protection of human subjects.
Measures
Alcohol consumption
Frequency and quantity of alcohol consumption were assessed using a modified version of the Daily Drinking Questionnaire (DDQ; Collins et al., 1985). To assess frequency, participants were asked, “How many days of the week did you drink alcohol during the past month?” Response options, scored in occasions per week, were “I do not drink at all” (0), “about once a month” (0.25), “two to three times a month” (0.625), “once or twice a week” (1.5), “three to four times a week” (3.5), “nearly every day” (5), and “once a day or more” (7). To assess quantity of alcohol consumption, participants were asked, “Consider a typical week during the last 3 months. How much alcohol, on average (measured in number of drinks), do you drink on each day of a typical week?” Participants responded by reporting the typical number of drinks consumed on each day of the week. Weekly drinking was calculated by summing participants’ responses for each day of the week. The DDQ has been used in previous studies of college student drinking and has demonstrated good validity (e.g., Larimer et al., 2001; Marlatt et al., 1998). The present research will also establish test-retest reliability for these measures.
Perceived norms
The perceived norms for weekly quantity and frequency of alcohol consumption were assessed with the Drinking Norms Rating Form (DNRF; Baer et al., 1991), modeled directly after the DDQ. The perceived quantity norm was assessed by asking participants, “How much alcohol, on average (measured in number of drinks), does a typical student at your university drink on each day of a typical week?” Response options and scoring were identical to those described for the measure of drinking frequency. The perceived quantity norm was scored by summing the estimated number of drinks consumed by the typical student for each day of the week.
Results
Attrition
Of the 164 participants who completed T1 assessments, about two thirds (N = 112; 68%) of students (58% men) also completed a 2-month follow-up assessment; repeated attempts were made to schedule or reschedule all participants. Participants who dropped out reported heavier drinking at baseline than students who completed the follow-up (quantity: t = 1.97, 162 df, p = .05; frequency: t = 2.29, 162 df, p < .05). In addition, participants who dropped out reported higher perceived alcohol quantity norms (t = 1.97, 162 df, p = .05). For perceived frequency norms, participants who dropped out did not differ from those who completed follow-up (t = 0.22, 162 df, p = NS).
Actual norms
In analyses presented below, sample means for drinking were used as an approximation for actual campus drinking norms. To evaluate whether the sample norms were a good approximation of actual campus drinking norms, preliminary analyses were conducted comparing the sample means for drinking with data from a large sample of introductory psychology students who completed a brief screening assessment in a previous semester. The screening assessment included the same measures of drinking frequency and weekly quantity described above. Students in the screening sample were enrolled in undergraduate psychology courses (N = 1,185; 58% women)—introductory psychology courses in most cases, in which students are generally representative of the student body as a whole. In a recent semester, 70 majors were represented in this population, and fewer than 2% of these were psychology majors. Represented most heavily were undecided (19.05%) majors; these were followed by prebusiness administration (8.79%), general architecture (6.72%), and prenursing (6.72%). No other majors accounted for more than 5% of the introductory psychology population. Actual campus norms as estimated from the larger data set indicated that students reported drinking an average of 1.04 times per week and consuming 9.90 drinks per week. Sample t tests were conducted to determine whether sample norms in the present study differed from these means. Frequency means did not differ from 1.04 occasions per week at T1 (mean = 1.18 [1.23]; t = 1.47, 163 df, p = NS), or T2 (mean = 0.98 [1.08]; t = -0.61, 163 df, p = NS). In addition, the sample mean for quantity at T1 (9.40 [10.24]) was not significantly different from 9.90 drinks per week (t = -0.63, 163 df, p = NS). Similar to attrition analyses presented above, however, participants at T2 reported drinking significantly fewer than 9.90 drinks (mean = 7.75 [8.06]; t = 2.82. 163 df, p < .01). Thus, with the exception of drinks per week at T2, sample norms were considered a good approximation of actual campus drinking norms and sample norms are henceforth referred to as actual norms.
Mean differences between perceived norms and drinking
The first aim of this research was to evaluate discrepancy between perceived and actual norms at both time points for quantity and frequency. We expected participants to overestimate drinking norms for both quantity and frequency. Paired-samples t tests were conducted to evaluate this hypothesis at T1 and T2. Effect size for mean differences in paired observations (d) was calculated as the mean difference, divided by the standard deviation of the difference (Cohen. 1988). Means and 95% confidence intervals (CIs) are presented for quantity and frequency in top and bottom panel, respectively, of Figure 1. As expected, the perceived quantity norm was higher than the actual reported quantity norm at T1 (t = 10.89, 162 df, p < .0001; d = .86) and T2 (t = 9.62, 111 df, p < .0001; d = .91). A z test (Rosenthal and Rosnow, 1991) revealed that the magnitude of discrepancy at T1 was not significantly different from the magnitude of discrepancy at T2 (z = -0.41, p = NS). Similar results were obtained for frequency. The perceived frequency norm was higher than the actually reported frequency norm at T1 (t = 10.41, 163 df, p < .0001; d = .81) and T2 (t = 8.55, 111 df, p < .0001; d = .81). The magnitude of discrepancy did not differ over time (z = 0.02, p = NS).
Figure 1.
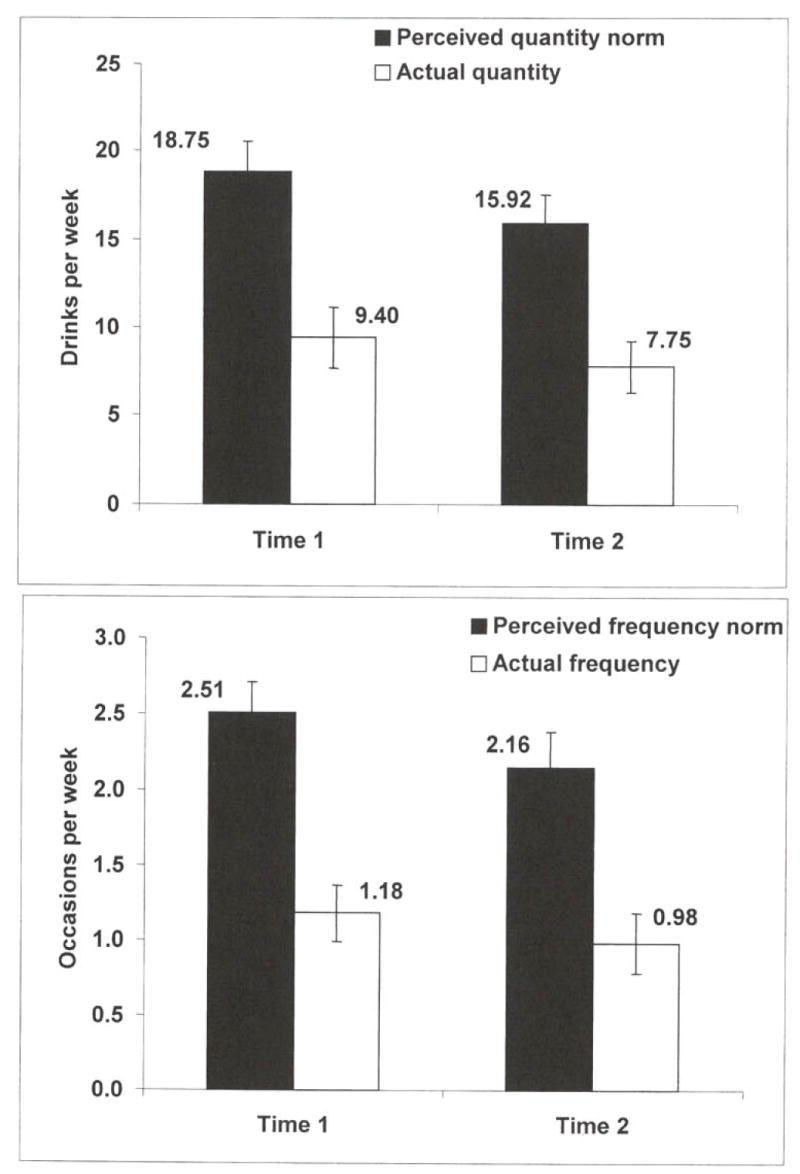
Perceived norms versus actual drinking quantity (top panel) and frequency (bottom panel)
Correlations between perceived norms and drinking
Our second aim was to evaluate correlations between perceived norms and drinking within and across time points. We were primarily interested in comparing the strength of the relationships between T1 perceived norms and T2 drinking, and between T1 drinking and T2 perceived norms. We were also interested, however, in comparing test-retest correlations for perceived norms versus drinking, and whether cross-sectional relationships differed between perceived norms and drinking. We used Amos 4.0 (SmallWaters Corp,, Chicago, IL; Arbuckle and Wothke, 1999) to evaluate these questions separately for drinking quantity and drinking frequency. We specified a baseline-saturated model, in which all correlations among perceived norms and drinking for quantity at both time points were freely estimated (Figure 2, top panel). We systematically compared the baseline model with models that specified each pair of correlations constrained to equality. Chi-square difference tests (Bollen, 1989) were used to evaluate whether adding the equality constraint led to significant decrement in fit; significant chi-squares indicated that correlations were significantly different. To avoid interpretation difficulties due to differential dropout as a function of perceived norms and drinking, only participants who completed both assessments (N = 112) were included in these analyses.
Figure 2.
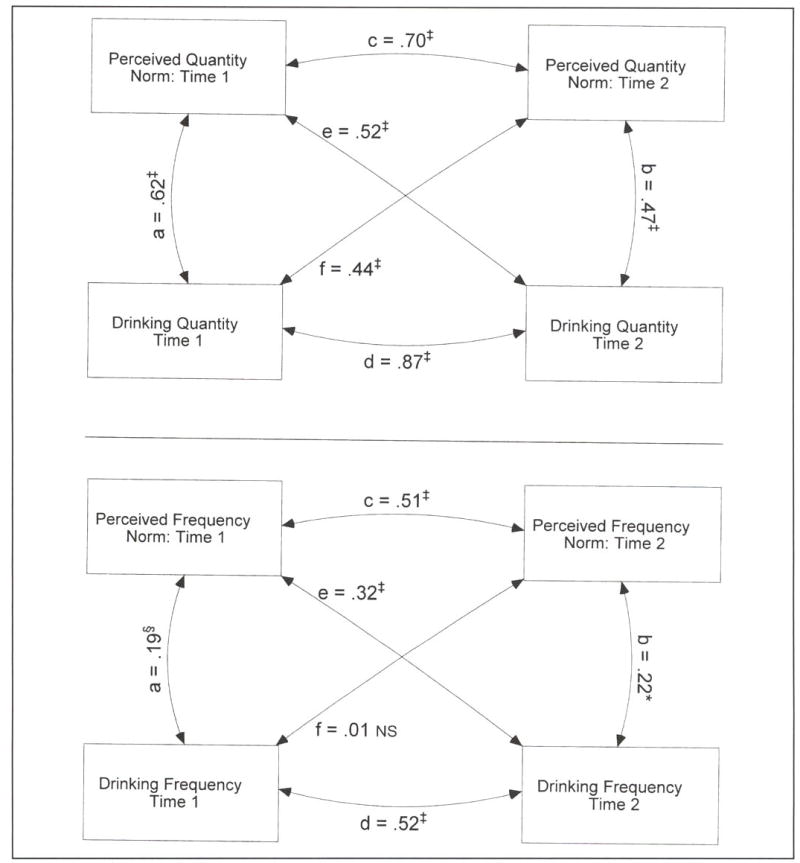
Correlations among perceived norms and reported drinking quantity (top panel) and frequency (bottom panel) §p < .06; *p < .05; ‡p < .001.
Table 1 presents chi-square tests for differences between each pair of correlations for drinking quantity. Results indicated that the relationship between T1 perceived norms and T2 drinking (r = .52) was not significantly different from the relationship between T1 drinking and T2 perceived norms (r = .44). Results also indicated that test-retest correlations were relatively high and not significantly different for perceived quantity norms relative to drinking quantity. In addition, the cross-sectional relationship between the perceived quantity norm and drinking quantity was stronger at T1 than at T2.
Table 1.
Differences between correlations among perceived norms and reported behavior for drinking quantity
| (T1PN)(TID) | (T2PN)(T2D) | (T1PN)(T2PN) | (T1D)(T2D) | (T1PN)(T2D) | (T1D)(T2PN) | |
|---|---|---|---|---|---|---|
| (T1PN)(T1D) | – | |||||
| (T2PN)(T2D) | 7.75† | – | ||||
| (T1PN)(T2PN) | 0.41 | 12.83‡ | – | |||
| (T1D)(T2D) | 1.51 | 17.62‡ | 0.11 | – | ||
| (T1PN)(T2D) | 15.72‡ | 0.76 | 7.45† | 18.10‡ | – | |
| (T1D)(T2PN) | 7.95† | 0.49 | 11.44† | 12.71‡ | 0.10 | – |
Notes: (T1PN)(T1D) = Time 1 perceived norm with Time 1 drinking; (T2PN)(T2D) = Time 2 perceived norm with Time 2 drinking; (T1PN)(T2PN) = Time 1 perceived norm with Time 2 perceived norm; (T1D)(T2D) = Time 1 drinking with Time 2 drinking; (T1PN)(T2D) = Time 1 perceived norm with Time 2 drinking; (T1D)(T2PN) = Time 1 drinking with Time 2 perceived norm. Tests are chi-square tests (1 df) representing differences in model fit between a freely estimated model and a model in which the paths are fixed to equality. Significance indicates paths are not equal.
p < .01;
p < .001.
The same strategy was used to examine differences in correlations between perceived norms and behavior for drinking frequency. The bottom panel of Figure 2 presents a saturated model, in which all correlations between these two variables at T1 and T2 were freely estimated. Table 2 presents chi-square difference tests between the saturated model and models in which each pair of correlations was systematically constrained to equality. Overall correlations related to drinking frequency were weaker than those for drinking quantity. Results indicated that the T1 perceived frequency norm was significantly associated with T2 drinking (r = .32), whereas T1 drinking was not significantly correlated with T2 perceived norms (r = .01). In addition, these correlations were significantly different. This suggests that, with regard to drinking frequency, perceived norms are more likely to cause drinking than the reverse. Results also indicated that test-retest correlations were moderate and not significantly different for perceived frequency norms relative to drinking frequency. The cross-sectional relationships between the perceived frequency norm and drinking frequency were relatively weak and not significantly different.
Table 2.
Differences between correlations among perceived norms and reported behavior for drinking frequency
| (T1PN)(T1D) | (T2PN)(T2D) | (T1PN)(T2PN) | (T1D)(T2D) | (T1PN)(T2D) | (T1D)(T2PN) | |
|---|---|---|---|---|---|---|
| (T1PN)(T1D) | – | |||||
| (T2PN)(T2D) | 0.01 | – | ||||
| (T1PN)(T2PN) | 7.10† | 11.17‡ | – | |||
| (T1D)(T2D) | 5.97* | 4.44* | 0.68 | – | ||
| (T1PN)(T2D) | 1.54 | 1.49 | 4.62 | 1.64 | – | |
| (T1D)(T2PN) | 3.55§ | 4.52* | 20.61‡ | 16.59‡ | 7.05† | – |
Notes: (TIPN)(T1D) = Time 1 perceived norm with Time 1 drinking; (T2PN)(T2D) = Time 2 perceived norm with Time 2 drinking; (T1PN)(T2PN) = Time 1 perceived norm with Time 2 perceived norm; (T1D)(T2D) = Time 1 drinking with Time 2 drinking; (T1PN)(T2D) = Time 1 perceived norm with Time 2 drinking; (T1D)(T2PN) = Time 1 drinking with Time 2 perceived norm. Tests arc chi-square tests (1 df) representing differences in model fit between a freely estimated model and a model in which the paths are fixed to equality. Significance indicates paths are not equal.
p < .06;
p < .05;
p < .01;
p < .001.
Mediation analyses
Although correlation analyses provide a straightforward assessment of the relationships between T1 and T2 measures, they do not take into account the strong correlations between T1 norms and drinking. Indeed, cross-time, cross-variable relations are likely due to T1 relationships (i.e., T1 norms influence T1 drinking, which in turn influences T2 drinking; T1 drinking influences T1 norms, which in turn influence T2 norms). Mediation analyses were conducted to evaluate these models (Baron and Kenny, 1986; MacKinnon and Dwyer, 1993). Demonstration of mediation requires significant relationships between (1) predictor and criterion (e.g., T1 norm and T2 drinking); (2) predictor and mediator (e.g., T1 norm and T1 drinking); and (3) mediator and criterion (e.g., T1 drinking and T2 drinking). Perhaps more important, (4) the relationship between predictor and criterion is no longer significant when controlling for the mediator. The first three of these criteria can be observed in the correlations presented in Figure 2. Regression analyses were conducted to evaluate the fourth criteria for each of the three significant cross-time cross-variable relationships. When controlling for T1 drinking quantity, the relationship between T1 perceived quantity norm and T2 drinking quantity was no longer significant (B = -.06, p = NS). When controlling for T1 perceived quantity norm, the relationship between T1 drinking quantity and T2 perceived quantity norm was no longer significant (B = .06, p = NS). These results suggest that for quantity variables, T1 norms influence T2 drinking through their relationships with T1 drinking, and the reverse is also true: T1 drinking influences T2 norms through its relationship with T1 norms. When controlling for T1 drinking frequency, the relationship between T1 perceived frequency norm and T2 drinking frequency remained significant (B = .24, p < .01). Thus, the T1 perceived frequency norm influences T2 drinking frequency independently from its relationship with T2 drinking frequency.
Discussion
The purpose of the current study was to investigate temporal relationships between individuals’ perceptions of peer drinking and their own actual drinking behaviors. First, at two points in time, participants mistakenly believed that others consumed more alcohol and drank more frequently than was actually reported by participants. Second, our results support a mutual-influence hypothesis for drinking quantity: perceived quantity norms predicted later drinking quantity, but drinking quantity also predicted later perceived quantity norms. Mediation analyses further suggest that perceived norms influence later drinking through their relationship with concurrent drinking, as well as the reverse: drinking influences later perceived norms through its relationship with concurrent norms. Our results promote a specific temporal relationship with respect to perceived frequency norms, which temporally precede drinking frequency. In this case, the mutual-influence hypothesis did not hold, because drinking frequency did not predict later perceived frequency. In addition, the influence of the perceived frequency norm on later drinking frequency was at least partly independent from its relationship with concurrent drinking frequency.
Both perceived frequency and perceived quantity norms were found to be associated with later drinking, supporting previous suggestions that overestimations of drinking norms influence students to drink more (Baer and Carney, 1993; Borsari and Carey, 2003; Perkins and Berkowitz, 1986; Lewis and Neighbors, 2004; Perkins, 2002; Prentice and Miller, 1993). These results are in agreement with basic research on conformity (Asch, 1951; Deutsch and Gerard, 1955; Sherif, 1936), social comparison theory (Festinger, 1954), social impact theory (Latane, 1981), and social identity and self-categorization theories (Tajfel and Turner, 1986; Turner et al., 1987).
Test-retest correlations also provided an opportunity to evaluate the reliability of the DDQ and the DNRF. Results of this study indicate that the DDQ and DNRF have good 2-month test-retest reliability for weekly quantity and perceived quantity norms, as well as adequate test-retest reliability for drinking frequency and perceived frequency norms.
Implications for prevention
Findings suggest that norms-based interventions are on the right track. Attempts to change people’s perceptions of drinking norms can be beneficial in reducing heavy drinking (e.g., Mattern and Neighbors, 2004; Neighbors et al., 2004). The findings that normative misperceptions are stable, at least in the short run, suggest that they are unlikely to change in the absence of information revealing the discrepancy. Moreover, the positive associations between perceived norms and later drinking for both frequency and quantity suggest that changing perceived norms is likely to influence drinking. It is unclear to what extent, in a college population, social selection plays a role in drinking (Kahler et al., 2003). Students who select a peer group that encourages heavy drinking may benefit from interventions that highlight the differences between the actual drinking of their peer group, the student’s perceived campus norms, and the actual campus norms of their university.
Our results also suggest that an individual’s perception of the norm is influenced by how much (but not how often) he or she drinks. When people estimate norms they may use their own behavior to help make these estimations; this is similar to projection explanations (e.g., the false consensus effect). To the extent that individuals use their own behavior as an anchor in determining their perceptions of drinking norms, attempts to change their perceptions of the norm may have less influence on their drinking behavior. Thus, interventions incorporating normative feedback may be more effective if the aim is not only to correct normative misperceptions but also to highlight the discrepancy between the student’s own drinking behavior and the drinking behavior of his/her peers. Providing information that allows students to make the explicit comparison between their own drinking and the true drinking levels of others may influence behavior, regardless of the individual’s initial perception of those drinking norms. Additional research directly evaluating this proposition might shed light on the mixed findings that have been reported for social-norms marketing campaigns (e.g., Perkins, 2002; Wechsler et al., 2003), which do not provide explicit comparisons between one’s own drinking behavior and drinking norms.
Results for weekly quantity of alcohol consumed differed from frequency of alcohol consumption. The results imply that perceived frequency norms are more likely to influence drinking frequency than the reverse. This may be due, in part, to the weaker relationship between perceived frequency norms and drinking frequency relative to the stronger relationship between perceived quantity norms and drinking quantity. An alternative is that drinking frequency may be more salient and it may be easier to accurately estimate how often other students drink than how much they drink. The latter explanation is less compelling, given that the effect sizes for normative misperception were similar for quantity and frequency. On one hand, the findings for frequency suggest that correcting normative misperceptions for frequency are likely to reduce drinking frequency. On the other hand, the relationships between perceived frequency norms and drinking frequency were considerably weaker than the relationship between perceived quantity norms and drinking quantity, In addition, previous research suggests that weekly drinking quantity is a better indicator of problematic drinking than is drinking frequency (Borsari et al., 2001; Smart et al., 2000). Range restriction is one plausible explanation for this finding. As it is typically assessed, the maximum value for drinking frequency is every day (i.e., seven times per week). In contrast, the number of drinks per week can range from 0 to more than 80 in some samples. Overall, these factors suggest that the incorporation of frequency norms in prevention interventions is likely to have less impact than incorporation of weekly drinking norms.
Limitations
A number of limitations to this research should be noted. First, although decided upon for good reasons, the relatively short time period of 2 months between assessments limited our ability to evaluate changes in constructs over time. As indicated by the high test-retest correlation, our results suggest that weekly drinking is very stable over a 2-month period. Other studies, however, have shown high variability in students’ drinking over time, depending on such variables as time of semester (e.g., first week of class, midterms) and whether or not students were on vacation (Del Boca et al., 2004; Greenbaum et al., 2005). This variability indicates that asking students to describe a typical week, as in the DDQ, may sacrifice precision for stability.
Second, attrition was problematic, with heavier drinkers being less likely than light drinkers to complete follow-up. This is less problematic for interpreting cross-sectional relationships; however, it is difficult to know whether the cross-temporal relationships reported here generalize to heavier drinking students. A related concern is the moderately high attrition rate (32%), which necessitates caution in interpreting the findings. In addition, all variables were assessed by self-report. Although self-report measures of drinking have been found to be largely reliable and valid (Johnston and O’Malley, 1985; Johnston et al., 2004), relationships between perceived norms and drinking are probably inflated to some extent by common method variance. Last, the sample primarily consisted of while undergraduate students attending a Midwestern university.
Future directions
Based on the current findings, future research should begin to examine several questions. Additional studies are needed to examine whether an individual’s own drinking behavior predicts the perceived norms of different reference groups. Past research suggests that perceived norms for friends and others close to the individual are more accurate than perceived norms for students in general (Baer et al., 1991). A possible explanation for perceived norms more generally is that when students do not have a good idea of how much other students drink, they use their own behavior as an anchor and adjust upward. An adjustment of this sort may create an inaccurate estimation, but presumably students believe it is accurate and it influences their subsequent behavior accordingly. Directly evaluating whether students actually make such adjustments would also be valuable.
Future research should also directly evaluate whether individuals base their perceptions of peer-drinking quantity on their own behavior and which individuals are more likely to do so. It may be the heaviest drinkers that are more likely to show this pattern, in an effort to justify their own drinking practices. Those who drink less heavily may use their (mis)perceptions as a guide for their drinking behaviors.
Last, future research should evaluate the degree of certainty in perceived norms as a moderator of their influence. Individuals who are quite confident in their perceptions of the norm, for example, may be more likely to use those perceptions to guide their own alcohol consumption. In addition, they may be more resistant to norms-based intervention techniques. Current normative feedback interventions typically employ very simple, brief norms information. Individuals who are quite confident in their perceptions of drinking norms, however, may require more detailed evidence showing that their perceptions are inaccurate.
Footnotes
Preparation of this article was supported in part, by National Institute on Alcohol Abuse and Alcoholism grant R01AA014576.
References
- Agostinelli G, Brown JM, Miller WR. Effects of normative feedback on consumption among heavy drinking college students. J Drug Educ. 1995;25:31–40. doi: 10.2190/XD56-D6WR-7195-EAL3. [DOI] [PubMed] [Google Scholar]
- Arbuckle JL, Wothke W. Amos 4.0 User’s Guide. Chicago, IL: SmallWaters; 1999. [Google Scholar]
- Asch SE. Effects of group pressure upon the modification and distortion of judgment. In: Guetzkow H, editor. Groups, Leadership, and Men: Research in Human Relations. Oxford, England: Carnegie Press; 1951. pp. 177–190. [Google Scholar]
- Baer JS, Carney MM. Biases in the perceptions of consequences of alcohol use among college students. J Stud Alcohol. 1993;54:54–60. doi: 10.15288/jsa.1993.54.54. [DOI] [PubMed] [Google Scholar]
- Baer JS, Stacy A, Larimer M. Biases in the perception of drinking norms among college students. J Stud Alcohol. 1991;52:580–586. doi: 10.15288/jsa.1991.52.580. [DOI] [PubMed] [Google Scholar]
- Baron RM, Kenny DA. The moderator-mediator variable distinction in social psychological research: Conceptual, strategic, and statistical considerations. J Pers Social Psychol. 1986;51:1173–1182. doi: 10.1037//0022-3514.51.6.1173. [DOI] [PubMed] [Google Scholar]
- Bollen KA. Structural Equations with Latent Variables. New York: John Wiley & Sons; 1989. [Google Scholar]
- Borsari B, Carey KB. Effects of a brief motivational intervention with college student drinkers. J Cons Clin Psychol. 2000;68:728–733. [PubMed] [Google Scholar]
- Borsari B, Carey KB. Peer influences on college drinking: A review of the research. J Subst Abuse. 2001;13:391–424. doi: 10.1016/s0899-3289(01)00098-0. [DOI] [PubMed] [Google Scholar]
- Borsari B, Carey KB. Descriptive and injunctive norms in college drinking: A meta-analytic integration. J Stud Alcohol. 2003;64:331–341. doi: 10.15288/jsa.2003.64.331. [DOI] [PMC free article] [PubMed] [Google Scholar]
- Borsari B, Neal DJ, Collins SE, Carey KB. Differential utility of three indexes of risky drinking for predicting alcohol problems in college students. Psychol Addict Behav. 2001;15:321–324. doi: 10.1037//0893-164x.15.4.321. [DOI] [PMC free article] [PubMed] [Google Scholar]
- Bullers S, Cooper ML, Russell M. Social network drinking and adult alcohol involvement: A longitudinal exploration of the direction of influence. Addict Behav. 2001;26:181–199. doi: 10.1016/s0306-4603(00)00099-x. [DOI] [PubMed] [Google Scholar]
- Cialdini RB, Reno RR, KallGren CA. A focus theory of normative conduct: Recycling the concept of norms to reduce littering in public places. J Pers Social Psychol. 1990;58:1015–1026. [Google Scholar]
- Cohen J. Statistical Power Analysis for the Behavioral Sciences. San Diego, CA: Academic Press; 1988. [Google Scholar]
- Collins RL, Parks GA, Marlatt GA. Social determinants of alcohol consumption: The effects of social interaction and model status on the self-administration of alcohol. J Cons Clin Psychol. 1985;53:189–200. doi: 10.1037//0022-006x.53.2.189. [DOI] [PubMed] [Google Scholar]
- Collins SE, Carey KB, Sliwinski MJ. Mailed personalized normative feedback as a brief intervention for at-risk college drinkers. J Stud Alcohol. 2002;63:559–567. doi: 10.15288/jsa.2002.63.559. [DOI] [PubMed] [Google Scholar]
- Del Boca FK, Darkes J, Greenbaum PE, Goldman MS. Up close and personal: Temporal variability in the drinking of individual college students during their first year. J Cons Clin Psychol. 2004;72:155–164. doi: 10.1037/0022-006X.72.2.155. [DOI] [PubMed] [Google Scholar]
- Deutsch M, Gerard HB. A study of normative and informational social influence upon individual judgment. J Abnorm Social Psychol. 1955;51:629–636. doi: 10.1037/h0046408. [DOI] [PubMed] [Google Scholar]
- Festinger L. A theory of social comparison processes. Human Relat. 1954;7:117–140. [Google Scholar]
- Greenbaum P, Del Boca FK, Darkes J, Wang CP, Goldman MS. Variation in the drinking trajectories of freshmen college students. J Cons Clin Psychol. 2005;73:229–238. doi: 10.1037/0022-006X.73.2.229. [DOI] [PubMed] [Google Scholar]
- Johnston LD, O’Malley PM. Issues of validity and population coverage in student surveys of drug use. In: Rouse BA, Kozel NJ, Richard LG, editors. Self-Report Methods of Estimating Drug Use: Meeting Current Challenges to Validity. NIDA Research Monograph No. 57, DHHS Publication No. (ADM) 85-1402. Washington: Government Printing Office; 1985. pp. 31–54. [PubMed] [Google Scholar]
- Johnston LD, O’Malley PM, Bachman JG, Schulenberg JE. Monitoring the Future: National Survey Results on Drug Use, 1975-2003, Vol. 2, NIH Publication No. 04-5508. Bethesda, MD: Department of Health and Human Services; 2004. [Google Scholar]
- Kahler CW, Read JP, Wood MD, Palfai TP. Social environmental selection as a mediator of gender, ethnic, and personality effects on college student drinking. Psychol Addict Behav. 2003;17:226–234. doi: 10.1037/0893-164X.17.3.226. [DOI] [PubMed] [Google Scholar]
- Larimer ME, Turner AP, Anderson BK, Fader JS, Kilmer JR, Palmer RS, Cronce JM. Evaluating a brief alcohol intervention with fraternities. J Stud Alcohol. 2001;62:370–380. doi: 10.15288/jsa.2001.62.370. [DOI] [PubMed] [Google Scholar]
- Larimer ME, Turner AP, Mallett KA, Geisner IM. Predicting drinking behavior and alcohol-related problems among fraternity and sorority members: Examining the role of descriptive and injunctive norms. Psychol Addict Behav. 2004;18:203–212. doi: 10.1037/0893-164X.18.3.203. [DOI] [PMC free article] [PubMed] [Google Scholar]
- Latane B. The psychology of social impact. Amer Psychol. 1981;36:343–356. [Google Scholar]
- Lewis MA, Neighbors C. Gender-specific misperceptions of college student drinking norms. Psychol Addict Behav. 2004;18:334–339. doi: 10.1037/0893-164X.18.4.334. [DOI] [PubMed] [Google Scholar]
- Lewin K. Defining the “field at a given time”. Psychol Rev. 1943;50:292–310. [Google Scholar]
- MacKinnon DP, Dwyer JH. Estimating mediated effects in prevention studies. Eval Rev. 1993;17:144–158. [Google Scholar]
- Marks G, Graham JW, Hansen WB. Social projection and social conformity in adolescent alcohol use: A longitudinal analysis. Pers Social Psychol Bull. 1992;18:96–101. [Google Scholar]
- Marks G, Miller N. Ten years of research on the false-consensus effect: An empirical and theoretical review. Psychol Bull. 1987;102:72–90. [Google Scholar]
- Marlatt GA, Baer JS, Kivlahan DR, Dimeff LA, Larimer ME, Quigley LA, Somers JM, Williams E. Screening and brief intervention for high-risk college student drinkers: Results from a 2-year follow-up assessment. J Cons Clin Psychol. 1998;66:604–615. doi: 10.1037//0022-006x.66.4.604. [DOI] [PubMed] [Google Scholar]
- Mattern JL, Neighbors C. Social norms campaigns: Examining the relationship between changes in perceived norms and changes in drinking levels. J Stud Alcohol. 2004;65:489–493. doi: 10.15288/jsa.2004.65.489. [DOI] [PubMed] [Google Scholar]
- Miller DT, Prentice DA. The construction of social norms and standards. In: Higgins ET, Kruglanski AW, editors. Social Psychology: Handbook of Basic Principles. New York: Guilford Press; 1996. pp. 799–829. [Google Scholar]
- Neighbors C, Larimer ME, Lewis MA. Targeting misperceptions of descriptive drinking norms: Efficacy of a computer delivered personalized normative feedback intervention. J Cons Clin Psychol. 2004;72:434–447. doi: 10.1037/0022-006X.72.3.434. [DOI] [PubMed] [Google Scholar]
- Neighbors C, Lewis MA, Bergstrom RL, Larimer ME. Being controlled by normative influences: Self-determination as a moderator of a normative feedback alcohol intervention. Hlth Psych. doi: 10.1037/0278-6133.25.5.571. in press. [DOI] [PMC free article] [PubMed] [Google Scholar]
- Perkins HW. Social norms and the prevention of alcohol misuse in collegiate contexts. J Stud Alcohol. 2002;(Supplement No 14):164–172. doi: 10.15288/jsas.2002.s14.164. [DOI] [PubMed] [Google Scholar]
- Perkins HW, Berkowitz AD. Perceiving the community norms of alcohol use among students: Some research implications for campus alcohol education programming. Int J Addict. 1986;21(910):961–976. doi: 10.3109/10826088609077249. [DOI] [PubMed] [Google Scholar]
- Prentice DA, Miller DT. Pluralistic ignorance and alcohol use on campus; Some consequences of misperceiving the social norm. J Pers Social Psychol. 1993;64:243–256. doi: 10.1037//0022-3514.64.2.243. [DOI] [PubMed] [Google Scholar]
- Read JP, Wood MD, Capone C. A prospective investigation of relations between social influences and alcohol involvement during the transition into college. J Stud Alcohol. 2005;66:23–34. doi: 10.15288/jsa.2005.66.23. [DOI] [PubMed] [Google Scholar]
- Read JP, Wood MD, Davidoff OJ, Mclacken J, Campbell JF. Making the transition from high school to college The role of alcohol-related social influence factors in students’ drinking. Subst Abuse. 2002;23:53–65. doi: 10.1080/08897070209511474. [DOI] [PubMed] [Google Scholar]
- Rosenthal R, Rosnow RL. Essentials of Behavioral Research: Methods and Data Analysis. 2. New York: McGraw-Hill; 1991. [Google Scholar]
- Ross L, Greene D, House P. The “false consensus effect”: An egocentric bias in social perception and attribution processes. J Exp Social Psychol. 1977;13:279–301. [Google Scholar]
- Sherif M. The Psychology of Social Norms. New York: Harper; 1936. [Google Scholar]
- Smart RG, Suurvali HM, Mann RE. Do drinking surveys predict changes in population-based alcohol problem indicators? Alcohol Alcsm. 2000;35:255–258. doi: 10.1093/alcalc/35.3.255. [DOI] [PubMed] [Google Scholar]
- Suls J, Wan CK, Sanders GS. False consensus and false uniqueness in estimating the prevalence of health-protective behaviors. J Appl Social Psychol. 1988;18:66–79. [Google Scholar]
- Tajfel H, Turner JC. The social identity theory of inter-group behavior. In: Worchel S, Austin WG 2, editors. Psychology of Inter-group Relations. Chicago IL: Nelson-Hall; 1986. pp. 7–24. [Google Scholar]
- Turner JC, Hogg MA, Oakes PJ, Reicher SD, Wetherell MS. Rediscovering the Social Group: A self-Categorization Theory. New York: Blackwell; 1987. [Google Scholar]
- Walters ST. In praise of feedback: An effective intervention for college students who are heavy drinkers. J Amer Coll Hlth. 2000;48:235–238. doi: 10.1080/07448480009599310. [DOI] [PubMed] [Google Scholar]
- Walters ST, Bennett ME, Miller JH. Reducing alcohol use in college students: A controlled trial of two brief interventions. J Drug Educ. 2000;30:361–372. doi: 10.2190/JHML-0JPD-YE7L-14CT. [DOI] [PubMed] [Google Scholar]
- Walters ST, Neighbors C. Feedback interventions for college alcohol misuse: What, why and for whom? Addict Behav. 2005;30:1168–1182. doi: 10.1016/j.addbeh.2004.12.005. [DOI] [PMC free article] [PubMed] [Google Scholar]
- Wechsler H, Nelson TF, Lee JE, Seibring M, Lewis C, Keeling RP. Perception and reality: A national evaluation of social norms marketing interventions to reduce college students’ heavy alcohol use. J Stud Alcohol. 2003;64:484–494. doi: 10.15288/jsa.2003.64.484. [DOI] [PubMed] [Google Scholar]