

Abstract
Experimental laser microbeam techniques have become established tools for studying living specimens. A steerable, focused laser beam may be used for a variety of experimental manipulations such as laser microsurgery, optical trapping, localized photolysis of caged bioactive probes, and patterned photobleaching. Typically, purpose-designed experimental systems have been constructed for each of these applications. In order to assess the consequences of such experimental optical interventions, long-term, microscopic observation of the specimen is often required. Multiphoton excitation, because of its ability to obtain high-contrast images from deep within a specimen with minimal phototoxic effects, is a preferred technique for in vivo imaging. An optical workstation is described that combines the functionality of an experimental optical microbeam apparatus with a sensitive multiphoton imaging system designed for use with living specimens. Design considerations are discussed and examples of ongoing biological applications are presented. The integrated optical workstation concept offers advantages in terms of flexibility and versatility relative to systems implemented with separate imaging and experimental components.
I. INTRODUCTION
Experimental manipulations on living specimens using directed beams of light allow an investigator to perform precisely localized experiments within a tissue or even within a cell, without the trauma and collateral damage often associated with mechanical intervention. Optical microbeam techniques have been used to study a wide range of phenomena such as cytoskeletal dynamics, embryonic development, localized neural stimulation, and synaptic transmission. For example, continuous illumination has been used to bleach fiducial marks in microtubules in a mitotic spindle in order to reveal fluxes of microtubules during mitosis.1 Nanosecond pulses of blue light have been used to ablate cells in developing embryos in order to reveal inductive cell–cell interactions during development.2 Femtosecond pulses of infrared light have been used for two-photon photolysis of a caged neurotransmitter in order to study synaptic transmission.3 Femtosecond pulses of infrared light have also been shown effective in reversible stimulation of neuronal action potentials—without the presence of exogenous photoactive probes.4 What all these techniques have in common is that a steerable, focused microbeam of light is used to locally probe the specimen. However, the characteristics of the microbeam (i.e., wavelength, average power, peak power, pulse length) are different in each of these cases.
Any experimental manipulation has to be followed by a period of observation during which time the consequences of the experiment are analyzed. Different forms of microscopy may be used but fluorescence microscopy is frequently the method of choice because of its ability to reveal the distribution of one or several fluorescent reporter molecules within the specimen with low levels of background interference. Optical sectioning may be achieved with fluorescence microscopy by the use of confocal,5 two-photon,3 or computational deconvolution6 imaging techniques. The ability to maintain image contrast deep within specimens7,8 and the potential to provide improved viability9 have made multiphoton imaging increasingly favored for in vivo imaging.
Multiphoton imaging systems use laser raster scanning to assemble an image, as do most forms of confocal imaging. The underlying principle of this technique is that at very high-photon densities, an excitable molecule may simultaneously absorb two or more photons with the same consequences as the absorption of a single photon with an energy equal to the sum of the individual photon energies. In the case of two-photon imaging, the excitation wavelength is set to about twice that of the (one-photon) absorption peak of the fluorophore being observed, which would not normally produce any appreciable fluorophore excitation. However, if a high-power, ultrashort pulse laser is used, it is possible to achieve instantaneous photon densities that give rise to a significant yield of two-photon events at the focal volume of an objective lens, with a mean power level that will not produce optical trapping or damage a specimen. In this manner, fluorophore excitation is confined to the focal volume because the photon density is insufficient away from this region to generate appreciable multiphoton events. Optical sectioning is achieved because there is no appreciable fluorophore excitation above or below the focal volume (i.e., the plane of focus) thereby elegantly avoiding the problem of out-of-focus interference by not generating it in the first place. This, in turn, simplifies the optical system, as pinhole apertures do not have to be used to eliminate out-of-focus interference, as is required in a confocal microscope.
Multiphoton microscopy is particularly effective in obtaining images of optical sections from deep within a specimen. The longer near-infrared (NIR) wavelengths experience less scattering of the excitation photons compared to the UV and blue light that is typically used for fluorophore excitation in biological microscopy. There is negligible extinction of the NIR excitation from fluorophore above the plane of focus because the power density is too low for multiphoton excitation to occur in this region. The emission spectra of fluorophores has been found to be largely independent of the excitation method,10,11 which would suggest that the signal loss through emission scattering is the same for confocal and multiphoton systems. However, the ability of a multiphoton microscope to use all collected emission as signal, rather than only photons which pass through a confocal pinhole, confers an increase in detection efficiency together with a reduced sensitivity to scattering of the emission signal and focal plane mismatches between excitation and emission wavelengths. All of the above factors contribute to the deep sectioning capabilities of multiphoton imaging.8 This deep sectioning ability, or preservation of image contrast with depth, is particularly valuable for in vivo studies of intact tissues, which are often highly light scattering because of refractive index microheterogeneities in the cytosol. Additional advantages of multiphoton imaging for studies of living tissues arise from the localized excitation, which can minimize phototoxic effects arising from endogenous fluorophores12,13 and nonproductive (background) excitation of fluorophore.
There are potentially several significant advantages to combining the functionality of a multiphoton imaging system and general-purpose laser microbeam experimental system:
It is often necessary to observe the immediate consequences of an experimental manipulation; this is greatly facilitated if the experimental system and the multiphoton microscope are closely integrated rather than being physically separate instruments.
With close integration of the experimental and imaging systems it is possible to synchronize image acquisition with repetitive experimental interventions, as is possible with electrophysiology combined with fluorescence imaging.
The laser sources in an integrated optical workstation can separately be configured for either multiphoton imaging or experimentation, thereby increasing the versatility of the system compared to dedicated systems.
Shared functionality of major components between the imaging and experimental systems can lead to overall system economies.
In this article we describe a versatile optical workstation (OWS) based on a multiphoton (MP) imaging system that we developed for studying the dynamics of living specimens. The main optical interventions available are optical trapping, laser ablation/microsurgery, and localized photolysis. All of these experimental options are available for both of the excitation channels, so multiphoton imaging is always possible in combination (and synchrony) with an optical manipulation.
II. INSTRUMENT DESCRIPTION
The optical system diagram is shown in Fig. 1. The following subsystems will be covered in more detail: laser sources, scanning engine, microscope and environmental chamber, and signal detection system.
FIG. 1.
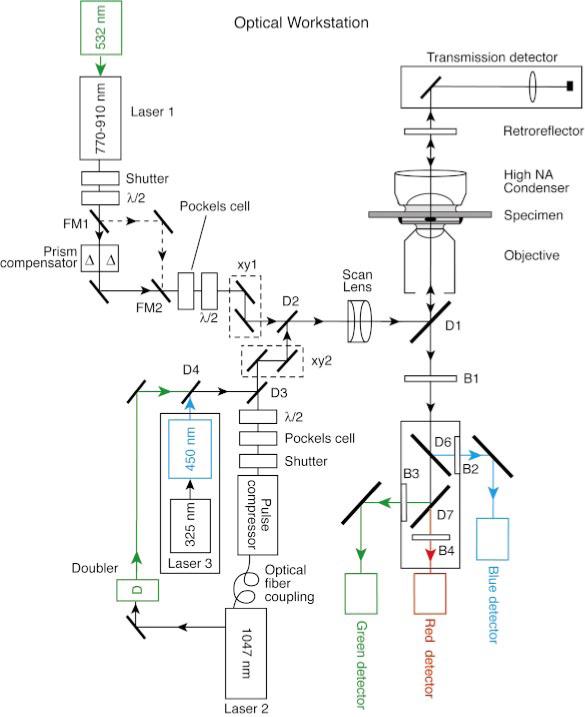
(Color) Optical layout of the workstation. The four main components are laser sources, scan engine, microscope and chamber, and signal detection. Laser sources: each of the two illumination paths (channels 1 and 2) has a femtosecond laser source with a mechanical shutter and is modulated by a Pockels cell. The angle of polarization of each source may be adjusted by the user by means of half-wave plates (λ/2); this facility is primarily used to optimize the plane of polarization for Nomarski (DIC) imaging with the transmission detector. Excitation channel 1 is dedicated to laser 1, which is a Ti:sapphire laser with an external SF-10 prism precompensator. The pulse compensator can be bypassed with flipper mirrors FM1 and FM2 in situations where sample pulse width is not critical. The second beam path, channel 2, includes lasers 2 and 3. The imaging laser, laser 2, is a fixed wavelength Nd:YLF laser (1047 nm) with an integral pulse prechirper/pulse compressor (4 ps–200 fs). The output of the oscillator may be diverted to a doubler (523 nm) in order to obtain a high-intensity green source. Laser 3 is a nanosecond, nitrogen-pumped, dye laser (∼450 nm) that is primarily used for laser microsurgery. Scan engine: two close-coupled XY scanners (channel 1: XY1 and channel 2: XY2) are used for beam deflection. The system can be configured such that either pair is (or both are) set up for imaging (i.e., raster scanning) while the other is used as a laser microbeam under the control of the experimenter. The two beams are combined by the dichromatic mirror, D2, and pass through an f/theta scan lens to the microscope. The incident laser beams and fluorescence emission signals are separated at the primary dichromatic mirror, D1. Three options are available for this mirror: ablation, trapping, and photolysis. Microscope and chamber: The microscope is enclosed in an environmental chamber. The transmission detector is placed in front of the microscope tungsten lamp. A movable mirror can pass the tungsten lamp or route the laser to the detector. Signal detection: fluorescent signal, typically, emanates from the focal volume in all directions. Signal traveling in the opposite direction from the illumination passes back through the objective through D1 and the IR barrier B1 and to the color separation dichromatic filters (D6 and D7). These mirrors are removable for full spectrum imaging via the central detector. The color-separated signal is detectable by three separate photomultiplier tubes. In addition, signal traveling in the same direction as the illumination can be reflected by a dichromatic back-reflector, D8, strategically positioned close to the field stop of the microscope's incandescent illumination source. This signal is reimaged by the high NA condenser back into the specimen and passes through the objective into the detectors. In this manner, signal emanating from both sides of the specimen may be utilized rather than only one side, as in a conventional microscope. The NIR light transmitted through the specimen passes through D8 and is detected by a sensitive silicon photodiode to obtain transmission images.
A. Laser sources
Three primary pulsed laser sources are available in the OWS. Excitation channel 1 is dedicated to the tunable titanium:sapphire (Ti:sapphire) laser. Excitation channel 2 includes the neodium:yittrium–lithium–fluoride (Nd:YLF) laser, and a nitrogen pumped dye laser.
1. Channel 1
A femtosecond Ti:sapphire laser (Tsunami, Spectra Physics) pumped with a 5 W, 532 nm solid-state laser (Spectra Physics, Millennia) was used mainly for multiphoton imaging in the wavelength range of 770−910 nm. The laser center wavelength and mode-locked pulse bandwidth were monitored with a scanning spectrum analyzer (Rees, model LSA201). The laser has a pulse repetition rate of 82 MHz and a mean power of around 400 mW at 900 nm. For multiphoton imaging systems to generate maximum fluorophore excitation with low mean power levels (to minimize one-photon damage), pulse widths have to be as short as is practical. A prism prechirper was used to compensate for the group velocity dispersion of the microscope optics that would otherwise stretch the ∼70 fs pulses of the Ti:sapphire laser significantly at the specimen plane.14 Optical losses by surface reflections through the precompensator were minimized by setting the orientation of polarization so that the e vector was perpendicular to the face of the prisms by means of a variable zero-order half-wave plate (New Focus, model 5540). In addition, the angle of incidence at each prism was set as close as possible to the Brewster angle. Provision was made to switch out the precompensator by means of two flip mirrors (New Focus, model 9891-L). The output power of the Ti:sapphire laser was adjusted by means of a Pockels cell (Con-Optics, model 350−50 with 302 driver) attenuator.
2. Channel 2
A diode-pumped, femtosecond Nd:YLF laser producing 1047 nm (a predecessor of the Coherent Biolight 1000 PC) provided an alternative, longer-wavelength source for multiphoton imaging and optical trapping. This laser had an adjustable, built-in prechirping system. The Nd:YLF laser uses an external nonlinear cavity for mode locking that produces ∼4 ps pulses.15 Blocking this cavity with a shutter produced pure continuous-wave laser light used for optical trapping experiments. With the external cavity engaged and the output routed to a single-mode fiber and an integral grating-based precompensator/compressor, the range of output pulse width was variable from ∼4ps to ∼200 fs.16 The compressed system provided a mean power output of around 510 mw and a pulse repetition rate of 120 MHz. Alternatively, the 1.4 W output of the oscillator (Fig. 1) could be routed to a separate frequency doubler to generate 430 mW of 523 nm light for fluorophore inactivation experiments. As with the Ti:sapphire laser, the output intensity of the Nd:YLF laser was adjusted by means of a Pockels cell (Con-Optics, model 350−50 with 302 driver) attenuator. A rotating carousel of neutral density filters (New Focus, model 5254) was added to increase the range of attenuation available.
The mean and peak powers of the two femtosecond lasers were monitored by tapping of a fraction of the beam with a microscope slide and using both linear and nonlinear detectors. Infrared-sensitive silicon diodes (Hamamatsu, S2386−44K) were used to monitor mean power and UV/visible-sensitve GaAsP diffusion diodes (Hamamatsu, G1116) measured two-photon-induced electron/hole pair creation for peak power detection.17 Both of the femtosecond lasers had beam expanders in the light path (Special Optics, model 50−3Q2−83−1064). These were adjusted so that the back aperture of the objective most commonly used (Nikon, CFI-60 Super Fluor 100×), was slightly overfilled in order to ensure that the objective was operating at its maximum numerical aperture for excitation.
The third laser was a nitrogen-pumped dye laser (Laser Sciences, VSL 337 ND-6 & DLM 220) for laser microsurgery18 or UV photolysis. This laser produced single or short bursts of nanosecond pulses and was controlled by a foot switch. Because blue light has been found to be most effective for laser ablation experiments in Caenorhabditis elegans,2 Coumarin 450 was used as the laser dye in the OWS.
B. Scanning engine
The optical layout of the OWS is depicted in Fig. 1. Two independent XY scanners were used to deflect two independent laser beams. Each excitation channel has a close-coupled pair of servogalvanometric scanners (General Luminomics, model G120) driven by purpose-designed power amplifiers (General Luminomics). The separation of the optical centers of the mirrors in each pair was 10 mm. The X and Y galvanometer mirrors for each pair were 10-mm-enhanced silver-coated mirrors. The Ti:sapphire laser was routed to the channel 1 scanners while both the Nd:YLF laser and the nitrogen pumped dye laser were routed to the other galvanometer pair. Each channel (galvanometer pair) could be connected to one of two possible electrical deflection signal sources: a manually specified voltage set by potentiometers, or a raster scan from a wave-form generator. The scanning wave forms were generated by the control electronics of a confocal microscope (Bio-Rad, Inc., MRC-1024). The confocal system software controlled the galvanometer scan parameters and detector signal acquisition. Thus, each scanner pair could be independently set to raster scan or used as a steerable laser microbeam. High-speed electrical shutters (Uniblitz, Inc., model D122) were used to switch the beams in each scanning pathway. These could be controlled either manually or electronically by the ‘‘scan active’’ signal from the confocal control electronics when used for imaging.
The two separate excitation channels were combined with a dichromatic mirror (D2) and passed through an f/theta scan lens [Zeiss, Inc., Part No. 4524268033 (IR)]. Each channel's XY deflector pair was carefully aligned so that the midpoints of the deflecting mirrors in each pair were in a conjugate plane to the back aperture of the microscope objective. The galvanometer amplifiers for each excitation channel were set for image coregistration to within two pixels. The scanned field was a square circumscribing the 22 mm eyepiece field, so the entire field of view was displayed. The number of pixels of the point-scanned image was determined by the confocal software (Bio-Rad, MRC-1024) with a maximum of 1024 pixels in each dimension.
C. Microscope
From the D2 dichromatic, illumination was coupled into the epiillumination light path of an inverted microscope (Nikon, Eclipse TE300DV) via a 200 mm focal length achromatic doublet coupling lens to a modified illumination adapter cube from a multiphoton microscope (Bio-Rad, MRC-1024MP). A dichromatic mirror (D1) in the cube deflects the beam onto the optic axis of the microscope. Three separate D1 mirrors and adapter cubes were installed, one for each of the microbeam modes of operation: laser ablation, optical trapping, and localized photolysis. Each cube permitted multiphoton imaging with either (or both) of the ultrashort pulse lasers. The cubes were manually changed before starting experiments. Emitted fluorescence signal was collected by the objective lens and condenser lens and then (<700 nm) passed through a hole in the D1 mirror mounts to the source blocker(s) and photodetectors situated under the microscope. To enable full computer control of the flexible time series acquisitions a motorized XYZ stage (Applied Scientific Inc., MS 2000) was fitted to the inverted microscope.
D. Environmental chamber
To observe developing mammalian embryos over extended periods, it was necessary to control the temperature of the microscope's environment. The entire microscope stage, condenser, and objective carrier was enclosed in a Lucite box fitted with access doors. The temperature in the vicinity of the specimen was measured with a thermistor probe and used to compare to a user-specified set point. The temperature error signal was used by a proportional controller to adjust the current supplied to an internal fan heater situated behind the microscope. A flask containing distilled water was installed at the stage height inside the chamber to humidify, mix, and warm the gasses required for certain tissues. The humidified mixed gasses could be passed into a minichamber on the stage19 to more closely approximate culture conditions and reduce the required gas volume for long-term imaging.
E. Signal detection system
Two basic imaging modalities were provided in the OWS: multiple channel multiphoton excitation fluorescence and laser-scanned bright-field transmission. The fluorescence signal does not have to be optically reimaged in a multiphoton microscope (unlike the case of a confocal microscope where the signal from the instantaneously illuminated volume has to be imaged at the confocal pinhole in order to achieve optical sectioning). Therefore, it is often advantageous to place the detectors as close as possible to the objective lens in order to pick up as much of the scattered signal as possible.20,21 In practice, collecting an f/2 cone of light from the objective back aperture is sufficient to collect all out-of-focus photons that pass through the objective, but the detection optics required become quite large with distance away from the back of the objective. We mounted a cluster of three photomultiplier detectors (Thorn EMI, two bialkali cathode, 9824B, and one S-20 cathode, 9828B) with associated color separation dichromatic mirrors and barrier filters through a 0.8× bottom port in the base of the microscope (Fig. 1). In this manner, some of the photons scattered within the sample may be, nevertheless, detected and used for imaging. This strategy can significantly enhance signal when recording images from deep within scattering samples,8 a situation in which most signal photons may suffer scattering. Dichromatic mirrors were used to form an efficient three-channel detector, to separate blue emission from green and red emission. Indeed, the design and fabrication of custom dichromatic coatings were essential for implementation of a viable and efficient optical workstation. For clarity, all of the dichromatic mirrors involved with the optical workstation are listed in Table I with their identification labels from Fig. 1 and the spectral ranges of reflection (or laser blocking) and transmission.
TABLE I.
Full list of dichromatic mirrors used in the optical workstation. Mirrors were custom manufactured by Chroma, Inc. All versions of the D1 main dichromatic mirror support dual MP laser imaging and optical trapping with either laser; additionally, each individual cube mounted mirror has a special feature: photolysis, ablation, or full spectral emission collection. D2—D4 are fixed, whereas D6—D8 are removable as needed. B1 is the main laser-blocking (barrier) filter. Filters B2—B4 are installed as need on the emission cubes (with D6 or D7).
| Name Fig. 1 |
Coating Chroma |
Role in OWS |
Reflect R>90% |
Transmit T>70% |
Notes |
|---|---|---|---|---|---|
| D1-A | 625DCSPXR | EX/EM 2P photolysis | 650−1000 nm | 410−610 nm | DAPI to TRITC |
| D1-B | 740DCSPXR | 2P photolysis | 775−1100 nm | 425−725 nm | DAPI to Cy5 |
| D1-C | 500DRLP (26034) | Ablation | 300−480 nm 745−1060 nm | 500−680 nm | FITC to Tx red |
| D1-D | 840DCSP special (25993) | Full em. spectrum | 860−1050 nm | 360−810 nm | INDO-1 to FM4−64 |
| D2 | 750DCLP (17803) | CH 2/CH 1 | 300−685 nm 1020−1100 nm | 760−940 nm | Restricts Ti:saph range |
| D3 | 725DCLPXR | Laser 3/2 | 300−700 nm | 750−1100 nm | |
| D4 | 495DCLPXR | Laser 3/523 | 300−485 nm | 500−700 nm+ | 405 nm diode |
| D6 | 495DCLPXR | Blue/green | 300−485 nm | 500−700 nm+ | Removable |
| D7 | 565DCLPXR | Green/red | 300−555 nm | 580−750 nm+ | Removable |
| D8 | 725DCLPXR | COND ENH | 300−700 nm | 750−1100 nm | Removable |
| NAME Fig. 1 |
Coating Chroma |
Role in OWS |
Block >5 O.D. |
Transmit >70% |
Notes |
| B1-A | E625SP special | D1-A barrier | 675−970 nm+ | 420−590 nm | DAPI to TRITC |
| B1-C | E690SP | D1-C barrier | 710−970 nm+ | 435−650 nm | DAPI to Tx red |
| B1-B | E700SP | D1-B barrier | 755−970 nm+ | 425−700 nm | DAPI to Cy5 |
| B1-B | E700SP special | D1-B barrier | 725−970 nm+ | 440−660 nm | DAPI to Tx red |
| B1-D | E800SP | D1-D barrier | 850−970 nm | 415−790 nm | DAPI to 4−64 |
| B1-D | BG39, 1 mm | D1-D barrier | 840−975 nm | 350−585 nm | INDO to FITC |
| B2 | HQ470/60 | Blue notch | 440−490 nm | With D6 cube | |
| B3 | HQ525/50 | Green notch | 500−550 nm | With D7 cube | |
| B4 | HQ610/75 | Red notch | 568−643 nm | With D7 cube | |
| E575LP | Yellow LP | With D7 cube |
For bright-field transmission imaging, the scanned NIR beam passing through the specimen was detected by an infrared photodiode incorporated into a Bio-Rad MRC-1024 transmission detector. Optical half-wave plates were positioned in each of the two excitation channels of the OWS to match the angle of polarization of each laser source to an appropriate (fixed) angle for the Nomarski optics of the microscope. The tunable wavelength Ti:sapphire laser of channel 1 required a variable zero-order half-wave plate (New Focus, model 5540).
F. Emission signal enhancement
A novel method of signal enhancement was implemented that enabled some of the fluorescence signal that is usually lost in the condenser light path to be utilized. A dichromatic mirror (Chroma, 720DCLPXR) reflected all signal < 720 nm, and transmitted the NIR laser wavelengths to the transmission detector (Fig. 1). An oil immersion NA 1.4 condenser was used to maximize the solid angle of the signal captured in this path. The efficiency of the condenser enhancement was measured for each objective lens with a 1.4 NA oil-immersion condenser lens. The following Nikon CFI60 objective lenses were investigated: Super Fluor 10×/0.5 NA, Plan Fluor 20×/0.75 NA multi-immersion, Plan Fluor 40×/1.3 NA oil immersion, and Super Fluor 100×/1.3 NA oil immersion. All DIC optics were removed from the condenser beam path, in addition, the condenser iris and field iris were opened to avoid vignetting of the enhancement signal. A flat, uniform, transparent sample (Nile Red dispersed in the mounting agent Fluoromount) was used for all the measurements. The condenser mirror was alternatively inserted and removed to measure signal improvement due to the mirror. Data values were obtained from the mean of six averaged images. The values were derived from a histogram of pixel values within a box encompassing a uniform region of the image. The same box position was used for each image of the time series. The ratio of with-mirror to without-mirror provides the signal improvement. Bleaching was negligible in the course of these observations.
III. RESULTS
A. Laser sources
The OWS (Fig. 1) can use either of two femtosecond excitation sources for MP imaging: a Ti:sapphire laser tunable between 770 and 910 nm or a fixed wavelength 1047 nm Nd:YLF laser. The maximum average power delivered to the back aperture of the objective lens was 60% for 900 nm (∼240 mW with 5 W pump laser) in channel 1, and 53% (270 mW) for 1047 nm in channel 2. For the Plan Fluor 40×/1.3 NA oil-immersion lens, this provided a maximum of 109 mW at the sample for 900 nm and 140 mW at the sample for 1047 nm. The Ti:sapphire laser provides the versatility to use a wide variety of fluorophores that are usually excited by blue light, particularly GFP, while the 1047 nm laser provides a longer wavelength that can more efficiently excite fluorophores such as YFP, DsRed, and FM4−64 (Molecular Probes, Inc., a membrane probe) with two-photon imaging and at the same time excite fluorophores such as DAPI, Hoechst, and INDO-1 with three-photon excitation.22 The laser that is not used for imaging can be used as a steerable laser microbeam for a number of experimental manipulations such as optical trapping,23 patterned laser bleaching experiments, or localized photolysis. Alternatively, both NIR lasers can be used for dual NIR excitation wavelength imaging. Slight trimming of the focus of one of the beam expanders could bring the focal volumes of the two lasers in to the same plane of focus, thereby compensating for longitudinal chromatic aberration in the system. In addition, a nanosecond nitrogen-pumped dye laser (channel 2) can be used for laser microsurgery in conjunction with MP imaging via the Ti:sapphire laser. The f/theta scan lens was very efficient with NIR transmission (87% at 1047 nm), but was poor (60%) for the 450 nm light.
B. Scanning engine
The heart of the OWS described is a dual scanning system that allows the independent positional control of two separate excitation channels. One problem with the design of any laser-scanning microscope with separate X and Y scan axes is that the scan axis needs to be in a conjugate plane to the back aperture of the objective in order to obtain uniform illumination over the field of view. If this requirement is not met then a hot spot is apparent at the center of the field caused by vignetting of the nonstationary beam as it moves across the back aperture.24 One way of overcoming this problem is to use transfer optics to transfer the conjugate plane of one deflection mirror to the other. However, the added bulk of transfer optics causes problems when trying to position two separate XY scanning systems close to the focal plane of a single scan lens. We, therefore, chose to use pairs of close-coupled galvanometers without transfer optics (Fig. 2) in conjunction with a single f/theta scan lens.
FIG. 2.

Optical scanning assembly. Two pairs of close-coupled servogalvanometers are used for deflecting the excitation channels of the OWS. The XY2 pair (channel 2) can be seen in front, the orthogonal XY1 pair (channel 1) is behind. The combining dichromatic mirror, D2, can be seen in the center and the f/theta scan lens to the lower right. The iris diaphragm mounted to the right of the D2 mirror is used for system alignment.
The system is set up so that the conjugate plane of the back aperture of the objective is situated midway between the two scan mirrors. This arrangement gives rise to a small amount of residual movement of the illumination on the back aperture during scanning. However, by simply slightly over-filling the back aperture by means of beam expanders in the each of the femtosecond lasers (Fig. 1), we generated uniform fields of illumination. Unlike the situation in a confocal microscope, there is no problem with slight errors in the galvanometer positions in the signal path in a multiphoton system with direct detection, because the emission signal is not reimaged.
C. Temperature control of specimen
One of the design requirements for the OWS was that it should be able to support the survival of mammalian embryos over extended periods of image collection. We, therefore, designed a temperature-controlled environmental chamber that enclosed most of the microscope to avoid focus changes due to changes in the temperature of the microscope body that can occur if the temperature-controlled region was confined to the microscope stage with a local stage heater. We used an internal fan heater controlled by a proportional control system to eliminate the small periodic temperature fluctuations produced when a simple on/off electromechanical thermostat is used. This temperature system, in conjunction with humidified mixed gasses, has been successfully used to observe developing hamster embryos over time periods of up to 48 h.25
D. Signal detection system: Emission signal enhancement
High numerical aperture lenses allow a broad cone of signal to be detected with a limiting solid angle of 2π sr. Fluorescent signals are emitted in all directions so that the half of the signal emitted away from the objective is generally lost. We implemented a scheme in the OWS that retrieves a useful fraction of this lost signal. We positioned a dichromatic reflector close to the field iris diaphragm. The coatings of the reflector were chosen such that the infrared (NIR) excitation passed through the reflector and could be used for bright-field transmission imaging by means of a photodetector (Fig. 1). However, the shorter wavelength emission signal is reflected back through the condenser optics and is reimaged at the specimen where it will now run in the same direction as the conventionally detected signal. The maximum relative condenser signal enhancement that this scheme could give would be 100%. However, losses in the condenser optics and absorption in the specimen reduce the enhancements obtained. We found that by using a standard high NA (1.4) oil-immersion condenser that we could get an enhancement of around 50% (Table II) when this strategy is used on transparent samples. Furthermore, we found that we could obtain enhancement over a focus range of 100 μm without having to refocus the condenser. The insensitivity to condenser focus is a consequence of not having to image the signal—due to the large (wide-field) detector depth of field.26 The whole signal path, objective plus condenser, is simply being used as a nonimaging, yet high-efficiency, signal collection system. The emission enhancement scheme as described has been patented.27
TABLE II.
Percentage increase in detected signal when the condenser enhancement signal reflector is used in the condenser light path. The sample was ∼35-nm-thick Nile red uniformly dispersed in fluoromount and mounted with a No. 1.5 cover slip. The mean value of all pixels in a scanned rectangle was compared with and without the reflector.
| Objective lens | 900 nm | 1047 nm |
|---|---|---|
| SF 10×/0.5−1 mm WD | 49% | 57% |
| PF 20×/0.75−0.33 mm WD | 46% | 58% |
| PF 40×/1.3−0.22 mm WD | 40% | 41% |
| SF 100×/1.3−0.20 mm WD | 26% | 24% |
E. Combined operation of MP imaging system and laser microbeam
1. Ablation
One of the main motivations for developing the OWS was to develop a system that could be used for undertaking laser microsurgery while observing a specimen using MP imaging. Previous studies in our laboratory had successfully used multiphoton imaging for visualizing membrane fusion in a developing C. elegans embryo.28 These studies were undertaken by bathing embryos in a fluorescent membrane probe and then permeabilizing the embryos at a critical developmental stage to allow ingression of the probe, and finally, transferring the specimen to a separate MP microscope for observation. This strategy was cumbersome and limited the experiments that could be undertaken because of the difficulties and delays in transferring the specimen from one system to another. These manipulations can now be carried out with comparative ease on the OWS, eliminating the time constraints of transporting specimens from one system to another, thereby increasing the range of experiments that can be performed by the system. Figure 3 illustrates an experiment in which the beam from the 450 nm dye laser (Fig. 1, excitation channel 2) was used to puncture the eggshell of a C. elegans embryo that was bathed in the membrane probe FM 2−10 (Molecular Probes). Figure 3(A) shows the embryo prior to the ablation where only the eggshell is faintly stained. The embryo was also simultaneously viewed by bright-field, transmission imaging [Figs. 3(E)–3(H)]. This was achieved by detecting the 900 nm excitation light from the Ti:sapphire laser (Fig. 1, excitation channel 1) that was transmitted through the specimen. When the eggshell was punctured by a short burst of nanosecond pulses from the dye laser (laser 3) microbeam, the plasma membranes of the one-cell embryo were rapidly labeled [Fig. 3(B)]. The embryo was then subsequently observed through the completion of cytokinesis [Figs. 3(B)–3(D)].
FIG. 3.

Laser ablation experiment. An early Caenorhabditis elegans egg was bathed in the membrane probe FM 2−10 and observed with 900 nm multiphoton excitation fluorescence imaging using [top row, (A)–(B)] and IR bright-field transmission imaging [bottom row, (E)–(H)]. Panels (A) and (E) show the initial situation before experimental intervention: the membrane probe is excluded from the interior of the embryo by the egg shell and viteline membrane, but weakly stains the eggshell. A short burst of 450 nm nanosecond pulses was aimed at the viteline membrane (arrow) causing a small perforation to be made through the membrane and eggshell and allowing ingression of the fluorescent probe. A few seconds later, the membranes of the two-cell embryo have become labeled (B). Successive frames [(B)–(D)] show the progression of the first cleavage furrow. Scale bar: 25 μm.
2. Trapping
We are currently developing strategies for selectively holding and moving bioactive probes around a specimen using optical trapping. For these experiments we use the 1047 nm Nd:YLF laser (Fig. 1, excitation channel 2) to set up an optical trap.23 In a feasibility test we set up a suspension of 200 nm fluorescent particles (Polysciences) in 10% glycerol. The particles were continuously observed with two-photon excitation provided by the Ti:sapphire laser (Fig. 1, excitation channel 1) tuned to 900 nm. When the optical trap was turned on, particles aggregated at the focus of the laser microbeam [Fig. 4(B)]. These aggregated particles were moved by the laser microbeam [Figs. 4(B)–4(D)] and when the 1047 nm trapping beam was shut off, the particles dispersed by Brownian motion [Fig. 4(E)]. This demonstration shows that the OWS can be readily configured to perform optical trapping experiments simultaneously with MP imaging.
FIG. 4.
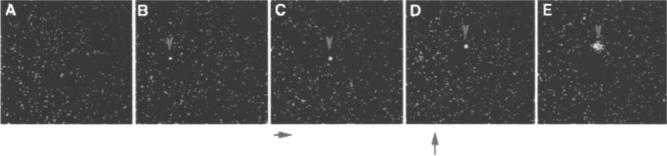
Laser trapping experiment. A field of 200 nm fluorescent beads was continuously observed using 900 nm multiphoton fluorescence excitation imaging. A 1047 nm trapping beam was activated in (B) and has caused beads to aggregate (arrow). The beam was moved to the right in (C), and up in (D), carrying the trapped beads along with it. The trapping beam was turned off in (D), and by (E) the beads can be seen to start to disaggregate through Brownian motion.
3. Dual source imaging
Alternatively, both short pulse lasers can be used at the same time to excite different probes (e.g., GFP and FM4−64) simultaneously. Dual imaging with 900 and 1047 nm has proven effective for double-labeled live-cell imaging as it enables YFP and GFP to be selectively excited.
IV. DISCUSSION
The OWS was developed as a versatile integrated experimental and observational tool for the study of developing embryos with maximum depth penetration and a minimum of deleterious phototoxic effects. The system has been in use for a couple of years and has proved to be a valuable tool for a variety of dynamic imaging applications in living vertebrate and invertebrate embryos.
A. Laser sources
The settings of the precompensator were wavelength dependent. To permit ease of use of the system for general users, we therefore optimized the precompensator in channel 1 for a wavelength of 900 nm, the most commonly used wavelength on our system. We have found in practice that the best use of the prechirper units is for the longer wavelengths where average power at the sample may be limited (especially with 100× objective lenses with small back apertures). The prechirper units can provide the most peak power to the sample when average power is limited. The prechirper for channel 1 could be easily bypassed with flip-up mirrors. This was useful for wavelengths lower than 900 nm that did not benefit from precompensation.
B. Signal enhancement
One of our main concerns when designing the OWS was to make the detection system as optically efficient as possible in order to visualize relatively fast events such as microtubule or membrane dynamics while using low levels of excitation so as to avoid bleaching and phototoxic effects. Under these regimens the signals are weak and noisy. Furthermore, the requirement for speed means that relatively short integration times have to be used. The OWS was designed to image weak fluorescent signals from thick, living specimens over long periods with minimum photodamage. The images are optically sectioned and collected as four-dimensional data sets, thereby allowing the dynamics of three-dimensional biological structures to be visualized. We used a systematic approach for optimizing the signal passed to the detectors: implementing non-de-scanned (direct) detection and an optical layout that permits the collection of signal over as large a solid angle as possible. We opted to forego the capability for confocal imaging in the OWS and to use only multiphoton imaging. This enabled an optical design that was more efficient at collecting low-level fluorescence signals by eliminating the pinhole apertures, with their associated optical losses in the descanned imaging signal light path. The wide-field detection scheme has increased collected photons while reducing the system sensitivity to chromatic aberrations and scattered emission light. The emission signal does not have to be optically imaged in a multiphoton system—resolution is solely defined by the point-spread function of the excitation. This feature facilitates emission light collection potentially from the entire solid angle, thereby increasing signal detection efficiency. We collected signal from both the objective and the condenser side of the sample to enhance the sensitivity of the OWS. We positioned a dichromatic, back-reflecting mirror29 as close as possible to the plane of the field iris in the transillumination light path of the microscope (Fig. 1). This mirror (Chroma, 720DCLPXR) reflected all signal <720 nm, which included most of the emission spectra from the commonly used fluorophores. In this manner, the signal emitted away from the objective (which is usually lost in an epifluorescence configuration) was reimaged at the specimen by the microscope condenser optics and passed to the detectors. The infrared excitation (>720 nm) was not reflected back and was detected by photodiodes for simple, transmitted light imaging (Fig. 1). The condenser lens enhancement system27 gives a useful increase in signal strength that facilitates observations of weakly fluorescing specimens that are transparent, such as small living organisms expressing fluorescent protein reporter transgenes. The enhancement system is very straightforward to use in practice. The specimen is simply brought in focus in the usual manner and the condenser adjusted for maximum signal strength. This enhancement system should be applicable to any multiphoton microscope with a high NA condenser, but the best performance will be obtained with an external detection scheme in the epifluorescence emission pathway. A more expensive but better option for deep imaging, is to place an additional detector in the condenser path with a high-extinction barrier filter and to combine the signals from the two detectors electronically.29
C. Applications of system and future developments
The system described along with its evolving predecessors has been used for a number of published studies. These studies include: studies of membrane fusion,28 studies of cleavage furrow formation,30 studies of mitochondrial dynamics in vertebrate embryos,31 studies of microtubule dynamics,32 studies of light-induced H2O2 production in cells,12 and multiphoton uncaging of caged diacylglycerol in muscle cells.33 The optical design has now stabilized and current and future efforts will be devoted to developing custom software that will allow predefined patterns of illumination to be executed by the nonimaging scanning system. This feature could be used to photolyze a caged molecule within a defined volume of a specimen while viewing the specimen using the other channel in an MP or bright-field imaging mode. We also plan to make our custom software control the motorized stage and also some motorized filter changers for key components such as the D1 dichromatic reflector. This capability will allow repetitive operations at several selected locations and facilitate rapid changes in operation mode between operations.
ACKNOWLEDGMENTS
The authors acknowledge the assistance of Dr. William Mohler and Dr. Victoria Centonze-Frohlich in early testing and development of the optical workstation. They also acknowledge support from NIH Grant No. R01-RR00570.
References
- 1.Gorbsky GJ, Sammak PJ, Borisy GG. J. Cell Biol. 1987;104:9. doi: 10.1083/jcb.104.1.9. [DOI] [PMC free article] [PubMed] [Google Scholar]
- 2.Sulston JE, White JG. Dev. Biol. 1980;78:577. doi: 10.1016/0012-1606(80)90353-x. [DOI] [PubMed] [Google Scholar]
- 3.Denk W, Strickler JH, Webb WW. Science. 1990;248:73. doi: 10.1126/science.2321027. [DOI] [PubMed] [Google Scholar]
- 4.Hirase H, Nikolenko V, Goldberg JH, Yuste R. J. Neurobiol. 2002;51:237. doi: 10.1002/neu.10056. [DOI] [PubMed] [Google Scholar]
- 5.Pawley J. In: Handbook of Confocal Microscopy. Pawley J, editor. Plenum; New York: 1995. [Google Scholar]
- 6.Agard DA, Sedat JW. Nature (London) 1983;302:676. doi: 10.1038/302676a0. [DOI] [PubMed] [Google Scholar]
- 7.Svoboda K, Denk W, Kleinfeld D, Tank DW. Nature (London) 1997;385:161. doi: 10.1038/385161a0. [DOI] [PubMed] [Google Scholar]
- 8.Centonze VE, White JG. Biophys. J. 1998;75:2015. doi: 10.1016/S0006-3495(98)77643-X. [DOI] [PMC free article] [PubMed] [Google Scholar]
- 9.Squirrell JM, Wokosin DL, White JG, Bavister BD. Nat. Biotechnol. 1999;17:763. doi: 10.1038/11698. [DOI] [PMC free article] [PubMed] [Google Scholar]
- 10.Curley PE, Ferguson AI, Amos WB, White JG. Opt. Quantum Electron. 1992;24:851. [Google Scholar]
- 11.Xu C, Zipfel W, Shear JB, Williams RM, Webb WW. Proc. Natl. Acad. Sci. U.S.A. 1996;93:10763. doi: 10.1073/pnas.93.20.10763. [DOI] [PMC free article] [PubMed] [Google Scholar]
- 12.Hockberger PE, Skimina TA, Centonze-Frohlich VE, Lavin C, Chu S, Reddy JK, White JG. Proc. Natl. Acad. Sci. U.S.A. 1999;96:6255. doi: 10.1073/pnas.96.11.6255. [DOI] [PMC free article] [PubMed] [Google Scholar]
- 13.Konig K. J. Microsc. 2000;200:83. doi: 10.1046/j.1365-2818.2000.00738.x. [DOI] [PubMed] [Google Scholar]
- 14.Guild JB, Xu C, Webb WW. Appl. Opt. 1997;36:397. doi: 10.1364/ao.36.000397. [DOI] [PubMed] [Google Scholar]
- 15.Malcolm GPA, Curley PF, Ferguson AI. Opt. Lett. 1990;15:1303. doi: 10.1364/ol.15.001303. [DOI] [PubMed] [Google Scholar]
- 16.Wokosin DL, et al. Proc. SPIE. 1996;2678:38. [Google Scholar]
- 17.Squire J, Muller M. Rev. Sci. Instrum. 2001;72:2855. [Google Scholar]
- 18.Avery L, Horvitz HR. Neuron. 1989;3:473. doi: 10.1016/0896-6273(89)90206-7. [DOI] [PubMed] [Google Scholar]
- 19.Bavister BD. In Vitro In Vitro Cell Dev. Biol. 1988 Aug;24:759–63. doi: 10.1007/BF02623645. [DOI] [PubMed] [Google Scholar]
- 20.Denk W, Delaney KR, Gelperin A, Kleinfeld D, Stowbridge BW, Tank DW, Yuste R. J. Neurosci. Methods. 1994;54:151. doi: 10.1016/0165-0270(94)90189-9. [DOI] [PubMed] [Google Scholar]
- 21.Williams RM, Piston DW, Webb WW. FASEB J. 1994;8:804. doi: 10.1096/fasebj.8.11.8070629. [DOI] [PubMed] [Google Scholar]
- 22.Wokosin DL, Centonze VE, Crittenden S, White JG. Bioimaging. 1996;4:208. [Google Scholar]
- 23.Ashkin A, Schutze K, Dziedzic JM, Euteneuer U, Schliwa M. Nature (London) 1990;348:346. doi: 10.1038/348346a0. [DOI] [PubMed] [Google Scholar]
- 24.Stelzer EHK. In: Handbook of Confocal Microascopy. Pawley J, editor. Plenum; New York: 1995. pp. 139–153. [Google Scholar]
- 25.Squirrell JM, Wokosin DL, White JG, Bavister BD. Microsc. Microanal. 1999;5:1060. [Google Scholar]
- 26.Dixon A, Hogg G. Proc. SPIE. 2001;4262:62. [Google Scholar]
- 27.White JG, Wokosin DL. 1999. U.S. Patent No. 6,169,289.
- 28.Mohler WA, Simske JS, Williams-Masson EM, Hardin JD, White JG. Curr. Biol. 1998;8:1087. doi: 10.1016/s0960-9822(98)70447-6. [DOI] [PubMed] [Google Scholar]
- 29.Mainen ZF, Mainen ZF, Maletic-Savatic M, Shi SH, Hayashi Y, Malinow R, Svoboda K. Methods. 1999;18:231. doi: 10.1006/meth.1999.0776. [DOI] [PubMed] [Google Scholar]
- 30.Skop AR, Bergmann D, Mohler WA, White JG. Curr. Biol. 2001;11:735. doi: 10.1016/s0960-9822(01)00231-7. [DOI] [PMC free article] [PubMed] [Google Scholar]
- 31.Squirrell JM, Lane M, Bavister BD. Biol. Reprod. 2001;64:1845. doi: 10.1095/biolreprod64.6.1845. [DOI] [PMC free article] [PubMed] [Google Scholar]
- 32.Strome S, et al. Mol. Biol. Cell. 2001;12:1751. doi: 10.1091/mbc.12.6.1751. [DOI] [PMC free article] [PubMed] [Google Scholar]
- 33.Pi YQ, Pfieffer ES, Robia SL, White JG, Walker JW. Biophys. J. 2000;78:432A. [Google Scholar]