

Abstract
Objective
Properly handling missing data is a challenge, especially when working with older populations that have high levels of morbidity and mortality. Methods have been developed to understand whether missing values are ignorable. We illustrate their use in a study of intensive care unit (ICU) delirium in an older cohort.
Study Design
Little’s Missing Completely at Random “MCAR test” (1988) assesses whether values are missing completely at random. The “Index of Sensitivity to Nonignorability (ISNI)” by Troxel and colleagues (2004) assesses the extent to which values are missing at random. Use of such missingness screens introduces complications for regression modeling, and, particularly, for risk factor selection. We propose a model fitting process that incorporates the use of missingness screens, controls for collinearity, and selects variables based on model fit.
Results
In a case study with simulated missing data, the proposed model fitting process identifies more actual risk factors for ICU delirium than does a complete case analysis.
Conclusion
Use of imputation and inverse weighting methods for handling missing data assist in the identification of risk factors. They do so accurately only when correct assumptions are made about the nature of missing data. Missingness screens enable researchers to investigate these assumptions.
Keywords: Missing data, regression modeling, delirium, intensive care unit, older adults
Introduction
Not every observation intended for collection in an epidemiologic study is actually collected because of mishaps, infeasibility, or loss to follow-up. Studies of older populations are especially liable to yield missing values that can bias estimates of associations and diminish precision. Recently new statistical tools have become available for assessing and handling missing values. Integrating such techniques into epidemiologic aging research is an important methodologic challenge. In this article, we describe and illustrate the use of missingness screens in regression modeling, and specifically, in model selection for a study of risk factors for delirium among older persons in a hospital’s intensive care unit (ICU).
Model selection is the process of determining which variables from a candidate list assembled on clinical grounds should be included in a multivariable regression model. Statistical criteria for a variable’s selection include its strength of association with the outcome, its independence from covariates, i.e., lack of collinearity and multicollinearity, and the extent to which the variable individually, and, in combination with others, satisfies assumptions of the model. Standard texts in regression analysis discuss model selection assuming complete case analyses, that is, analytic models in which observations that have missing data on any model variable are deleted (1–3). To our knowledge, none consider the impact that missing values can have on model selection. Although Harrell’s text (2001) discusses methods for characterizing and handling missing data as part of regression modeling, it does not discuss the use of missingness screens. Our objective is to indicate the appropriate use of missingness screens and the importance of repeating the multivariable model fitting process after addressing missing data issues.
Missingness Screens
The first step in grappling with missing values is to identify the mechanism that generates them. Rubin (4) described three types of missing data: missing completely at random (MCAR), missing at random (MAR), and not missing at random (NMAR). The latter type, NMAR, is referred to as nonignorable because one cannot draw correct statistical inferences from such data unless the missingness mechanism is modeled. These types of missing data are distinguishable in terms of how they are related to an indicator variable that is assigned a 1 if an observation is missing and a 0 if it is observed. Data are MCAR if the probability that this variable will be a 1 is independent of observed or unobserved values of intended data. For example, this may occur if a set of samples are missing due to lab error or if testing does not occur because of weekends or holidays. When data are MCAR parameter estimates are unbiased; however, statistical power is lower than if no data were missing.
Little (5) first devised a test for determining whether missing values are MCAR; newer tests have been developed for special types of missing data (6,7). For the case of two variables with only one having missing values, Little’s test reduces to a standard t-test of the equality of means. Specifically, the mean of the first variable with complete values is compared to its mean upon excluding individuals who had missing values on the second variable. Its null hypothesis is that the missing data is MCAR. Rejection provides evidence that MCAR does not apply and that parameter estimates from a regression model using only complete cases will be biased.
Missing values are MAR if the missingness indicator variable is dependent upon observed values of variables but is not dependent upon the values of missing observations. For example, the probability of missing data on functional disability may depend on gender, but within each gender the probability of missing values for a functional disability score would be unrelated to functional status. A regression model using MAR data may suffer from both bias and loss of statistical power in a complete case analysis. Methods for handling missing values are now available that can remedy both the bias and imprecision introduced by MAR values. Methods, such as multiple imputation (8,9), and inverse probability weighting (10,11) for nonresponse—the two most prominent in epidemiologic research (12,13)—draw upon observed information to attain accuracy and precision in parameter estimates. Screening tools have been developed that allow statisticians to assess the sensitivity of a regression model to nonignorability (14,15: 1224, 16,17). If the sensitivity to nonignorability is minimal then the missing data can be regarded as approximately MAR and multiple imputation or inverse weighting can be used.
The “Index for Sensitivity to Nonignorability (ISNI)” devised by Troxel and colleagues uses a nonignorability parameter that measures the extent to which the probability of an intended observation being observed depends upon the intended data, including values that are actually missing. When this parameter (γ) is equal to zero, then the missing values are MAR. The estimated parameter φ is the value whose sensitivity to nonignorability one is trying to assess. The ISNI is simply the extent to which an estimate of φ, for a given γ, depends on possible values for γ. (15: 1224). (See Appendix.)
Multivariable Model Selection
Missing values complicate the process of selecting risk factors that should be included in a multivariable regression model. For instance, when values are missing for candidate risk factors, the size of the data set will change as these variables enter and exit a complete case selection process. To avoid such difficulties, one might impute values or weight variables prior to initiating variable selection. Before imputing or weighting, however, one should confirm that missing values are MAR or MCAR. Little’s MCAR test can be applied to a large set of variables, although it may yield conservative results because it provides opportunities for violating the MCAR null hypothesis by variables that may never be selected for the final multivariable regression model. Application of the ISNI test is usually not feasible to a large set of variables because it involves actually fitting a regression model and problems of overfitting are likely to arise. In practice, using missingness screens in model selection often requires a two-stage process. First, one eliminates highly nonsignificant variables in complete case analyses, so that the missingness screens can be applied. A second step applies a selection process to imputed or weighted data when appropriate.
In the presence of a substantial amount of missing data, e.g., greater than 5% of the data set, we advocate as a first step a model selection process integrating aspects of all subsets selection, which assesses each unique combination of risk factors for every possible number of statistically significant risk factors, and forward selection. Our suggested model selection approach requires fewer individual comparisons than does the all subsets method and, unlike forward selection, allows multiple opportunities for risk factors to enter the multivariable model. Also, this approach makes better use of available data because, unlike backward elimination, only missing values of statistically significant variables reduce model sample size.
Statistical inference can only be reliably made from well-fit models. Using generalized linear regression, we select variables that have the largest likelihood ratio statistics. As indicated in Figure 1, unadjusted regression models are first fit for each candidate risk factor and the outcome. Risk factors in these bivariate models that show little evidence of an association with the outcome, for instance, whose p-values are > 0.2, are not considered further. Variables highly correlated with other variables, for instance with a ρ value > 0.4, and less strongly associated with the outcome than their correlates, are also eliminated. Variables that remain candidate risk factors after these initial screenings are entered into the multivariable model selection process. From among all of the bivariate models, the one with the largest likelihood ratio chi-square statistic is selected for inclusion in the final model, assuming it to be greater than some threshold value such as 3.84 or 2.7, levels associated with p-values of 0.05 and 0.10 for 1 degree of freedom. With this first variable in the model, the two-risk-factor models are fit for each of the candidate risk factors not selected previously. The additional candidate risk factor with the largest likelihood ratio chi-square statistic is then chosen for inclusion. The process is repeated for three-risk- factor models and for larger models until no added candidate risk factor makes a statistically significant contribution to the multivariable model.
Figure 1.
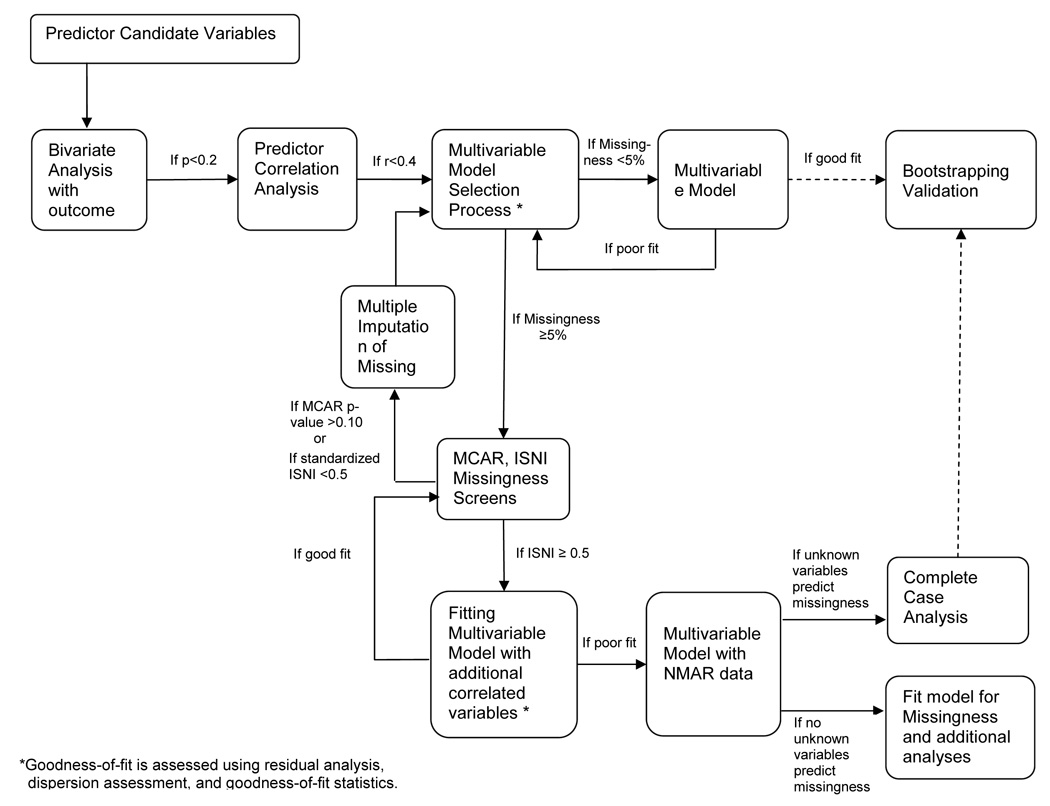
Diagram of a Model Fitting Process Using Missingness Screens
The Role of Missingness Screens in Regression Modeling
Upon obtaining a multivariable model by the complete case model selection process described above, one should assess how missing values might influence statistical inferences yielded by the model. If the proportion of missing values is small one might accept a complete case analysis, concluding that although bias may be introduced, if the missing data are not MCAR, it will be small. A similar analytical plan is reasonable, even though the proportion of missing data is fairly high, if Little’s MCAR test fails to reject the null hypothesis of MCAR missing values. One might be willing to forego loss of statistical power, so long as there is some assurance that the reduced data set will not seriously bias results.
If Little’s test indicates that the missing values are not MCAR, then it is prudent to further assess the missingness to see whether it is plausible to regard it as MAR. The ISNI does this directly for missing outcome values in the multivariable model being assessed. It can be used as an indirect and approximate measure of the impact of missing data in risk factors. The ISNI will almost always show that regression coefficients have some sensitivity to nonignorability—some departure from the MAR assumption—but if the departure is small, then well-implemented imputation or weighting techniques are likely to lead to less biased results than could be obtained from a original complete case analysis. As indicated in Figure 1, if ISNI results show some sensitivity to nonignorability, e.g., standardized ISNI ≥ 0.5, then one should repeat the estimation of the index with additional variables that are correlated with variables that have missing values. This is advisable because sensitivity to nonignorability is likely to decrease in the presence of these correlated variables.
If the ISNI results are acceptable then one can proceed with imputation or weighting to address missing data. Thus the model selection process should be repeated with the imputed or weighted data set. Since there are now no missing values, a simpler model selection process such as backward elimination might be used, or if the number of candidate variables is large, an automated stepwise selection process might be used. Traditional methods of assessing goodness-of-fit should be examined, e.g., residual analysis, influence diagnostics, and goodness-of-fit statistics. A final crucial step is model validation. If an external validation data set is not available, then bootstrapping methods should be used to assess the extent to which bias might have been introduced into parameter estimates by drawing upon information from this particular data set during the process of model selection (18).
On the other hand, if the ISNI is applied to the multivariable model to which correlated variables have been added still yields results suggesting nonignorability, then the missingness mechanism should be formally modeled., e.g., by selection models (19,20) and pattern-mixture models (21,22). They are beyond the scope of this study.
Case Study
The study sample consists of 304 patients aged 60 and older who were admitted consecutively to the intensive care unit (ICU) at the Yale-New Haven Hospital from September 5, 2002 through September 30, 2004. Details of how the population was enrolled can be found elsewhere (23). In this case study, 300 patients were identified who did not have missing values on the outcome of interest nor on ten candidate baseline risk factors. The outcome is whether patients had delirium at any time during their ICU stay. Risk factors considered in the regression modeling process were age greater than 75 years, male sex, nonwhite race, depression, any benzodiazepine or narcotic at baseline, high blood urea nitrogen/ creatinine ratio (BUN/ Cr ≥ 18), and high heart rate (> 110). Two indicator variables for dementia were included, one specified by surrogate or chart documentation and the other by the IQCODE (Informant Questionnaire on Cognitive Decline in the Elderly) (>3.3) (24). Finally, the Charlson Comorbidity Index was included as a three-level variable (25).
In the full 300-person data set the age, sex, and Charlson risk factors had p-values > 0.2 and were thus dropped from the model selection process. The two dementia variables were highly correlated, with the IQCODE risk factor having a stronger association with the outcome. Since only six candidate risk factors remained for consideration, none of which had missing values, we used a backward elimination selection process. Results show that dementia at baseline is a strong risk factor for ICU delirium while baseline medication status, BUN/Cr level, and race are more moderate risk factors (Table 1, top panel).
Table 1.
Comparative Logistic Regression Analyses of a Data Set with Induced Missing Values (Selected Models)
| Variable | Parameter Estimate | 95% Confidence Interval | P-value | |
|---|---|---|---|---|
| Full Data Set Analysis (N=300) | ||||
| Dementia by IQCODE (>3.3) | 1.865 | 0.901, 2.830 | <0.001 | |
| Any Benzodiazepines or Narcotics at baseline | 1.113 | 0.305, 1.920 | 0.007 | |
| BUN/Cr (>18) | 0.890 | 0.256, 1.525 | 0.006 | |
| Non-white race | 1.019 | 0.021, 2.016 | 0.045 | |
| Complete Case Analysis (N=210) | ||||
| Dementia by IQCODE (>3.3) | 2.004 | 0.935, 3.072 | <0.001 | |
| Multiply Imputed Data Sets Analysis (N=300) | ||||
| Dementia by IQCODE (>3.3) | 2.016 | 0.948, 3.084 | <0.001 | |
| Any Benzodiazepines or Narcotics | 0.939 | 0.110, 1.769 | 0.026 | |
| BUN/Cr (>18) | 0.725 | 0.058, 1.392 | 0.033 | |
| Non-white Race | 1.071 | 0.012, 2.130 | 0.048 | |
Abbreviations: IQCODE-Informant Questionnaire on Cognitive Decline in the Elderly, BUN/Cr-Blood Urea Nitrogen/Creatinine
To introduce missing values we randomly deleted 30% of the ICU delirium values for patients with above average “Acute Physiology and Chronic Health Evaluation II,” (APACHE II) scores (26). This instrument measures illness severity implying that the patients randomly assigned missing values are from the relatively ill portion of the original study population. Next, Little’s MCAR test was performed and, as expected, showed that the induced missing values were not missing completely at random (χ2 = 19.39, 10 degrees of freedom, p-value 0.036). (The MCAR null hypothesis was even more strongly rejected in a test using continuous variables, where possible.) This indicates that a complete case analysis will have lower power and biased estimates.
For the 210 patients with no outcome missing values a complete case analysis was done using the regression modeling approach described above. Four variables were again eliminated by preliminary screenings. The six remaining risk factors were further examined for inclusion in a multivariable model. Results indicate that only dementia remained statistically significant (Table 1, middle panel).
When the three other significant risk factors from the full data set model were forced into the complete case model with 30% of the relatively ill persons removed, they were not statistically significant at the 0.05 level because of the loss of statistical power from a reduced sample size and because of downwardly biased parameter estimates (Table 2). This application of a missingness screen suggests that one should not be content with a complete case analysis but should attempt to address missing data so as to reduce bias and restores statistical power.
Table 2.
Complete Case Logistic Regression Model Having Four Explanatory Variables of a Data Set with Induced Missing Values (For Comparison with Table 1)
| Variable | Parameter Estimate | 95% Confidence Interval | P-value |
|---|---|---|---|
| Complete Case Analysis (N=210) | |||
| Dementia by IQCODE (>3.3) | 1.868 | 0.787, 2.948 | <0.001 |
| Any Benzodiazepines or Narcotics | 0.869 | −0.013, 1.750 | 0.053 |
| BUN/Cr (>18) | 0.624 | −0.061, 1.310 | 0.074 |
| Non-white race | 0.865 | −0.2469, 1.978 | 0.127 |
Abbreviations: IQCODE-Informant Questionnaire on Cognitive Decline in the Elderly, BUN/Cr-Blood Urea Nitrogen/Creatinine
Results of applying the ISNI to these data show that the standardized ISNI values for risk factors are only modestly > 0, with the BUN/Cr (|ISNI/SE| = 0.527) showing the most sensitivity to nonignorability (Table 3, top panel ). Following the interpretive guidelines in the appendix, we used in our interpretation a negative nonignorability parameter, γ, because the missing values in this case are among the relatively ill. The ISNI values in our results are consistently negative and the parameter estimates, the φ values, are positive. Since the ISNI value is negative, and γ and φ have opposite signs, one expects departures from MAR to yield parameter estimates that are underestimated; this is the case for BUN/Cr (Table 2).
Table 3.
Index of Sensitivity to Nonignorability (ISNI) Values for Several Models with Missing Outcome Data (N=210)
| Variable | Parameter Estimate | Standard Error | ISNI | |ISNI/SE| |
|---|---|---|---|---|
| Model with Independent Variables of Interest | ||||
| Dementia by IQCODE (>3.3) | 1.868 | 0.551 | −0.098 | 0.178 |
| Any Benzodiazepines or Narcotics | 0.869 | 0.450 | −0.168 | 0.374 |
| BUN/Cr (>18) | 0.624 | 0.350 | −0.184 | 0.527 |
| Non-white race | 0.865 | 0.568 | −0.148 | 0.261 |
| Model with Additional Independent Variables Highly Correlated with the Outcome, i.e., Dementia by Surrogate or Chart and APACHE II | ||||
| Dementia by IQCODE (>3.3) | 1.613 | 0.606 | −0.025 | 0.041 |
| Any Benzodiazepines or Narcotics | 0.474 | 0.473 | 0.008 | 0.017 |
| BUN/Cr (>18) | 0.548 | 0.379 | −0.070 | 0.185 |
| Non-white race | 1.281 | 0.615 | −0.092 | 0.149 |
Abbreviations: ISNI-Index for Sensitivity to Nonignorability, SE-Standard Error, IQCODE-Informant Questionnaire on Cognitive Decline in the Elderly, BUN/Cr-Blood Urea Nitrogen/Creatinine, APACHE II-Acute Physiology and Chronic Health Evaluation II
The addition of the dementia by surrogate or chart variable and the APACHE II variable to the ISNI model moves the standardized ISNI values toward their null value, e.g., BUN/CR changes from 0.527 to 0.185 (Table 3, top and bottom panels). This supports the assessment that missingness is MAR, because the missingness is partially accounted for by observed data such as APACHE II scores. Practically, this implies that performing imputation by drawing upon information from health status variables highly correlated with the outcome having missing values will probably yield relatively unbiased results.
Using SAS® statistical software (27) we multiply imputed missing values for the outcome variable, while drawing upon information from all of the candidate risk factors, APACHE II, and additional health status variables. Again, age, sex, Charlson, and dementia variables were eliminated in preliminary screenings. The analysis of the remaining variables using the imputed data set identifies risk factors better than does the complete case analysis (Table 1, bottom panel). This is partially due to the increased power of working with a sample size of 300, but it is also due to parameter estimates in some cases that are closer to the full data set results than are the complete case results (Table 2). Imputation results are limited by the small size of the data set and the small number of covariates used in this illustration.
Conclusion
Missingness screens are new statistical techniques that help assess the character of the missing values in a group of variables. Such assessments, in turn, provide practical guidance in regression modeling, and especially, in model selection. We recommend a two-step approach to model selection in the presence of missing data. First, a complete case analysis should be performed that eliminates variables that have very weak associations with the outcome or strong correlations among themselves. The model selection process recommended here emphasizes good model fit: use of likelihood ratio statistics and a modification of all subsets selection reflect this concern. This first step yields a group of candidate risk factors of manageable size for use with missingness screens. Given appropriate results from the missingness screens, multiple imputation or inverse weighting can then be used to address missing values. At this point a second step of model selection should be undertaken. With an effectively full data set, various model selection processes are usable (28).
Several missingness screens have been developed; we demonstrated two that are relatively easy to apply and understand. The threshold values in Figure 1 are relevant to the data set and objectives of the analysis we conducted on this older hospitalized cohort; other circumstances might warrant different thresholds. We conclude by noting that even with the advent of new statistical techniques like missingness screens, regression modeling and model selection remain practices requiring experience and judgment in addition to careful calculation.
Figure 2.
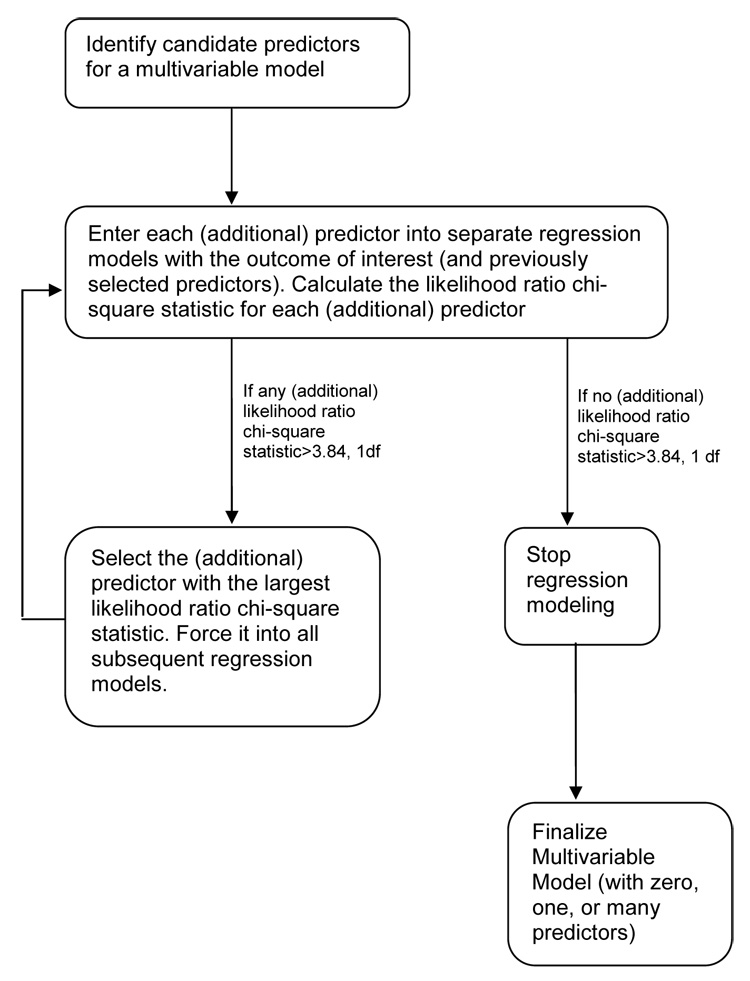
Diagram of a Multivariable Model Selection Process
Acknowledgements
This work was supported in part by grants from the Biostatistics Core of the Claude D. Pepper Older Americans Independence Center at Yale University School of Medicine (#P30AG21342) and the following organizations: American Lung Association, Merck/AFAR and Chest Foundation/ASP/T. Franklin Williams Geriatric Development Initiative. The authors thank Prof. Haiqun Lin for her assistance.
Footnotes
Publisher's Disclaimer: This is a PDF file of an unedited manuscript that has been accepted for publication. As a service to our customers we are providing this early version of the manuscript. The manuscript will undergo copyediting, typesetting, and review of the resulting proof before it is published in its final citable form. Please note that during the production process errors may be discovered which could affect the content, and all legal disclaimers that apply to the journal pertain.
References
- 1.Kleinbaum DG, Kupper LL, Muller KE, Nizam A. Applied Regression Analysis and Other Multivariable Methods. 3rd ed. Pacific Grove, CA: Duxbury Press; 1998. [Google Scholar]
- 2.Draper NR, Smith H. Applied Regression Analysis. New York: John Wiley & Sons; 1998. [Google Scholar]
- 3.Kutner MH, Nachtsheim CJ, Neter J, Li W. Applied Linear Statistical Models. 5th ed. New York: McGraw-Hill/ Irwin; 2005. [Google Scholar]
- 4.Rubin DB. Inference and missing data (with discussion) Biometrika. 1976;63:581–592. [Google Scholar]
- 5.Little RJA. A test of missing completely at random for multivariate data with missing values. J Am Stat Assoc. 1988;83(404):1198–1202. [Google Scholar]
- 6.Park T, Davis CS. A test of the missing data mechanism for repeated categorical data. Biometrics. 1993;49:631–638. [PubMed] [Google Scholar]
- 7.Chen HY, Little RJA. A test of missing completely at random for generalized estimating equations with missing data. Biometrika. 1999;86:1–13. [Google Scholar]
- 8.Rubin DB. Multiple Imputation for Nonresponse in Surveys. New York: John Wiley & Sons; 1987. [Google Scholar]
- 9.Rubin DB. Multiple imputation after 18+ years (with discussion) J Am Stat Assoc. 1996;91:473–489. [Google Scholar]
- 10.Robins JM, Rotnitzky A, Zhao LP. Analysis of semiparametric regression models for repeated outcomes in the presence of missing data. J Am Stat Assoc. 1995;93:1321–1329. [Google Scholar]
- 11.Lin H, Scharfstein DO, Rosenheck RA. Analysis of longitudinal data with irregular, outcome-dependent follow-up. Journal of the Royal Statistical Society, Series B. 2004;66:791–813. [Google Scholar]
- 12.Youk AO, Stone RA, Marsh GM. A method for imputing missing data in longitudinal studies. Ann Epidemiol. 2004;14:354–361. doi: 10.1016/j.annepidem.2003.09.010. [DOI] [PubMed] [Google Scholar]
- 13.Rao RS, Sigurdson AJ, Doody MM, Braubard BI. An application of a weighting method to adjust for nonresponse in standardized incidence ratio analysis of cohort studies. Ann Epidemiol. 2004;15:129–136. doi: 10.1016/j.annepidem.2004.05.007. [DOI] [PubMed] [Google Scholar]
- 14.Qu A, Song PX-K. Testing ignorable missingness in estimating equation approaches for longitudinal data. Biometrika. 2002;89:841–850. [Google Scholar]
- 15.Troxel AB, Ma GG, Heitjan DF. An index of local sensitivity to nonignorability. Statistica Sinica. 2004;14:1221–1237. [Google Scholar]
- 16.Ma G, Troxel AB, Heitjan DF. An index of local sensitivity to nonignorable dropout in longitudinal modeling. Stat Med. 2005;24:2129–2150. doi: 10.1002/sim.2107. [DOI] [PubMed] [Google Scholar]
- 17.Potthoff RF, Tudor GE, Pieper KS, Hasselblad V. Can one asses whether missing data are missing at random in medical studies? Stat Methods Med Res. 2006;15:213–234. doi: 10.1191/0962280206sm448oa. [DOI] [PubMed] [Google Scholar]
- 18.Efron B, Tibshirani RJ. An Introduction to the Bootstrap. London: Chapman & Hall / CRC; 1993. [Google Scholar]
- 19.Heckman JJ. The common structure of statistical models of truncated, sample selection and limited dependent variables, and a simple estimator of such models. Annals of Economic and Social Measurement. 1976;5:475–492. [Google Scholar]
- 20.Diggle P, Kenward MG. Informative drop-out in longitudinal data analysis. Journal of the Royal Statistical Society Series C. 1994;43:49–73. [Google Scholar]
- 21.Rubin DB. Formalizing subjective notions about the effects on nonrespondents in sample surveys. J Am Stat Assoc. 1977;72:538–543. [Google Scholar]
- 22.Little RJA. Pattern-mixture models for multivariate incomplete data. J Am Stat Assoc. 1993;88:125–134. [Google Scholar]
- 23.Pisani MA, Murphy TE, Van Ness PH, Araujo KLB, Inouye SK. Admission characteristics associated with delirium in patients in a medical intensive care unit. 2006 doi: 10.1001/archinte.167.15.1629. under review. [DOI] [PubMed] [Google Scholar]
- 24.Jorm AF. A short form of the Informant Questionnaire on Cognitive Decline in the Elderly (IQCODE): development and cross-validation. Psychol Med. 1994;24:145–153. doi: 10.1017/s003329170002691x. [DOI] [PubMed] [Google Scholar]
- 25.Charlson ME, Pompei P, Ales KL, MacKenzie CR. A new method of classifying prognostic comorbidity in longitudinal studies: development and validation. J Chronic Dis. 1987;40:373–383. doi: 10.1016/0021-9681(87)90171-8. [DOI] [PubMed] [Google Scholar]
- 26.Knaus WA, Draper EA, Wagner DP, Zimmerman JE. APACHE II: A severity of disease classification system. Crit Care Med. 1985;13:818–829. [PubMed] [Google Scholar]
- 27.SAS/STAT. User’s Guide. Cary, NC: SAS Institute, Inc; 2005. [Google Scholar]
- 28.Miller AJ. Subset Selection in Regression. 2nd ed. London: Chapman & Hall; 2002. [Google Scholar]