

Abstract
This study explored how resin type affects selected physicochemical properties of complex methacrylate copolymers and their amorphous calcium phosphate (ACP)-filled and glass-filled composites. Two series of photo-polymerizable resin matrices were formulated employing 2,2-bis[p-(2’-hydroxy-3’-methacryloxypropoxy)phenyl]propane (Bis-GMA) or an ethoxylated bisphenol A dimethacrylate (EBPADMA) as the base monomer, Unfilled copolymers and composites filled with a mass fraction with 40 %, 35 % and 30 %, respectively, of ACP or the un-silanized glass were assessed for biaxial flexure strength (BFS), water sorption (WS) and mineral ion release upon immersion in HEPES-buffered saline solution for up to six months. Substituting EBPADMA for Bis-GMA significantly reduced the WS while only marginally affected the BFS of both dry and wet copolymers. Independent of the filler level, both dry and wet ACP composites formulated with either BTHM or ETHM resins were mechanically weaker than the corresponding copolymers. The BFS of ACP composite specimens after 1 month in saline did not further decrease with further aqueous exposure. The BFS of glass-filled composites decreased with the increased level of the glass filler and the time of aqueous exposure. After 6 months of immersion, the BFS of glass-filled BTHM and ETHM composites, respectively, remained 58 % and 41 % higher than the BFS of the corresponding ACP composites. Ion release data indicated that a minimum mass fraction of 35 % ACP was required to attain the desired solution supersaturation with respect to hydroxyapatite for both the BTHM and ETHM derived composites.
Keywords: amorphous calcium phosphate, composites, dimethacrylate resins, dimethacrylate composites, mechanical strength, ion release, photo-polymerization, water sorption
INTRODUCTION
Methacrylate polymeric networks with good resistance to aqueous milieu are sought for use in both prophylactic and restorative dentistry [1]. The most commonly utilized binary dental resins contain 2,2-bis[p-(2’-hydroxy-3’-methacryloxypropoxy)phenyl]propane (Bis-GMA; a highly viscous base monomer) and tri(ethylene glycol) dimethacrylate (TEGDMA; a fluid, flexible diluent monomer). Bis-GMA/TEGDMA resins are known for their relatively high water sorption (WS), significant shrinkage upon polymerization (PS) and low to moderate degrees of vinyl conversion (DC), frequently resulting in unfavorable service life of Bis-GMA/TEGDMA composites [2]. Dental polymers based on ethoxylated bisphenol A dimethacrylates (EBPADMA) are more hydrophobic analogs of Bis-GMA, and reportedly exhibit higher DC and lower PS than the typical Bis-GMA/TEGDMA resin systems [3]. These properties are primarily attributed to the more flexible structure, lower viscosity, higher molecular mass and lower content of diluent monomer needed for EBPADMA, compared to Bis-GMA monomer. Additionally, an improved ion release (a prerequisite for effective anti-cariogenic action of ACP-filled composites) was obtained in ACP-ETHM composites that were formulated with a high EBPADMA/TEGDMA ratio in the resin matrix [4].
In this study, two bi-functional, surface-active monomers, the highly hydrophilic 2-hydroxyethyl methacrylate (HEMA), and less hydrophilic carboxylic acid monomer, methacryloyloxyethyl phthalate (MEP), were incorporated into Bis-GMA/TEGDMA and EBPADMA/TEGDMA resins in order to enhance the adhesion of the composite to the tooth surfaces in potential clinical application [5]. Previous studies suggested that, compared to Bis-GMA-based composite resins, similar EBPADMA-based formulations would have lower WS while maintaining adequate ion release and mechanical strength. To test this hypothesis, BTHM and ETHM copolymers derived from photo-polymerization of the activated unfilled resins (BTHM and ETHM acronyms were derived from the first letter of each monomer) and their corresponding zirconia-ACP (Zr-ACP) filled composites were formulated and evaluated for WS, ion release and biaxial flexural strength (BFS) after prolonged exposure to an aqueous environment. In addition, non-releasing control composites were prepared from the same resins with an un-silanized glass filler admixed with zirconia, and evaluated for WS and BFS under identical storage conditions.
MATERIALS AND METHODS
The methodologies and techniques that were utilized to characterize the ACP and glass fillers, and also to physico-chemically evaluate the unfilled copolymers and their composites are summarized in Table 1. The indicated acronyms will be used throughout this manuscript.
Table 1.
Methods/techniques utilized in physicochemical characterization of the fillers, copolymers and composites.
| Method | Property |
|---|---|
| X-ray diffraction (XRD) | Long-range crystalline order of ACP filler |
| Fourier-transform infrared (FTIR) spectroscopy | Structure/composition of ACP filler |
| Particle size analysis | Particle size distribution (PSD) of the fillers |
| Scanning electron microscopy (SEM) | Morphology and/or topology of the fillers |
| Ultraviolet/visible (UV/VIS) spectrophotometry | Kinetics of Ca and PO4 release from composites |
| Mechanical testing | Biaxial flexure strength (BFS) of copolymers and composites |
| Gravimetry | Water sorption (WS) of copolymers and composites |
ACP Filler Synthesis; Characterization of the Fillers
Zirconia-hybridized ACP (Zr-ACP) was synthesized as detailed earlier [5, 6]. It precipitated instantaneously in a closed system at 23 °C upon rapidly mixing equal volumes of a 800 mmol/L Ca(NO3)2 solution, a 536 mmol/L Na2HPO4 solution that contained a molar fraction of 2 % Na4P2O7 as a stabilizing component for ACP, and an appropriate volume of a 250 mmol/L ZrOCl2 solution (mole fraction of 10 % ZrOCl2 based on Ca reactant). The reaction pH varied between 8.6 and 9.0. The suspension was filtered, the solid phase washed subsequently with ice-cold ammoniated water and acetone, and then lyophilized. To avoid exposure to humidity, Zr-ACP was kept in a dessicator over anhydrous CaSO4 under vacuum (2.7 kPa) until utilized in composite formulations.
The bio-inert, control filler was prepared by mixing un-silanized OX50 glass (Degussa-Huls AG, Frankfurt/Main, Germany) and ZrO2 (Degussa Corp., Richfield Park, NJ, USA) in a 9:1 mass ratio. ZrO2 was introduced to simulate the presence and approximate the amount (mass fraction between 10 % and 20 %) of amorphous, HCl-insoluble zirconia phosphate in Zr-ACP [6].
The amorphous state of ACP was verified by powder XRD (Rigaku DMAX 2000 X-ray diffractometer, Rigaku/USA Inc., Danvers, MA, USA) and FTIR (Nicolet Magna-IR FTIR 550 spectrophotometer, Nicolet Instrumentations Inc., Madison, WI, USA). XRD patterns were recorded from 4° to 60° 2θ with CuKα radiation (λ= 0.154 nm) at 40 kV and 40 mA. ACP samples were step-scanned in intervals of 0.010° 2θ at a scanning speed of 1.000°/min. The FTIR spectra (4000 cm−1 to 400 cm−1) of ACP specimens were recorded using a KBr pellet technique ((0.8 to 1.0) mg solid/400 mg KBr).
The particle size distributions (PSDs) of the ACP filler and the control OX50/ZrO2 glass filler were measured using a computerized inspection system for particle size analysis (Ankersmid C100, Metropolitan Computing Corp., E. Hanover, NJ, USA; [7,8]). Solids were analyzed in the dry state (five runs for each experimental group) and presented as volume and number distribution histograms. In addition to the PSD analysis, morphological/topological features of the fillers were evaluated by scanning electron microscopy (SEM; JSM-5400 instrument JEOL Inc., Peabody, MA, USA).
Formulation of the Resins
The experimental resins were formulated from commercially available dental monomers and the photo-oxidants and photo-reductants camphorquinone (CQ) and ethyl-4-N,N-dimethylamino benzoate (4EDMAB), respectively (Table 2). Using a magnetic stirrer, the monomers and photoactivators were mixed (in the absence of blue light) until a uniform consistency was achieved. The indicated acronyms are used throughout this manuscript. The compositions of the resins are provided in Table 3. The molar ratio Bis-GMA or EBPADMA : TEGDMA : HEMA : MEP = 11.6 : 8.6 : 8.5 : 1.0 was kept identical in both formulations.
Table 2.
Monomers and components of the photoinitiator system.
| Chemical Name | Acronym | Molecular mass |
|---|---|---|
| 2,2-bis[p-(2’-hydroxy-3’-methacryloxypropoxy)phenyl]propane | Bis-GMA | 512 |
| Tri(ethylene glycol) dimethacrylate | TEGDMA | 286 |
| Ethoxylated bisphenol A dimethacrylate | EBPADMA | 572 |
| 2-hydroxyethyl methacrylate | HEMA | 130 |
| Methacryloyloxyethyl phthalate | MEP | 278 |
| Camphorquinone | CQ | 166 |
| Ethyl-4-N,N-dimethylamino benzoate | 4EDMAB | 193 |
Table 3.
Composition (mass fraction, %) of experimental resins employed in the study.
| Resin acronym | Bis-GMA | EBPADMA | TEGDMA | HEMA | MEP | CQ | 4EDMAB |
|---|---|---|---|---|---|---|---|
| BTHM | 60.22 | - | 24.84 | 11.14 | 2.80 | 0.20 | 0.80 |
| ETHM | - | 62.80 | 23.20 | 10.40 | 2.60 | 0.20 | 0.80 |
Preparation of Copolymer and Composite Specimens
Composite pastes (assigned acronyms: BTHM40, BTHM35 and BTHM30; ETHM40, ETHM35 and ETHM30; the number indicates the decreasing content of the filler) were made in 2 g batches by hand-mixing the BTHM or ETHM resin (mass fraction 60 %, 65 % or 70 %) with Zr-ACP filler or glass OX50/ZrO2 filler (mass fraction 40 %, 35 % or 30 %) with a spatula and a dental slab (flat glass block). The paste was mixed until a uniform consistency was achieved, with no remaining visible particulates. The homogenized pastes were spread thinly on the dental slab and kept under a moderate vacuum (2.7 kPa) overnight to eliminate the air entrained during mixing. The pastes were molded into disks (14.9 mm to 15.3 mm in diameter and 1.31 mm to 1.53 mm in thickness) by filling the circular openings of flat Teflon molds, covering each side of the mold with a Mylar film plus a glass slide, and then clamping the assembly together with spring clips. The disks were photo-polymerized by irradiating sequentially each face of the mold assembly for 60 s with visible light (Triad 2000, Dentsply International, York, PA, USA). The copolymer disk specimens were prepared and irradiated in an identical manner.
Physicochemical Testing of Copolymers and Composites
Biaxial flexure strength (BFS) testing, previously employed for the comparative studies of the mechanical strength of various bioactive ACP composites [5–12], was used to determine the BFS of copolymers and composites. We utilized a piston-on-three-ball loading assembly with a computer-controlled Universal Testing Machine (Instron 5500R, Instron Corp., Canton, MA, US) operated by Testworks 4 software. The BFS values of dry (after 24 h storage in air at 23 °C) and wet (after 1 mo, 3 mo and 6 mo immersion in HEPES-buffered saline solution (0.13 mol/L NaCl; pH = 7.4) at 23 °C; 40 mL saline solution/specimen) copolymer and composite specimens (a minimum of 7 specimens per group) were calculated according to the following equation [13]:
| (1) |
where A = -[3/4π (X−Y)], X=(1+ν)ln(r1/rs)2 +[(1−ν)/2](r1/rs)2, Y = (1+ν)[1 + ln(rsc/rs)2], and where ν = Poisson’s ratio, rl = radius of the piston applying the load at the surface of contact, rsc = radius of the support circle, rs = radius of disk specimen, L = applied load at failure, and t = thickness of disk specimen. A constant value of 0.24 was used for Poisson’s ratio, in accordance with published data on the elastic properties of resin-based composites [14].
Water sorption (WS) of copolymer and composite specimens was determined as follows. A minimum of five replicate disks in each experimental group was initially dried over anhydrous CaSO4 until a constant mass was achieved (±0.1 mg). Specimens were then immersed in saline solution. Immersing conditions were the same as described for BFS testing. Gravimetric mass changes of dry-tissue padded specimens were recorded at predetermined time intervals. The degree of WS of any individual specimen at a given time interval (t), expressed as percent by mass, was calculated using the equation:
| (2) |
where Wt represents sample mass at the time t, and Wo is the initial mass of the dry sample.
WS data were used to calculate the diffusion coefficient (D) employing established diffusion theory [15] which has been used repeatedly to assess the water uptake of dental [16–21] and other types of polymeric materials [22, 23]. D is calculated by applying the simplified Fick’s model using the following equation (valid for the initial stages of sorption when Wt/Weq ≤0.6):
| (3) |
where Wt is the mass gain (sorption) at time t, Weq is the mass gain at equilibrium and L is the thickness of the specimen. D is calculated from the slope of the plot Wt/Weq against t1/2.
Mineral ion release from composite disk specimens was examined at 23 °C, in continuously stirred, saline solutions (initial volume of saline per composite specimen: 100 mL). 2 mL aliquots were taken at 1, 3 and 6 month immersion, respectively, and the kinetic changes in Ca and PO4 levels were determined by utilizing previously described, spectrophotometric analytical methods [24, 25]. Ion release kinetic experiments were run in triplicate.
Statistical Data Analysis
One standard deviation (SD) is identified in this paper for comparative purposes as the estimated standard uncertainty of the measurements. These values should not be compared with data obtained in other laboratories under different conditions. Experimental data were analyzed by ANOVA (α= 0.05). Significant differences between the groups were determined by all pair-wise multiple comparisons (two tail t-test; unequal variances).
RESULTS
Characterization of Fillers
Zr-hybridized ACP filler employed in this study showed the typical features of amorphous calcium phosphate solid with two diffuse broad bands seen in 2θ= (4 to 60)° region of its XRD spectrum and two wide phosphate absorbance bands at (1200 to 900) cm−1 and (630 to 550) cm−1 in its FTIR spectrum. Typical data have previously been published [5, 26], and are not shown here.
Volume and number size distribution histograms of Zr-ACP and the glass OX50/ZrO2 filler are shown in Figures 1a–d. The PSD data indicate that as-made Zr-ACP was more agglomerated (particles ranging from submicron sizes (not shown) up to 1 mm in diameter (Figure 1a)) compared to the control glass filler (volume distribution from 0.4 µm to 150.0µm; Fig. 1c). Large ACP agglomerates (≥150.0 µm) accounted for 21.5 % of the total number of particles; the remaining 78.5 % are ≤ 30 µm (Fig. 1b). On the other hand, only 2.5 % of the total number of glass particles are > 5 µm and 85 % are in the range (0.5 to 4.0) µm. The SEM microphotographs of the fillers shown in Figures 2 a, b also indicate the heterogeneity of particle sizes in both fillers and the presence of larger agglomerates in ACP (Figure 2a) compared to the control glass filler (Figure 2b).
Figure 1.
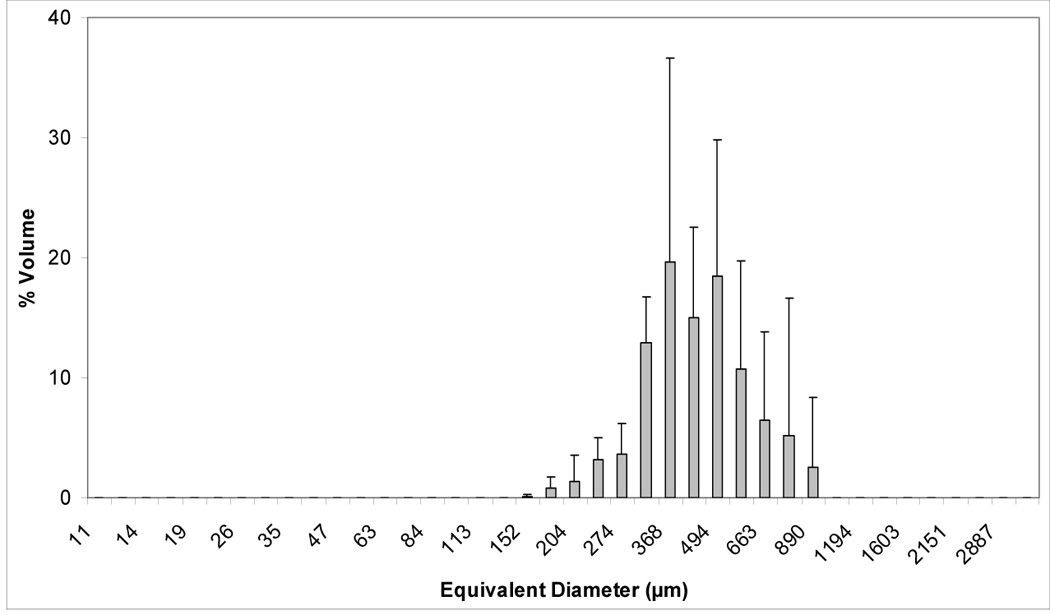
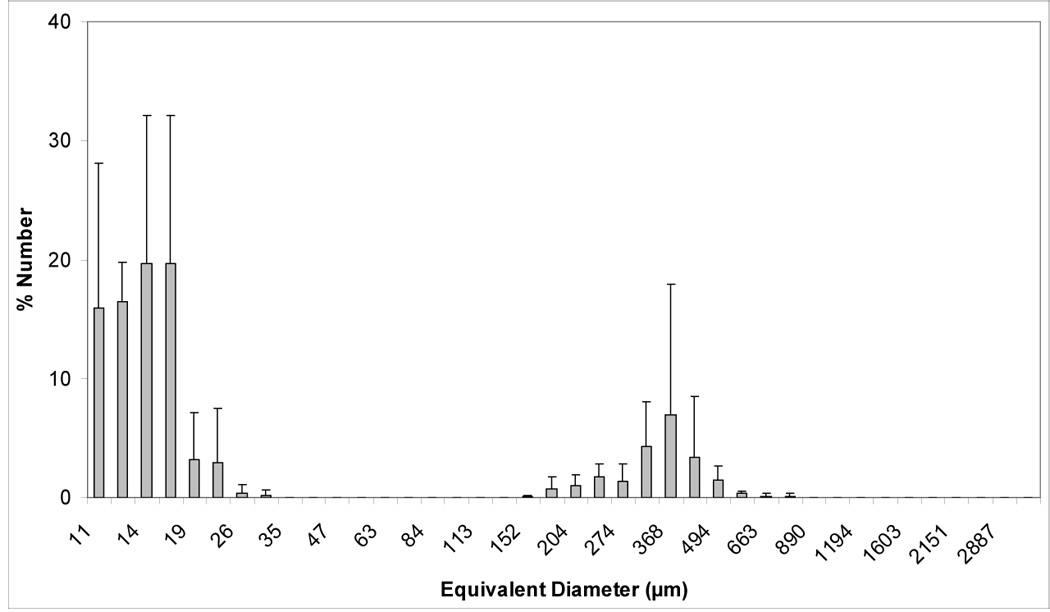
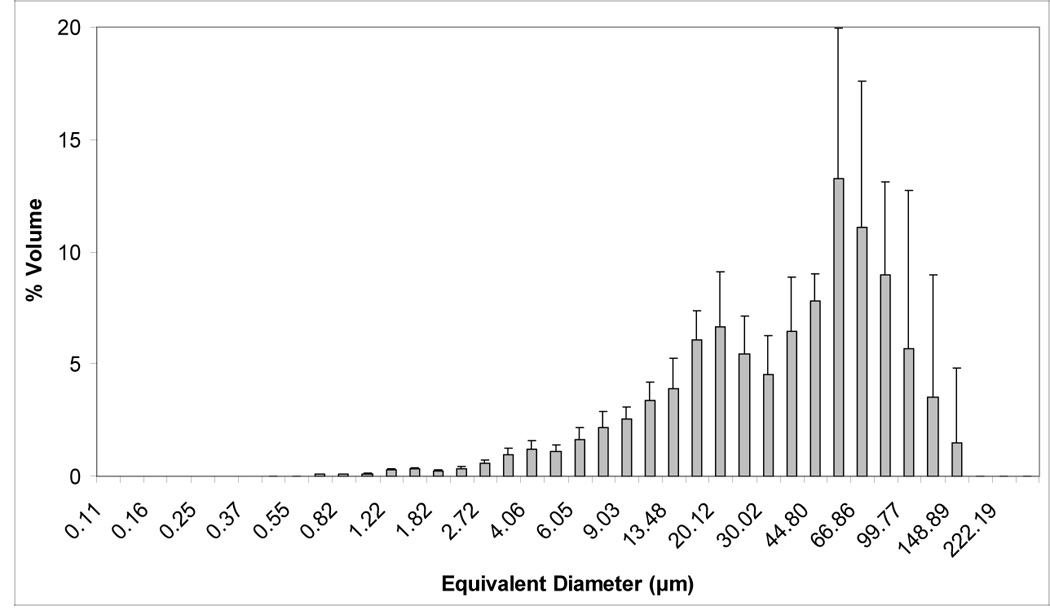
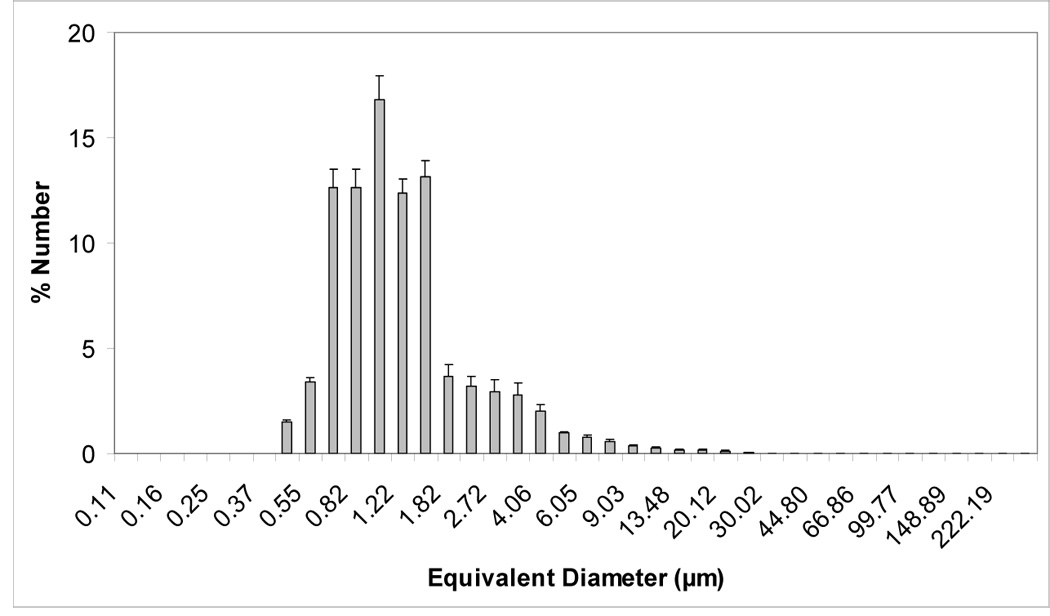
Volume and number size distributions (mean + standard deviation (SD)) of dry as-made ACP filler (a, b) and OX50/ZrO2 glass filler (c, d). Number of repetitive measurements n = 5 in each group.
Figure 2.
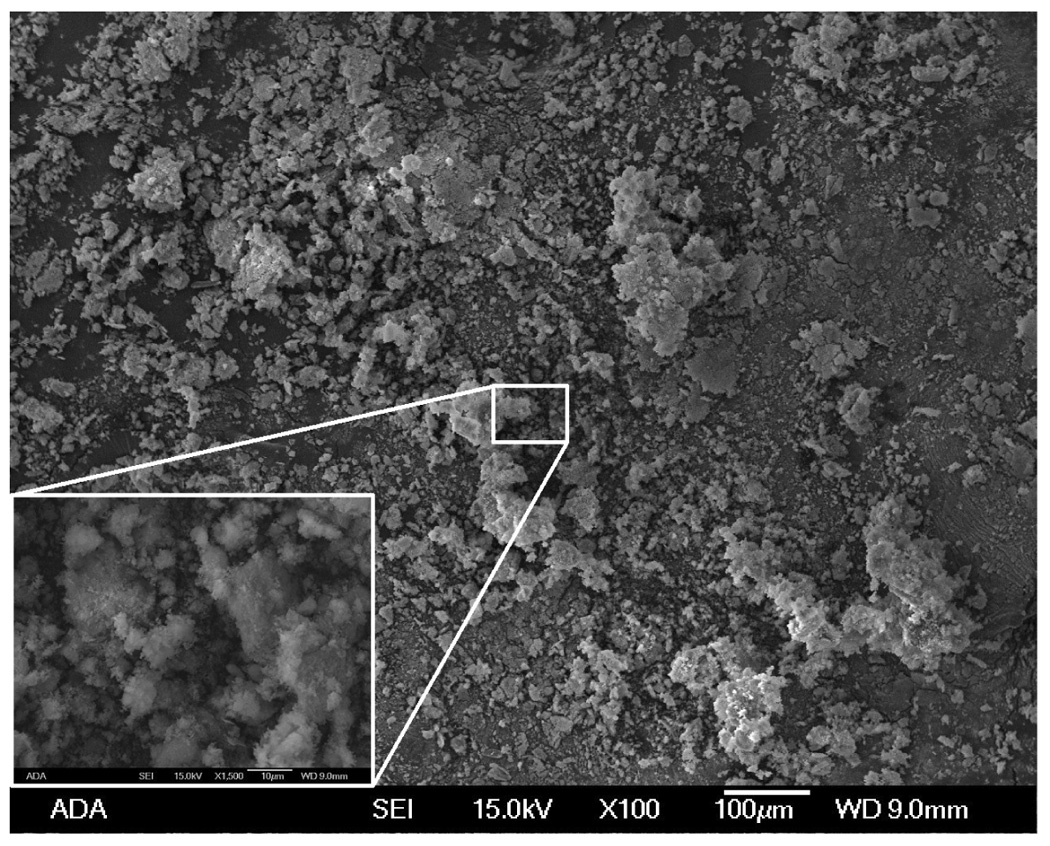
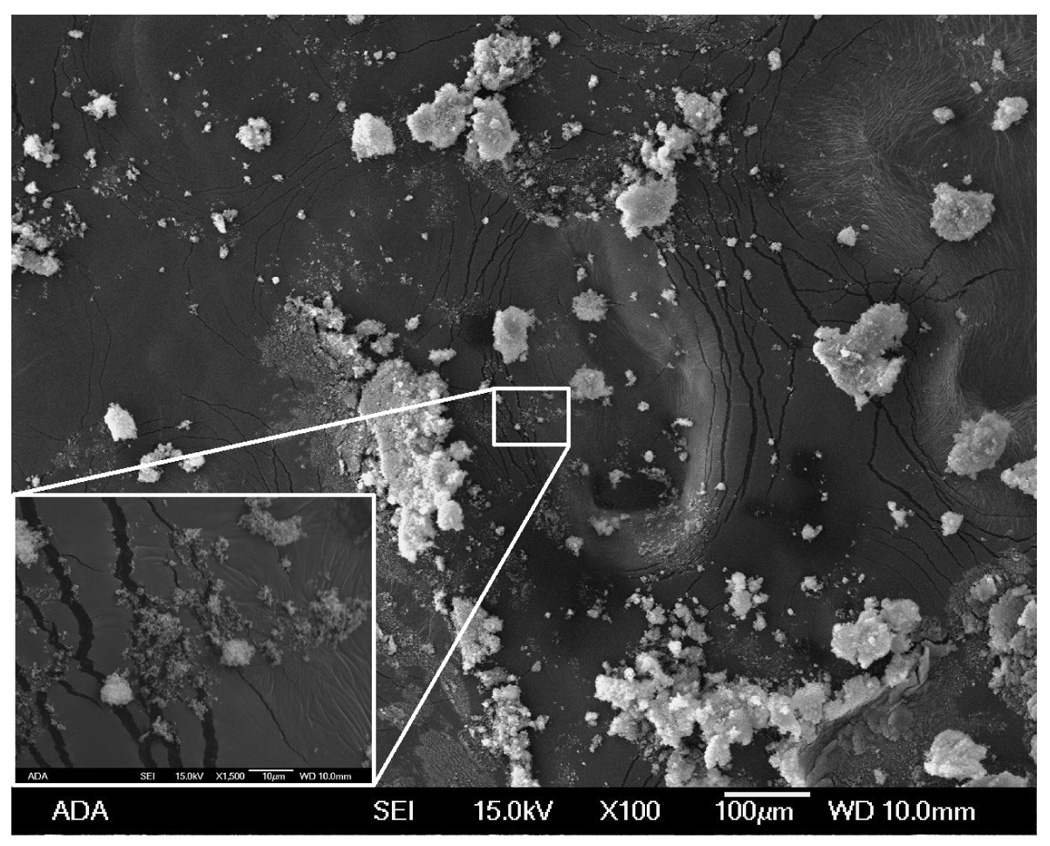
Scanning electron microscopic image of as-made ACP filler (a) and OX50/ZrO2 glass filler (b) at 100 X magnification. Magnification of the inset images: 1500 X.
Biaxial Flexure Strength (BFS)
The results of the BFS testing of dry (before immersion) and wet (after 1 mo, 3 mo and 6 mo immersion in saline) specimens are summarized in Figure 3. The BFS of dry BTHM copolymers [(163 ± 38) MPa] was 17 % higher than the BFS of dry ETHM copolymers [(136 ± 22) MPa]. The BFS of dry ACP composite specimens was independent of resin type or filler load. The average dry BFS value for the ACP BTHM and ETHM composites of (57 ± 11) MPa was between 66 % and 57 % lower than the BFS of the corresponding dry BTHM and ETHM copolymers, respectively. The BFS of copolymers was reduced after 1 mo immersion and did not significantly change afterwards: the average wet BFS values for copolymer specimens immersed for up to 6 mo in saline were (108 ± 18) MPa for BTHM matrix and (115 ± 17) MPa for ETHM matrix, accounting for 34 % and 15 % reduction, respectively, compared to dry specimens. The mechanical strength of ACP composites deteriorated with immersion; wet BFS values observed after 1 mo remained practically unchanged at 6 mo when the overall reduction in the BFS due to immersion was 48 % and 41 % for BTHM and ETHM matrices , respectively (calculated as {[(BFSdry − BFS6mo)/BFSdry]×100}). The BFS values of dry glass-filled specimens were reduced compared to dry copolymer specimens. In both BTHM and ETHM resins, the extent of this BFS reduction caused by the introduction of glass OX50/ZrO2 glass filler appears to be proportional to the filler load. Immersion in saline caused an additional drop in the BFS of glass OX50/ZrO2 composites. This reduction appears to be proportional to both the time of immersion and the filler load.
Figure 3.
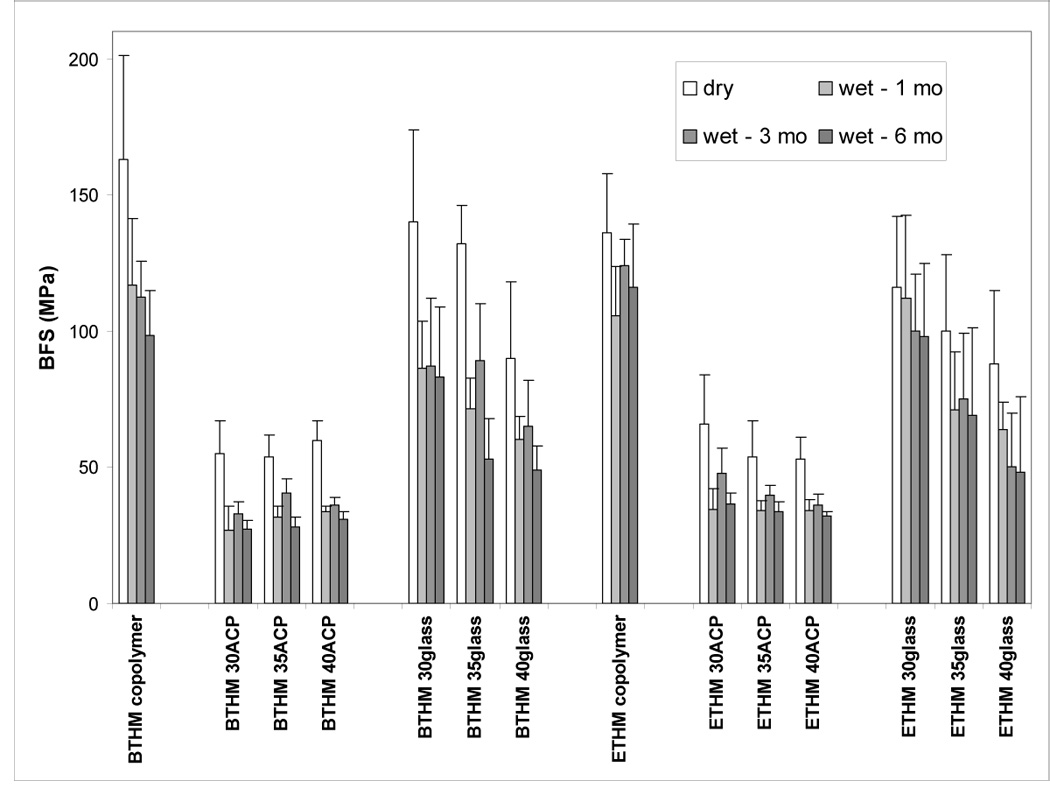
Biaxial flexural strength (BFS) of BTHM and ETHM copolymers and their ACP and OX50/ZrO2 composites in dry state and after 1 mo, 3 mo and 6 mo immersion in buffered saline solutions at 23 °C. Shown are the mean values ± standard deviation (SD) for a minimum of seven specimens in each experimental group. SDs (in MPa) were: ≤ 38 for BTHM copolymer, ≤ 12 for BTHM ACP composites, ≤ 34 for BTHM OX50/ZrO2 glass composites, ≤ 23 for ETHM copolymer, ≤ 18 for ETHM ACP composites and ≤ 30 for ETHM OX50/ZrO2 glass composites.
Water Sorption (WS)
The WS kinetic data are presented in Figure 4 and summarized in Table 4. BTHM copolymer absorbed a maximum mass fraction (Wmax) of 4.4 % water compared to 2.0 % in ETHM copolymers. Their ACP composites absorbed approximately three times more water in BTHM matrices (mass fraction (13.2 to 14.4) %) and between four and five times more in (ETHM matrices (mass fraction (8.6 to 9.8) %) compared to the corresponding unfilled copolymers. Glass-filled composites, however, absorbed only a fraction of water compared to the unfilled copolymer specimens (mass fraction (2.9 to 3.0) % and mass fraction (1.2 to 1.4) % for BTHM and ETHM resins, respectively).
Figure 4.
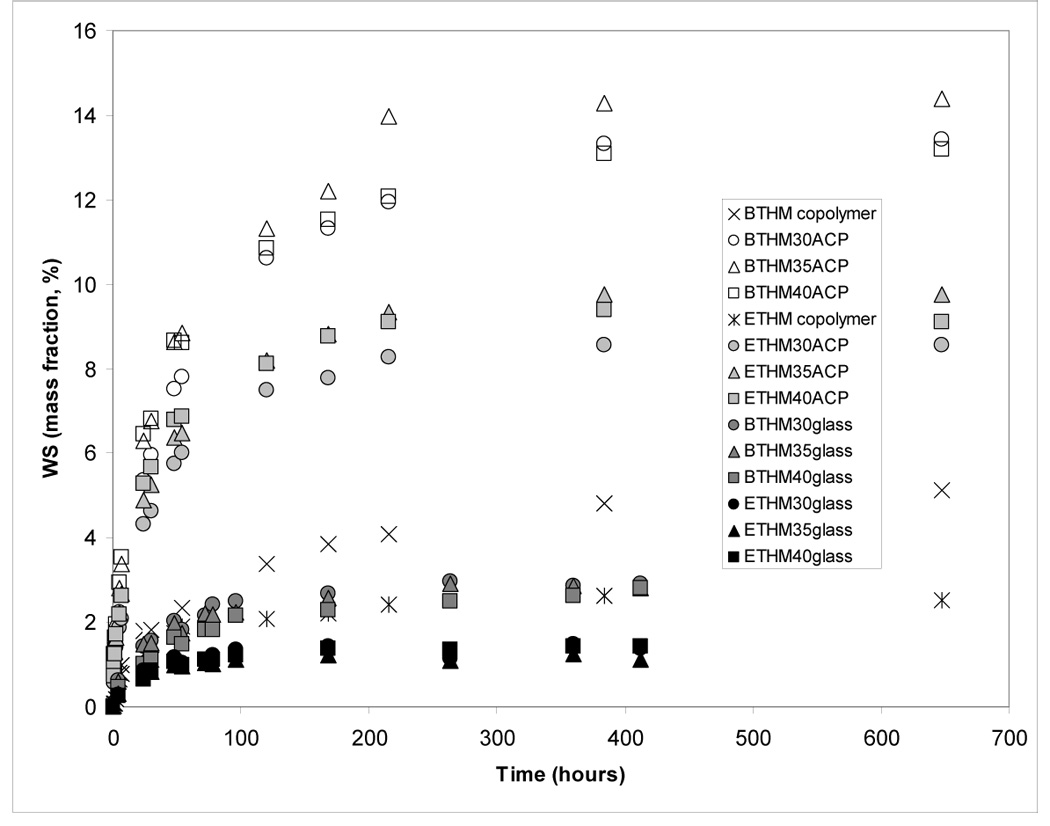
Water sorption (WS) of BTHM and ETHM copolymers and their ACP and OX50/ZrO2 glass composites. Indicated values represent mean values for five specimens in each group. SDs (in mass fraction %) were: ≤ 0.45 for BTHM copolymer, ≤ 0.77 for BTHM ACP composites, ≤ 0.62 for BTHM OX50/ZrO2 glass composites, ≤ 0.57 for ETHM copolymer, ≤ 0.48 for ETHM ACP composites and ≤ 0.44 for ETHM OX50/ZrO2 glass composites.
Table 4.
Maximum WS (mean ± standard deviation; number of specimens per group n = 5) values (Wmax; plateau values reached at ≥ 400 h of immersion in saline solutions) and the corresponding diffusion coefficient, D, calculated from the early time WS data according to equation 3.
| Material Group | Wmax (mass fraction %) | D (cm2 s−1) |
|---|---|---|
| BTHM copolymer | 4.4 ± 0.1 | 9.6 × 10⁻⁸ |
| BTHM30 ACP composite | 13.4 ± 0.7 | 7.7 × 10⁻⁸ |
| BTHM35 ACP composite | 14.4 ± 0.6 | 7.1 × 10⁻⁸ |
| BTHM40 ACP composite | 13.2 ± 0.8 | 8.0 × 10⁻⁸ |
| BTHM30 glass OX50/ZrO2 composite | 2.9 ± 0.3 | 2.8 × 10⁻⁸ |
| BTHM35 glass OX50/ZrO2 composite | 2.9 ± 0.3 | 3.5 × 10⁻⁸ |
| BTHM40 glass OX50/ZrO2 composite | 3.0 ± 0.2 | 4.4 × 10⁻⁸ |
| ETHM copolymer | 2.0 ± 0.3 | 9.4 × 10⁻⁸ |
| ETHM30 ACP composite | 8.6 ± 0.4 | 7.0 × 10⁻⁸ |
| ETHM35 ACP composite | 9.8 ± 0.6 | 6.8 × 10⁻⁸ |
| ETHM40 ACP composite | 9.1 ± 0.5 | 7.4 × 10⁻⁸ |
| ETHM30 glass OX50/ZrO2 composite | 1.4 ± 0.4 | 3.8 × 10⁻⁸ |
| ETHM35 glass OX50/ZrO2 composite | 1.2 ± 0.4 | 5.2 × 10⁻⁸ |
| ETHM40 glass OX50/ZrO2 composite | 1.4 ± 0.2 | 3.3 × 10⁻⁸ |
Calculated diffusion coefficients, D, for both types of unfilled copolymers were identical [(9.6 × 10⁻⁸) vs. (9.4 × 10⁻⁸) cm2 s−1]. Independent of the filler load level, only minimal reductions in D values were seen in the ACP composite series: (17 to 26) % and (21 to 27) % for BTHM and ETHM matrices, respectively, compared to the copolymers. Also independent of the filler load level, more pronounced reductions in D values were observed in the glass-filled composites: (54 to 71) % and (44 to 65) % for BTHM and ETHM matrices, respectively, compared to the unfilled copolymer specimens.
Ion release
Concentrations of Ca and PO4 released from BTHM and ETHM ACP composites with varying filler levels after 1 mo, 3 mo and 6 mo immersion in buffered saline solution are shown in Figures 5a, b. Ion release generally increased with increases in both filler load level and time of immersion. In all but the BTHM30 composite at 1 mo and 3 mo immersion and the ETHM30 composite at 1 mo immersion, the attained solution supersaturation with respect to hydroxyapatite was above the minimum needed for mineral re-deposition to occur (Table 5; thermodynamic calculations of the ion activity product, IAP, and the Gibbs free-energy, ΔG°, are described in detail in ref. [26]).
Figure 5.
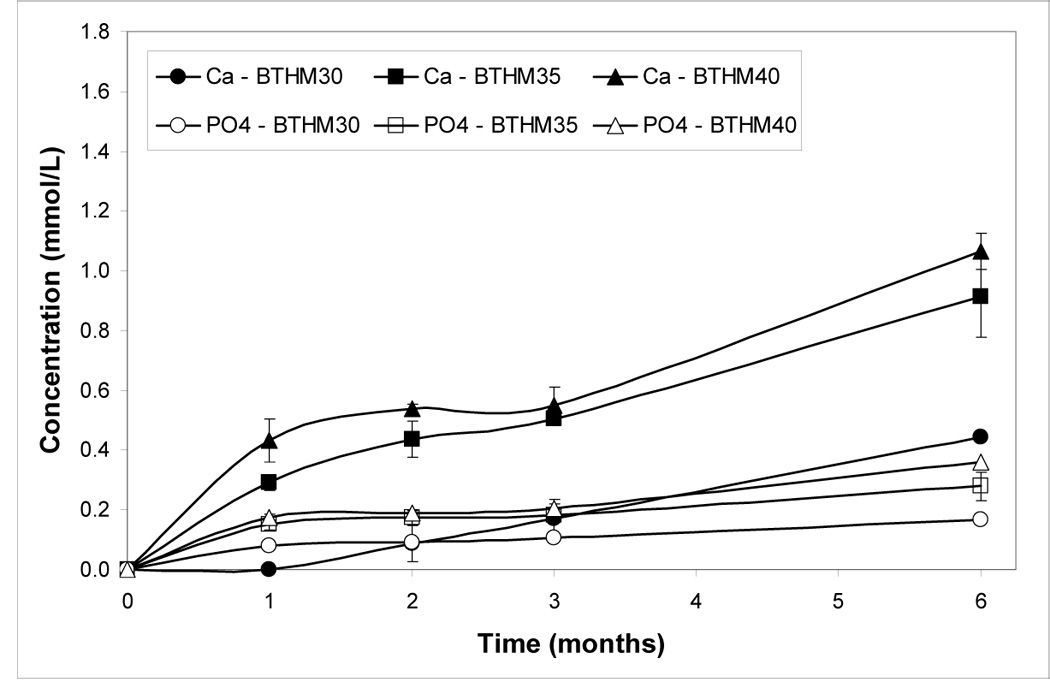
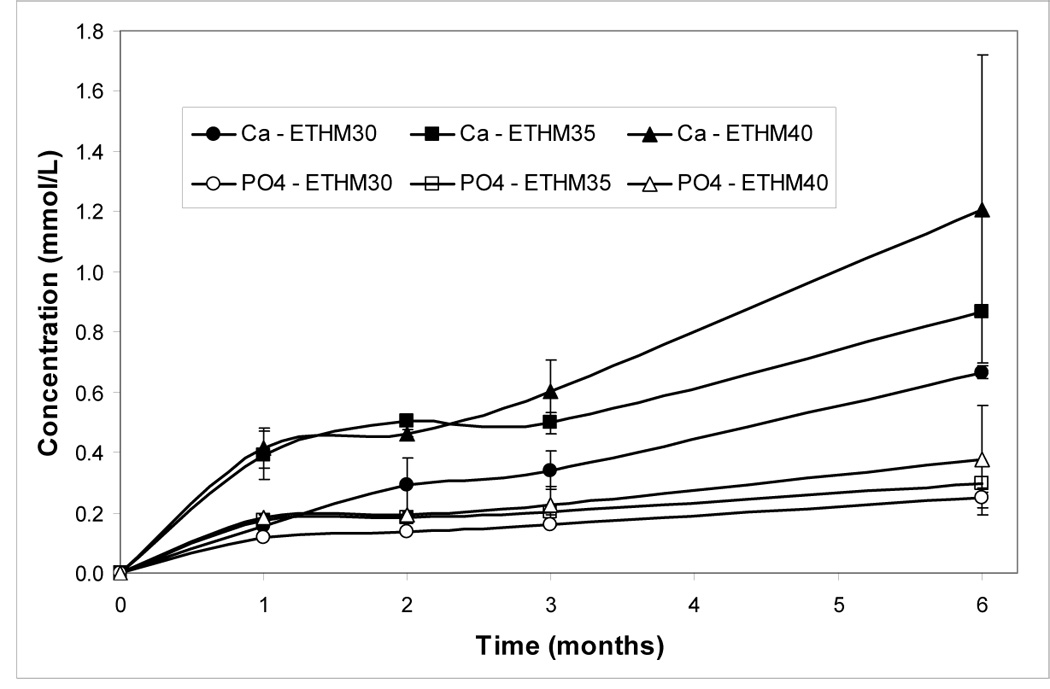
Calcium and phosphate release (mean value ± SD) from BTHM ACP (a) and ETHM ACP (b) composites at different time intervals. Indicated values are obtained from three repetitive measurements in each group.
Table 5.
Ion activity product (IAP; mean ± SD) and the thermodynamic stability* (ΔG° ; mean ± SD) of the solutions containing Ca and PO4 ions released from BTHM and ETHM ACP composites at different time intervals. Number of repetitive experiments in each group n=3.
| Composite | Immersion Time (mo) | IAP | ΔG° (kJ/mol) |
|---|---|---|---|
| 1 | 121. ±5 0.1 | 1.33 ±0.04 | |
| BTHM30 | 3 | 117.1 ± 0.3 | 0.00 ± 0.03 |
| 6 | 112.3 ± 0.1 | − (1.58 ± 0.03) | |
| 1 | 114.0 ± 0.1 | − (1.05 ± 0.04) | |
| BTHM35 | 3 | 111.5 ± 0.2 | − (1.83 ± 0.07) |
| 6 | 107.9 ± 0.4 | − (2.97 ± 0.12) | |
| 1 | 112.1 ± 0.3 | − (1.64 ± 0.09) | |
| BTHM40 | 3 | 110.7 ± 0.3 | − (2.09 ±0.10) |
| 6 | 106.3 ± 0.4 | − (3.48 ± 0.07) | |
| 1 | 117.4 ± 0.1 | 0.03 ± 0.06 | |
| ETHM30 | 3 | 113.3 ± 0.3 | − (1.27 ± 0.10) |
| 6 | 109.3 ± 0.3 | − (2.53 ± 0.10) | |
| 1 | 112.5 ± 0.4 | − (1.52 ± 0.13) | |
| ETHM35 | 3 | 111.1 ± 0.2 | − (1.96 ± 0.06) |
| 6 | 107.8 ± 0.3 | − (3.00 ± 0.09) | |
| 1 | 112.1 ± 0.4 | − (1.64 ± 0.12) | |
| ETHM40 | 3 | 110.1 ± 0.5 | − (2.28 ± 0.16) |
| 6 | 105.8 ± 0.8 | − (3.64 ± 0.26) | |
Negative ΔG° value indicates solution supersaturated with respect to stoichiometric hydroxyapatite, Ca10(OH)2(PO4)6. The thermodynamic solubility product of Ca10(OH)2(PO4)6 used in calculations was Ksp = 117.1.
DISCUSSION
The mechanical strength, as measured by BFS testing of both dry and wet ACP/BTHM and ACP/ETHM composites, as well as the BFS of the corresponding glass control specimens (although to a lesser extent), were lower than the BFS of corresponding copolymers under both dry and wet conditions. The factors that may have caused this reduction in strength of ACP composites are multiple: 1) random, uneven dispersion of large ACP agglomerates throughout the composite; 2) increased water sorption in the presence of ACP; 3) the intra-composite ACP to apatite conversion taking place during aqueous immersion; and 4) defects at the filler/matrix interface originating from spatial changes that may have occurred during mineral ion release. It appears that the inability of coarse, highly agglomerated ACP filler to closely interact with both BTHM and ETHM matrices has a major role in governing the overall mechanical behavior of these composites. On the other hand, the BFS of control composites made with the smaller, less agglomerated unsilanized OX50/ZrO2 glass also had lower BFS values than the corresponding copolymers that further deteriorated with prolonged aqueous exposure. In part, this behavior is likely a result of the heterogeneous PSD and dispersion of OX50/ZrO2 glass in polymeric matrices. Nevertheless, the effect of water sorption in the control groups of composite specimens was negligible and could only be related to the water-matrix interaction. A higher number of non-bonding spaces (voids at the filler/matrix interface) in ACP composites probably accounts for their inferior mechanical behavior, especially after immersion.
Water sorption by hydrophilic ACP filled composites was controlled by both the resin matrix and the ACP filler with no clear trend being observed with the increase in ACP load level. At time intervals ≥ 400 h, when WSmax (plateau) levels were attained in all systems (Table 4), the composite formulated with more hydrophilic BTHM resin absorbed on average (regardless of the ACP content) up to (13.7 ± 0.8) % water compared to the (9.2 ± 0.6) % absorbed by ACP composites formulated with the less hydrophilic ETHM resin (Bis-GMA which is more hydrophilic than EBPADMA). By taking into account resin:filler mass ratio and by assuming that the inclusion of ACP did not impede water uptake by the resin matrix, the calculated WS fraction (mass fraction, %) absorbed by the ACP filler was 10.8 % in ACP/BTHM composites and 7.9 % in ACP/ETHM composites. These high numbers are not surprising, considering the fact that the average water content of dry Zr-ACP fillers utilized in composite preparations (as determined by thermogravimetric analysis; [4–6, 26]) is 15.8 % by mass and approximately (65 to 70) % of the total water is loosely, surface-bound. If all of that labile water was removed during the desorption cycle, the maximum absorbable water level should theoretically be between 10.3 % and 11.1 %. One can, therefore, conclude that in ACP/BTHM composites the theoretically absorbable water levels were actually reached, while in ACP/ETHM formulations filler water uptake was approximately 75 % of the theoretical value. The latter may be a result of the slightly more cohesive ACP/ETHM interface compared to that of ACP/BTHM. Additionally, assuming that no water was absorbed by the glass filler, WS corresponding to a 100 % copolymer was calculated from the glass composite weight changes. These calculated Wmax values for the pure copolymers are in excellent agreement with the measured ones: (mass fraction (4.5 ± 0.4) % vs. (4.4 ± 0.1) % for BTHM system and mass fraction (2.2 ± 0.3) % vs. (2.0 ± 0.3) % for ETHM system). Based on the above discussion, it can be concluded that the increased WS observed in ACP-containing composites is due primarily to the high water affinity of ACP filler and that cohesive forces at the filler/matrix interface have negligible (BTHM formulations) or only a marginal (ETHM formulations) influence on the water diffusion process. The analysis of the calculated diffusion coefficient values, D (Table 4) indicate a modest reduction in the water diffusion rate in ACP composites (on average 20 % for BTHM and 25 % for ETHM formulations) compared to the unfilled copolymer specimens. However, in the glass-filled composites, D values were reduced far more suggesting a more intimate contact between the relatively hydrophobic OX50/ZrO2 glass filler particles and the resin was achieved, and, as a consequence, water diffusion had less pathways and became circuitous.
In ACP composites, ion release can be controlled by the: 1) nature of the polymer network structure, 2) filler level, 3) water diffusion rate and 4) internal rate of conversion to thermodynamically stable apatite. Data from the examined composites (Figures 5a, b; Table 5) suggest that under given experimental conditions (buffered saline solution with pH = 7.40) ion release kinetics were practically identical in both BTHM and ETHM resin matrices. No accelerated ion release was seen in the more hydrophilic BTHM formulations that, as expected, had higher WS values. The only parameter that influenced the ion release and, in turn, the supersaturation of the immersing solutions was the initial filler load level. It appears that a minimum mass fraction of 35 % is necessary to obtain the desirable ion release profiles and create conditions favorable for the reprecipitation of hydroxypatite. The Ca2+ and PO43− levels released from ETHM composites appear somewhat higher than those obtained from the corresponding BTHM composites; the differences, however, were not statistically significant. This minimally higher ion release in ETHM/ACP composites could be attributed to the lower cross-linking density and greater flexibility of the EBPADMA-based matrices compared to composites with more rigid Bis-GMA-based matrices. It is more likely that the overall ion release was controlled by the identical level (on molar basis) of the surface active, highly hydrophilic HEMA (and to a lesser extent MEP) being incorporated into both resin systems. It is believed that HEMA increases internal mineral saturation levels by allowing water needed for ion diffusion to be more easily absorbed by the composite. Interestingly, high Ca/PO4 ratios were observed with both BTHM and ETHM composites. We have previously seen such ion profiles being restricted to the binary and ternary EBPADMA-based matrices as opposed to the Bis-GMA-based and urethane dimethacrylate-based binary formulations [27, 28]. Whether or not this phenomenon could be explained by the differences in the molar ratio of the base monomer:HEMA (0.32 [28] vs. 1.27 [this study]) remains an open question.
CONCLUSIONS
Substituting ethoxylated bisphenol A dimethacrylate (EBPADMA) for 2,2-bis[p-(2’-hydroxy-3’-methacryloxypropoxy)phenyl]propane (Bis-GMA) in photo-activated resins that also contain tri(ethylene glycol) dimethacrylate, 2-hydroxyethyl methacrylate (HEMA) and methacryloyloxyethyl phthalate ((MEP); BTHM and ETHM formulations) significantly affected water sorption (WS) but had generally very little effect on the mechanical strength of both dry and wet unfilled resins (copolymers). Independent of the ACP filler level, and compared to copolymer specimens in both dry and wet state, the corresponding ACP composites were mechanically inferior due to 1) the presence of large ACP agglomerates that, because of their uneven distribution throughout the matrix, created voids at the filler/matrix interface and 2) enhanced WS by ACP filler. Unsilanized glass-filled composites absorbed no additional water compared to BTHM and ETHM copolymers. Their mechanical strength decreased with increasing filler level and with time of aqueous exposure. A minimum mass fraction of 35 % ACP needed to be incorporated into BTHM and/or ETHM formulations to obtain the desirable ion release profiles and create conditions favorable for the re-precipitation of hydroxyapatite.
ACKNOWLEDGEMENT
Reported work was supported by the National Institute of Dental and Craniofacial Research Grant R01-13169 to the American Dental Association Foundation (ADAF). It is a part of the dental material research program conducted by NIST in cooperation with ADAF and was also supported by both NIST and ADAF. Generous contribution of the monomers from Esstech, Essington, PA, USA is gratefully acknowledged.
Footnotes
DISCLAIMER Certain commercial materials and equipment are identified in this article to specify the experimental procedure. In no instance does such identification imply recommendation or endorsement by the National Institute of Standards and Technology or the American Dental Association Foundation or that the material or equipment identified is necessarily the best available for the purpose.
REFERENCES
- 1.Morgan DR, Kalachandra S, Shobha S, Gunduz N, Stjskal EO. Analysis of a Dimethacrylate Copolymer (Bis-GMA and TEGDMA) Network by DCS and 13C Solution and Solid State NMR Spectroscopy. Biomaterials. 2000;21:1897–1903. doi: 10.1016/s0142-9612(00)00067-3. [DOI] [PubMed] [Google Scholar]
- 2.Antonucci JM, Stansbury JW. Desk Reference of Functional Syntheses and Applications. Washington DC: American Chemical Society; 1997. Molecularly Designed Dental Polymers; pp. 719–738. [Google Scholar]
- 3.Antonucci JM, Liu DW, Stansbury JW. Synthesis of Hydrophobic Oligomeric Polymers for Dental Applications. J. Dent. Res. 1993;72:369. [Google Scholar]
- 4.Skrtic D, Antonucci JM, Liu DW. Ethoxylated Bisphenol A Methacrylate-based Amorphous Calcium Phosphate Composites. Acta Biomaterialia. 2006;2(1):85–94. doi: 10.1016/j.actbio.2005.10.004. [DOI] [PMC free article] [PubMed] [Google Scholar]
- 5.Skrtic D, Antonucci JM, Eanes ED. Amorphous Calcium Phosphate-based Bioactive Polymeric Composites for Mineralized Tissue Regeneration. J. Res. Natl. Inst. Stands. Technol. 2003;108(3):167–182. doi: 10.6028/jres.108.017. [DOI] [PMC free article] [PubMed] [Google Scholar]
- 6.Skrtic D, Antonucci JM, Eanes ED, Eichmiller FC, Schumacher GE. Physicochemical Evaluation of Bioactive Polymeric Composites Based on Hybrid Amorphous Calcium Phosphates. J. Biomed. Mater. Res. (Appl. Biomater.) 2000;53:381–391. doi: 10.1002/1097-4636(2000)53:4<381::aid-jbm12>3.0.co;2-h. [DOI] [PubMed] [Google Scholar]
- 7.Lee SY, Regnault WF, Antonucci JM, Skrtic D. Effect of Particle Size of an Amorphous Calcium Phosphate Filler on the Mechanical Strength and Ion Release of Polymeric Composites. J. Biomed. Mater. Res. 2007;80B:11–17. doi: 10.1002/jbm.b.30561. [DOI] [PMC free article] [PubMed] [Google Scholar]
- 8.O’onnell JNR, Antonucci JM, Skrtic D. Amorphous Calcium Phosphate Composites with Improved Mechanical Properties. J. Bioact. Comp. Polym. 2006;21(3):169–184. doi: 10.1177/0883911506064476. [DOI] [PMC free article] [PubMed] [Google Scholar]
- 9.Skrtic D, Antonucci JM. Effect of Bifunctional Co-monomers on Mechanical Strength and Water Sorption of Amorphous Calcium Phosphate- and Silanized Glass-filled Bis-GMA-based Composites. Biomaterials. 2003;24:2881–2888. doi: 10.1016/s0142-9612(03)00119-4. [DOI] [PubMed] [Google Scholar]
- 10.Antonucci JM, McDonough WG, Liu DW, Skrtic D. Effect of Polymer Matrices on Methacrylate Conversion and Mechanical Strength of Bioactive Composites Based on Amorphous Calcium Phosphate. Polymer Preprints. 2002;43(2):741–742. [Google Scholar]
- 11.Antonucci JM, McDonough WG, Liu DW, Skrtic D. Effect of Acidic Comonomers on Methacrylate Conversion and Mechanical Strength of Bioactive Composites Based on Amorphous Calcium Phosphate. Polymeric Materials: Science & Engineering. 2003;88:50–51. [Google Scholar]
- 12.Skrtic D, Antonucci JM, Eanes ED, Eidelman N. Dental Composites Based on Hybrid and Surface-modified Amorphous Calcium Phosphates –A FTIR Microspectroscopic Study. Biomaterials. 2004;25:1141–1150. doi: 10.1016/j.biomaterials.2003.08.001. [DOI] [PubMed] [Google Scholar]
- 13.ASTM F394-78. Standard Test Method for Biaxial Strength (Modulus of Rupture) of Ceramic Substrates. reapproved 1996 [Google Scholar]
- 14.Nakayama WT, Hall DR, Grenoble DE, Katz JL. Elastic Properties of Dental Resin Restorative Materials. J. Dent. Res. 1974;53(5):1121–1126. doi: 10.1177/00220345740530050901. [DOI] [PubMed] [Google Scholar]
- 15.Vieth WR. Diffusion in and Through Polymers: Principles and Applications. Hanser: Munich; 1991. [Google Scholar]
- 16.Soderholm KJ. Water Sorption in Bis(GMA)/TEGDMA Resin. J. Biomed. Mater. Res. 1984;18:271–279. doi: 10.1002/jbm.820180304. [DOI] [PubMed] [Google Scholar]
- 17.Kanchanavasita W, Anstice HM, Pearson GJ. Water Sorption Characteristics of Resin-modified Glass Ionomer Cements. Biomaterials. 1997;18:343–349. doi: 10.1016/s0142-9612(96)00124-x. [DOI] [PubMed] [Google Scholar]
- 18.Santos C, Clarke RL, Braden M, Guitian F, Davy KWM. Water Absorption Characteristics of Dental Composites Incorporating Hydroxyapatite Filler. Biomaterials. 2002;23:1897–1904. doi: 10.1016/s0142-9612(01)00331-3. [DOI] [PubMed] [Google Scholar]
- 19.Asaoka K, Hirano S. Diffusion Coefficient of Water Through Dental Composite Resin. Biomaterials. 2003;24:975–979. doi: 10.1016/s0142-9612(02)00435-0. [DOI] [PubMed] [Google Scholar]
- 20.Sideriou I, Achilias D, Spyroudi C, Karabela M. Water Sorption Characteristics of Light-cured Dental Resins Based on Bis-EMA/PCDMA. Biomaterials. 2004;25:367–376. doi: 10.1016/s0142-9612(03)00529-5. [DOI] [PubMed] [Google Scholar]
- 21.Palin WM, Fleming GJP, Burke FJT, Marquis PM, Randall RC. The Influence of Short and Medium-term Water Immersion on the Hydrolytic Stability of Novel Low-shrink Dental Composites. Dent. Mater. 2005;21:852–863. doi: 10.1016/j.dental.2005.01.004. [DOI] [PubMed] [Google Scholar]
- 22.Bosh P, Fernandez A, Salvador EF, Corrales T, Catalina F, Peinado C. Polyurethane-acrylate Based Films as Humidity Sensors. Polymer. 2005;46:12200–12209. [Google Scholar]
- 23.Jacob M, Varughese KT, Thomas S. Water Sorption of Hybrid Biofiber-reinforced Natural Rubber Biocomposites. Biomacromolecules. 2005;6:2969–2979. doi: 10.1021/bm050278p. [DOI] [PubMed] [Google Scholar]
- 24.Vogel GL, Chow LC, Brown WE. A Microanalytical Procedure for the Determination of Calcium, Phosphate and Fluoride in Enamel Biopsy Samples. Caries Res. 1983;7:23–31. doi: 10.1159/000260645. [DOI] [PubMed] [Google Scholar]
- 25.Murphy J, Riley JP. Single Solution Method for the Determination of Phosphate in Natural Waters. Anal. Chim. Acta. 1962;27:31–36. [Google Scholar]
- 26.Antonucci JM, Skrtic D. Physicochemical Properties of Bioactive Polymeric Composites: Effects of Resin Matrix and the Type of Amorphous Calcium Phosphate Filler. In: Shalaby WS, Salz U, editors. Polymers for Dental and Orthopedic Applications. Boca Raton: CRC Press; 2007. pp. 217–242. [Google Scholar]
- 27.Antonucci JM, Skrtic D. Matrix Resin Effects on Selected Physicochemical Properties of Amorphous Calcium Phosphate Composites. J. Bioact. Comp. Polym. 2005;20:29–49. [Google Scholar]
- 28.Skrtic D, Antonucci JM. Dental Composites Based on Amorphous Calcium Phosphate – Resin Composition/Physicochemical Properties Study. J. Biomat. Appl. 2007;21:375–393. doi: 10.1177/0885328206064823. [DOI] [PMC free article] [PubMed] [Google Scholar]