Abstract
We developed a fast method to obtain T1 relaxation maps in magnetic resonance imaging (MRI) based on two inversion recovery acquisitions and a reference acquisition, while maintaining high sensitivity by utilizing the full dynamic range of the MRI signal. Optimal inversion times for estimating T1 in the human brain were predicted using standard error propagation theory. In vivo measurements on nine healthy volunteers yielded T1 values of 1094±18 ms in gray matter and 746±40 ms in white matter, in reasonable agreement with literature values using conventional approaches. The proposed method should be useful for clinical studies because the T1 maps can be obtained within a few seconds.
Keywords: MRI, spin lattice relaxation time, inversion recovery, error propagation
I. INTRODUCTION
Spin-lattice relaxation times (T1) measured with magnetic resonance imaging (MRI) can provide important information about normal and pathological conditions. Furthermore, various MRI applications, such as arterial spin labeling perfusion imaging,1,2 magnetization transfer imaging,3 and temperature monitoring4 require estimates of T1 for quantification. A large number of different methods have been proposed to measure T1 relaxation (for an extensive review see Refs. 5 and 6). Conventionally, an inversion recovery (IR) experiment is repeated with multiple inversion times to estimate T1.7 This approach requires relatively long scan times and may compromise accuracy because of involuntary subject motion during data acquisition. In addition, the precise timing of the negative-to-positive zero crossing of the IR signal is usually not easily identified in conventional MRI, because in general only magnitude images are stored. Finally, multi-time point methods are generally very sensitive to image noise, especially at inversion times (TI) where the signal is close to zero (TI > T1 *ln 2).8
To reduce these problems, several two-point methods were introduced to measure T1 using either a combination of saturation-recovery (SR) and IR spin preparations,8,9 or two different repetition times, or two different pulse flip angles without SR and IR preparations.10,11 However, these methods have certain limitations. If a combination of SR and IR spin preparation is used, dynamic range is sacrificed, because SR experiments yield only 50% of the signal range of IR experiments. Moreover, differences in rf power between SR and IR pulses can introduce systematic errors for T1 measurements. If different repetition times or flip angles are used, dynamic range is also reduced and/or systematic errors in T1 can be introduced by deviations of actual flip angles from their nominal settings. Dependency on flip angles is also a problem for inversion recovery methods using a Look–Locker acquisition,12 which furthermore diminishes signal-to-noise ratio because fast repetitions of excitation pulse are employed.
The primary objective of this study was to develop a method for T1 mapping based on two IR images and a reference image, thus allowing the maximum measurement dynamic range to be used within a very short scan time. Another objective was to eliminate complications with zero crossing of the signal for T1 measurements. Using single-shot echo planar imaging (EPI) (Ref. 13) to further reduce scan time, multislice T1 maps of human brain were obtained within a few seconds.
II. THEORY
The magnetic resonance signal, Se, of a single-shot gradient-echo (GE) EPI sequence at echo time TE with repetition time, TR (TR ≫ T1 of brain tissue) can be expressed as , where S0 is the initial equilibrium magnetization and is the transverse relaxation time due to both random magnetic field fluctuations and static magnetic susceptibility. If an inversion pulse is applied prior to the GE-EPI acquisition, the signal is then subject to T1 relaxation for an inversion time TI, according to
| (1) |
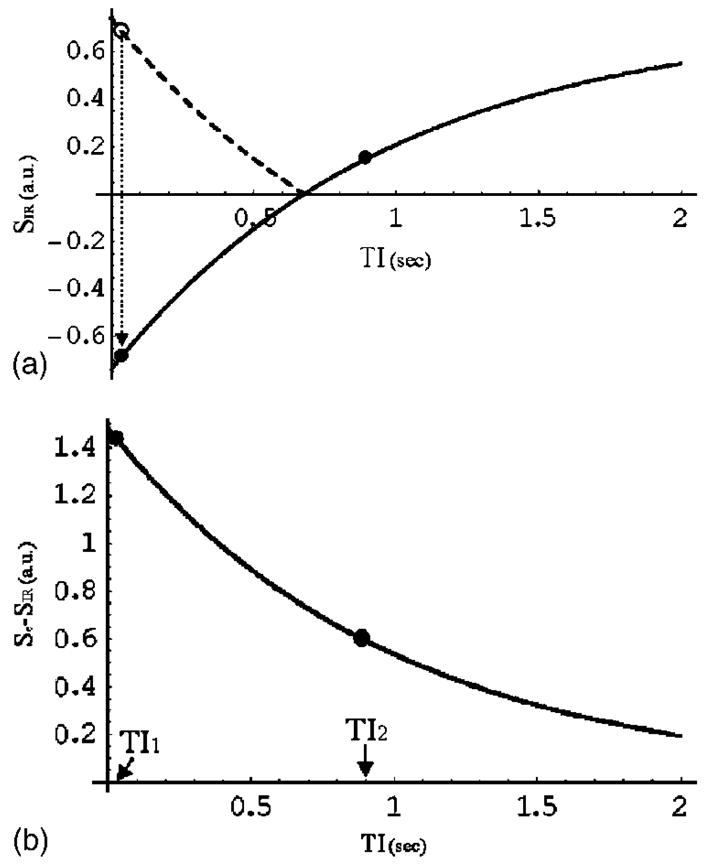
where k=cos(αeff) accounts for imperfect inversion by a pulse with effective flip angle αeff.6 Note that full relaxation is assumed (TR > seven times the T1 of brain tissue). To estimate T1, at least two measurements at two different inversion times TI1 and TI2 are required. From the two measurements shown in Fig. 1, yielding SIR1 at TI1 and SIR2 at TI2, two difference signals, Se − SIR1 and Se − SIR2, can be obtained. By taking their ratios (Se − SIR1)/(Se − SIR2), and rear-ranging the components, T1 can then be estimated from the expression
Fig. 1.

Simulation of the signal intensity of the inversion recovery sequence as a function of inversion time (TI) (A) and the difference signal intensity of Se − SIR (B). The parameters used were TE=15 ms, S0 =1.0, T2 * =50 ms, and T1 =980 ms for human gray matter at 1.5 T. In (A), the heavy dashed line before the zero crossing represents the absolute value of SIR. The two dots represent the inversion times, TI1 and TI2, used to calculate T1m from the difference signal.
| (2) |
with T1m indicating an estimated value of T1. By taking the ratio (Se − SIR1)/(Se − SIR2), the (1− k) term disappears, achieving insensitivity to inversion pulse imperfections.6 Note, standard MR acquisitions produce magnitude images only, but since it is obvious that spins must have a negative magnetization at the shortest TI1, the sign of SIR1 can be reversed in Eq. (2) to gain the full range of magnetization, as shown in Fig. 1.
To minimize the error in computing T1m of gray and white matter in the human brain, first-order error propagation theory was applied to determine an optimum combination of TI1 and TI2 values, assuming a perfect inversion rf pulse. With the assumption that the measurement errors of SIR1, SIR2, and Se are uncorrelated and that each has the same standard of deviation (σS, the standard of deviation of the error in the T1m measurement, (σT1m, is
| (3) |
The derivation of first-order error propagation for Eq. (3) can be found in references by Kurland8 and Imran et al.10 Obviously, TI2 must be different from TI1 to avoid a singularity from the 1/(TI2 −TI1) term in Eq. (3). On the other hand, their difference should not be too large, because 1/(TI2 −TI1) is counterbalanced by 1/exp(− (TI1 +TI2)/T1), indicating that the error increases if the signal-to-noise ratio (SNR) of the second IR measurement becomes too small as TI2 increases. From Eq. (3), the SNRs of T1m and Se are defined as SNRT1 = T1/(σT1m and SNRSe = Se/(σS, respectively.14 Equation (3) also implies that if T1 of gray matter and white matter are roughly known a priori, TI1 and TI2 values can be carefully optimized to maximize SNRT1 in human brain.
III. METHODS
A. Simulations
From Eq. (3) it is obvious that TI1 should be as short as possible. To determine the optimal inversion time of TI2 for human brain T1 measurements, computer simulations were performed to evaluate Eq. (3) with the following parameters: SNRSe =50 and T1 =980 ms (Ref. 7) for gray matter and SNRSe =30 and T1 =640 ms (Ref. 7) for white matter in human brain at 1.5 T. The SNRSe values are typical for the single-shot GE-EPI acquisitions described below. Optimized values found for TI1 and TI2 were then used in studies with normal volunteers to measure the pixel-wise T1m of brain tissue. The simulations were performed using MATHEMATICA software (Wolfram Research, Champaign, IL).
B. Experiments in human brain
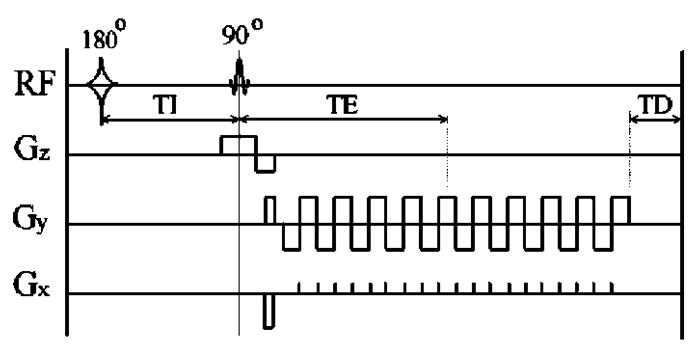
In order to minimize motion artifacts and noise differences between measurements, a sequence was developed to obtain three sets of images in a single scan using a series of 2D multislice EPI data acquisitions, as shown in Fig. 2. Here, 180° indicates a nonselective inversion pulse; 90° indicates a slice-selective 90° sinc-shaped pulse with duration of 2.56 ms. TE is the echo time between the 90° pulse and the center of EPI k space. Each slice is acquired with a 52 ms single-shot GE-EPI readout. TD is a variable delay time to maintain a constant TR for all three acquisitions [TR=slices*(TE+EPI/2) +TD0 =TI1 or 2 +slices*(TE+EPI/2) +TD1 or 2]. The first image acquisition, which provides the reference image used to calculate Se, does not involve an IR-preparation rf pulse. The second and third acquisitions are identical to the first except that a non-selective hyperbolic secant inversion pulse (12.8 ms duration, 50 μT of B1 field strength) was applied to invert spins on the whole volume of interest, followed by multislice acquisitions with two different inversion times, TI1 and TI2. In all three acquisitions, TR=7000 ms (about seven times T1 in gray matter) and TE=15 ms.
Fig. 2.

Pulse sequence timing diagram showing radio frequency (rf) pulses and gradients (Gr) along each spatial direction r=x, y, z. A nonselective hyperbolic inversion (180°) rf pulse is followed after the inversion time TI by a slice-selective sinc-shaped excitation (90°) pulse. Gz is the slice selective gradient. An echoplanar image (EPI) is generated by gradients Gy and Gx. TE is the echo time, and TD is a variable delay time and was adjusted to yield the same repetition time (TR=7000 ms) for all three images. The first image Se according to Eq. (2) is obtained without applying a 180° pulse, while the second SIR1 and third SIR2 images are acquired each with a 180° pulse at delays TI1 =40 ms and TI2 =900 ms, respectively.
To demonstrate the utility of this approach for the in vivo T1m measurement, nine normal volunteers (mean age and standard deviation=61±15 years and age range =37–80 years) were studied using a 1.5 T MR system (Vision, Siemens, Germany). A circularly polarized head coil was used for radio frequency transmission and reception. Seven 8 mm thick slices with a 3.4 × 3.4 mm2 in-plane resolution and a 2 mm gap were acquired in an interleaved fashion to minimize cross-talk effects between slices. The bottom slice was located 1 cm above the Circle of Willis for all subjects. Inversion times of TI1 =40 ms and TI2 =900 ms were chosen based on simulation results. The total acquisition time for seven slices was 21 s. The T1m value for each pixel was calculated using Eq. (2).
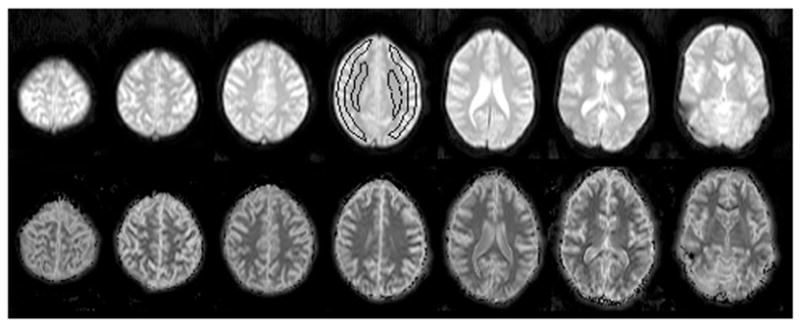
Regions of interest (ROIs) of gray matter and deep white matter in each subject were selected in the four slices (3 to 6) of the Se (reference) images using the OSIRIS software package (Geneva University Hospital, Geneva, Switzerland; http://www.sim.hcuge.ch). The gray and white matter T1 values for each subject were obtained by averaging over these ROIs. Note that images from the subjects were not normalized into a standard space; therefore, the size and anatomical locations of the ROIs used to obtain T1 values were different for each subject. Representative ROIs are shown in Fig. 4.
Fig. 4.

Images from one normal volunteer without inversion preparation (reference Se images, top row) and corresponding T1m maps (bottom row) for seven slices. Representative ROIs of gray matter and white matter were drawn on the middle slice out of seven slices as indicated in the figure. Slices 3 to 6 were used to measure average T1 values in each subject.
IV. RESULTS
A. Simulations
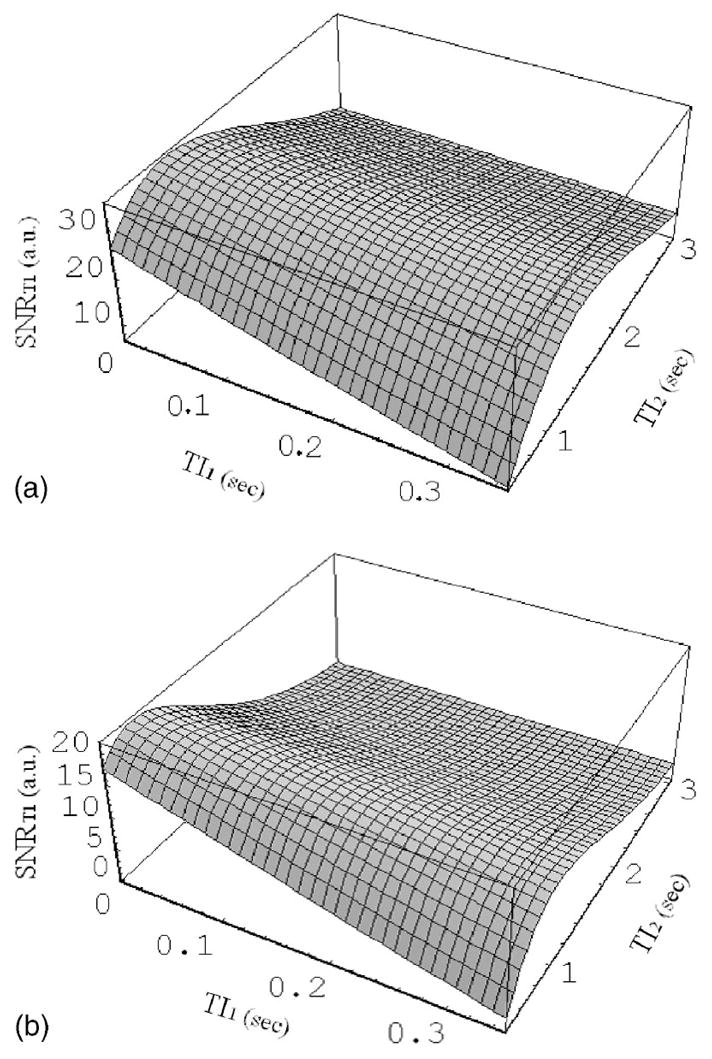
SNRT1, calculated according to Eq. (3), is plotted in Fig. 3 as a function of TI1 and TI2 for gray matter (A) and white matter (B). With longer TI1, the SNRT1 for gray matter and white matter decreased, indicating that the shortest possible TI1 (in this case, 40 ms) should be used. With TI1 =40 ms, the maximum SNRT1 was achieved, TI2 =1100 ms for gray matter and TI2 =700 ms for white matter. For the in vivo studies, it was decided to use the average of the optimal TI2 inversion times for gray and white matter, which was 900 ms.
Fig. 3.

Simulation of SNRT1, calculated according to Eq. (3), as a function of inversion times TI1 and TI2, assuming a perfect inversion pulse. The simulation parameters used were SNRSe =50 and T1 =980 ms for human gray matter (A) and SNRSe =30 and T1 =640 ms for human white matter (B) at 1.5 T. SNRT1 reached a maximum at TI2 =1100 ms for gray matter and at TI2 =700 ms for white matter with TI1 =40 ms.
B. Studies on human brain
Figure 4 shows single shot GE-EPI (Se) images and corresponding T1m maps from seven axial sections through the brain of a volunteer. Overall, the T1m maps show reasonable contrast between gray and white matter. Results of T1m estimates averaged over gray matter and white matter, respectively, from nine volunteer studies are listed in Table I. Averaged over all subjects, the proposed method yielded T1m values of 1094±18 ms for gray matter and 746±40 ms for white matter.
Table I.
T1m estimates for gray and white matter from nine volunteers.
| Subject | Graymatter T1m (ms) | Whitematter T1m (ms) |
|---|---|---|
| 1 | 1080±26 | 720±16 |
| 2 | 1075±55 | 750±9 |
| 3 | 1100±71 | 770±8 |
| 4 | 1110±57 | 703±12 |
| 5 | 1101±68 | 772±25 |
| 6 | 1090±63 | 682±33 |
| 7 | 1073±56 | 730±18 |
| 8 | 1130±82 | 810±25 |
| 9 | 1090±61 | 780±23 |
| Mean±STD | 1094±18 | 746±40 |
| Referencea | 980±63 | 640±30 |
Reference from phase-sensitive multipoint inversion recovery sequence published by Cho et al. (Ref. 7).
V. DISCUSSION
We have demonstrated that a new acquisition method with carefully selected values of two inversion times provides maps of T1 estimates of gray matter and white matter that are comparable to those obtained from a phase-sensitive multi-point inversion recovery technique.7 Compared to published two-point methods for T1 measurements,8–11 the proposed method has several advantages: (1) The method makes use of the full dynamic range of both SIR1 and SIR2, which should improve the SNR (Ref. 15) and therefore improve accuracy for T1 measurements. (2) By choosing TI1 and TI2 so that reasonable assumptions can be made about the signs of SIR1 and SIR2, the problem of identifying the negative-to-positive zero crossing of the IR signal is avoided, because both (Se−SIR1) and (Se − SIR2) always yield positive values.16 However, the proposed method has several limitations: Because nonselective inversion pulses are used, successive slices have different TI1’s and TI2’s. Therefore, although TI2−TI1 remains the same for all slices, not all slices will have the optimal inversion time for the highest SNRT1 and the dynamic range will decrease for successive slices. In addition, different slices will sample a different part of the relaxation curve, allowing accurate estimation of only monoexponential relaxation, To the extent that longitudinal relaxation in the human brain tissue is multiexponential, including effects due to partial volumes of gray matter, white matter, and CSF, slice-dependent errors in estimating T1 are introduced. Especially, when data acquisition occurs on a later part of a multiexponential curve, T1 will appear prolonged. The presence of partial volumes of brain tissue with CSF may have contributed to slightly higher T1 values in gray and white matter in this study than previously reported. Partial volume effects can be reduced with the acquisition of a higher resolution multishot EPI sequence.
Finally, one should note that the optimized parameters for measuring T1 of brain tissue result in an underestimation of the T1 of CSF by about a factor of 4 compared to a value of 4500 ms obtained with a multipoint inversion recovery technique.14 T1 of CSF in this study was 1020±65 ms. The proposed technique, therefore, cannot accurately measure T1 values for brain tissues and CSF with a single set of inversion times TI1 and TI2 because we do not obtain phase information of inverted spins. Therefore, to accurately measure T1 of CSF with this approach, the second inversion time of the sequence needs to be adjusted for CSF and a separate dataset acquired. In contrast to brain tissue, T1 measurements of CSF are accurate for TI2 values of about 5 s. However, a TI2 of 5 s is no longer optimal for gray, white, and most other brain tissue.
Because the proposed technique requires only two TI points with a reference EPI scan and no more than a few seconds to map T1, this technique should be useful for any clinical study that requires an estimate of the T1 of brain tissue. In addition, the proposed method is ideally suited for use in combination with EPI-based arterial spin labeling perfusion studies to quantitatively measure cerebral blood flow in brain. The arterial spin labeling perfusion images and a T1 map can be obtained with the same spatial resolution and similar EPI-related image distortions. Another possibility to derive T1m from Se and SIR2 datasets is to calculate the log transform of the images and compute T1m according to T1m =TI2/ln[(1−k)Se/(Se − SIR2)]. However, this method is very sensitive to the selection of the inversion time.
In conclusion, the proposed T1 measurement based on two IR images utilizes the full dynamic signal range and requires only a few seconds for acquisition, yet yields results similar to those of a conventional method. Therefore, this new method may be useful for obtaining T1 values of brain tissue in clinical studies, where short scan times and simplicity of data processing are imperative.
Acknowledgments
We thank Dr. Peter B. Kingsley for valuable comments. This work was supported by NIH/NIAAA Grant Numbers PO1 AA11493 and RO1 AA10788.
References
- 1.Kwong KK, Chesler DA, Weisskoff RM, Donahue KM, Davis TL, Ostergaard L, Campbell TA, Rosen BR. MR perfusion studies with T1-weighted echo planar imaging. Magn Reson Med. 1995;34:878–887. doi: 10.1002/mrm.1910340613. [DOI] [PubMed] [Google Scholar]
- 2.Jahng GH, Zhu XP, Matson GB, Weiner MW, Schuff N. Improved perfusion-weighted MRI by a novel double inversion with proximal labeling of both tagged and control acquisitions. Magn Reson Med. 2003;49:307–314. doi: 10.1002/mrm.10339. [DOI] [PMC free article] [PubMed] [Google Scholar]
- 3.Wolff SD, Balaban RS. Magnetization transfer contrast (MTC) and tissue water proton relaxation in vivo. Magn Reson Med. 1989;10:135–144. doi: 10.1002/mrm.1910100113. [DOI] [PubMed] [Google Scholar]
- 4.Dickinson RJ, Hall AS, Hind AJ, Young IR. Measurement of changes in tissue temperature using MR imaging. J Comput Assist Tomogr. 1986;10:468–472. [PubMed] [Google Scholar]
- 5.Kingsley PB. Signal intensities and T1 calculations in multiple-echo sequences with imperfect pulses. Concepts Magn Reson. 1999;11:29–49. [Google Scholar]
- 6.Kingsley PB. Methods of measuring spin-lattice (T1) relaxation times: An annotated bibliography. Concepts Magn Reson. 1999;11:243–276. [Google Scholar]
- 7.Cho S, Jones D, Reddick WE, Ogg RJ, Steen RG. Establishing norms for age-related changes in proton T1 of human brain tissue in vivo. Magn Reson Imaging. 1997;15:1133–1143. doi: 10.1016/s0730-725x(97)00202-6. [DOI] [PubMed] [Google Scholar]
- 8.Kurland RJ. Strategies and tactics in NMR imaging relaxation time measurements. I. Minimizing relaxation time errors due to image noise—the ideal case. Magn Reson Med. 1985;2:136–158. doi: 10.1002/mrm.1910020205. [DOI] [PubMed] [Google Scholar]
- 9.Lai S, Wang J, Jahng GH. FAIR exempting separate T1 measurement (FAIREST): A novel technique for online quantitative perfusion imaging and multi-contrast fMRI. NMR Biomed. 2001;14:507–516. doi: 10.1002/nbm.738. [DOI] [PubMed] [Google Scholar]
- 10.Imran J, Langevin F, Saint-Jalmes H. Two-point method for T1 estimation with optimized gradient-echo sequence. Magn Reson Imaging. 1999;17:1347–1356. doi: 10.1016/s0730-725x(99)00092-2. [DOI] [PubMed] [Google Scholar]
- 11.Parker GJ, Barker GJ, Tofts PS. Accurate multislice gradient echo T(1) measurement in the presence of nonideal rf pulse shape and rf field nonuniformity. Magn Reson Med. 2001;45:838–845. doi: 10.1002/mrm.1112. [DOI] [PubMed] [Google Scholar]
- 12.Mason GF, Chu WJ, Hetherington HP. A general approach to error estimation and optimized experiment design, applied to multislice imaging of T1 in human brain at 4.1 T. J Magn Reson. 1997;126:18–29. doi: 10.1006/jmre.1997.1143. [DOI] [PubMed] [Google Scholar]
- 13.Ordidge RJ, Gibbs P, Chapman B, Stehling MK, Mansfield P. High-speed multislice T1 mapping using inversion-recovery echo-planar imaging. Magn Reson Med. 1990;16:238–245. doi: 10.1002/mrm.1910160205. [DOI] [PubMed] [Google Scholar]
- 14.Haacke EM, Brown RW, Thompson MR, Venkatesan R. Magnetic Resonance Imaging: Physical Principles and Sequence Design. Chap 4. Wiley; New York: 1999. pp. 51–64. [Google Scholar]
- 15.Crawley AP, Henkelman RM. A comparison of one-shot and recovery methods in T1 imaging. Magn Reson Med. 1988;7:23–34. doi: 10.1002/mrm.1910070104. [DOI] [PubMed] [Google Scholar]
- 16.Kim SG, Hu X, Ugurbil K. Accurate T1 determination from inversion recovery images: Application to human brain at 4 Tesla. Magn Reson Med. 1994;31:445–449. doi: 10.1002/mrm.1910310414. [DOI] [PubMed] [Google Scholar]


