

Abstract
Frontotemporal dementia (FTD) is a neurodegenerative disease characterized by progressive behavioural abnormalities and frontotemporal atrophy. Here we used tensor based morphometry (TBM) to identify regions of longitudinal progression of gray matter atrophy in FTD compared to controls. T1-weighted MRI images were acquired at presentation and 1-year follow-up from 12 patients with mild to moderate FTD and 12 healthy controls. Using TBM as implemented in SPM2, a voxel-wise estimation of regional tissue volume change was derived from the deformation field required to warp a subject’s late to early anatomical images. A whole brain analysis was performed, in which a level of significance of p<0.05 corrected for multiple comparisons (family wise error-FWE) was accepted. Based on prior studies, a region of interest (ROI) analysis was also performed, including in the search area bilateral medial and orbital frontal regions, anterior cingulate gyrus, insula, amygdala and hippocampus. Within this ROI a level of significance of p<0.001 uncorrected was accepted. In the whole brain analysis, the anterior cingulate/paracingulate gyri were the only regions that showed significant atrophy change over 1 year. In the ROI analysis, the left ventro-medial frontal cortex, right medial superior frontal gyrus, anterior insulae and left amygdala/hippocampus showed significant longitudinal changes. In conclusion, limbic and paralimbic regions showed detectable gray matter contraction over 1 year in FTD, confirming the susceptibility of these regions to the disease and the consistency with their putative role in causing typical presenting behaviours. These results suggest that TBM might be useful in tracking progression of regional atrophy in FTD.
Introduction
Frontotemporal dementia (FTD) is the “behavioural” or “frontal” variant of frontotemporal lobar degeneration (FTLD) and is characterized by progressive changes in personality and behaviour (Neary et al., 1998) secondary to frontal lobe pathology. Most research efforts have concentrated on defining typical neuroimaging features of FTD cross-sectionally, but less is known about its clinical (Hodges et al., 2003; Roberson et al., 2005) and anatomical (Gregory et al., 1999; Chan et al., 2001; Whitwell et al., 2004) evolution over time.
Only a few MRI studies have attempted to delineate the longitudinal anatomical progression of FTD. A case report by Gregory and colleagues followed two FTD patients for 5 and 7 years (Gregory et al., 1999) and, as assessed by visual ratings, MRI scans appeared normal until several years after presentation. MRI analysis techniques based on the deformation field required to warp one scan into another, allow objective investigation of longitudinal neuroanatomical changes (Studholme et al., 2001; Leow et al., 2006). These techniques are particularly suitable to detect within-subject shape (deformation based morphometry-DBM) and volumetric (tensor based morphometry-TBM) changes over time (Ashburner and Friston, 2003; Leow et al., 2006). A TBM-like approach, called the brain boundary shift integral method, was used by Chan and colleagues to investigate longitudinal MRI changes in 17 patients with FTD (Chan et al., 2001). They examined whole-brain rates of atrophy and documented an annual volume loss of 3.7%. The authors also performed a regional analysis by dividing the brain into four quadrants (right anterior, left anterior, right posterior and left posterior). The anterior quadrants contained both the frontal lobes and the temporal poles. They found that atrophy occurred predominantly in the anterior quadrants in the FTD group, but their method was unable to pinpoint more precisely the regions affected. Another recent study found regional increases in atrophy rates in semantic dementia but not in FTD (Whitwell et al., 2004).
In this study, we used TBM as implemented in Statistical Parametric Mapping software (SPM2) to identify significant gray matter volume contraction over a 1-year period in a group of 12 FTD patients, at mild to moderate stages of the disease, compared to controls. Specifically, we analyzed the Jacobian matrices of the deformation field required to warp MRI serial scans in order to map voxel-wise volumetric differences between patients and controls over-time. This approach has been successfully applied to track longitudinal anatomical changes in Huntingtons’ disease (Kipps et al., 2005). This method allowed us to perform an unbiased, whole brain analysis and also a region of interest (ROI) search, including only regions that were found to be affected in FTD patients at a comparable stage of disease at pathology (Broe et al., 2003).
Methods
Subjects
Twelve FTD patients (mean age=60.4±6.0 years; 11 males; 1 female) and 12 healthy control subjects (mean age=63.7±6.6 years; 7 males, 5 females) were included in the study (see Table 1). All subjects were evaluated at the University of California, San Francisco, (UCSF) Memory and Aging Center (MAC) by a team of experienced clinicians, including a behavioural neurologist, a neuropsychologist, a nurse and a psychiatrist. Only subjects in whom a consensus diagnosis of FTD (Neary et al., 1998) or of “healthy aging” was reached were included in patient or control group respectively. To be considered for the study, subjects had to have at least two serial MR scans at an interval of 12±4 months. During this time, four FTD patients were treated with selective serotonin-reuptake inhibitors (SSRIs), and two with both SSRIs and atypical neuroleptic drugs. None of the healthy controls were taking any medication. There was no significant difference between the FTD and the control group for age, education and interval between MRI scans.
Table 1.
General demographic and functional information for FTD patients at Time 1 and Time 2
| FTD |
NC |
||
|---|---|---|---|
| TIME 1 Mean (S.D.) |
TIME 2 Mean (S.D.) |
TIME 1 Mean (S.D.) |
|
| Age | 60.4 (6.0) | 61.3 (6.0) | 63.7 (6.6) |
| Education | 16.6 (2.1) | - | 17.3 (1.8) |
| Sex (M/F) | 11/1 | - | 7/5 |
| MMSE | 25.5 (3.0)* | 23.1 (5.4)* | 29.7 (0.5) |
| CDR total | 0.9 (0.5)* | 1.2 (0.5)* | 0.0 (0.1) |
| CDR box scores | 4.9 (2.6)* | 7.3 (3.4)* | 0.0 (0.1) |
| GDS | 5.6 (4.3)* | 5.6 (3.5)* | 2.7 (1.6) |
Bold and Italicized text: Significant change in FTD patients from Time 1 to Time 2 at p<0.05.
Differs from NC group at p<0.05.
Abbreviations: NC=Normal Controls; MMSE=Mini Mental State Examination; CDR=Clinical Dementia Rating; GDS=Geriatric Depression Scale.
Functional and neuropsychological screening was performed for diagnostic purposes at both time points in patients and at Time 1 only for controls. Clinical Dementia Rating (CDR) (Morris, 1993), Mini Mental State Examination (MMSE) (Folstein et al., 1975), Geriatric Depression Scale (GDS) (Table 1) (Yesavage et al., 1983) and Neuropsychiatric Inventory (NPI) (Table 3) (Srikanth et al., 2005) assessed general functional level and behaviour. The neuropsychological screening battery comprised standard tests to evaluate language, memory, visuospatial and executive functions (see Table 2). FTD patients’ performances at Time 1 and 2 were compared, using two-tailed t-tests, to scores obtained at Time 1 by the control group. Paired t-tests were used to investigate progression over time in the FTD group.
Table 3.
Scores on the Neuropsychiatric Inventory (NPI) for FTD patients at Time 1 and Time 2
| TIME 1 Mean (S.D.) |
TIME 2 Mean (S.D.) |
|
|---|---|---|
| Total score | 31.1 (9.8)a | 36.9 (12.7)a |
| Caregiver distress | 17.8 (9.3)a | 16.1 (6.0)a |
| Delusions | 0.6 (1.4)a | 0 (0) |
| Hallucinations | 0 (0) | 0 (0) |
| Agitation | 3.1 (2.5)a | 3.9 (4.2)a |
| Depression | 1.5 (2.8)a | 0 (0) |
| Anxiety | 2.8 (2.4)a | 1.5 (1.9)a |
| Euphoria | 2.5 (2.5)a | 2.0 (2.2)a |
| Apathy | 6.4 (3.3)a | 7.4 (2.8)a |
| Disinhibition | 3.1 (1.8)a | 6.1 (5.4)a |
| Irritability | 2.1 (2.4)a | 1.6 (1.8)a |
| Aberrant motor | 4.1 (4.6)a | 7.1 (5.5)a |
| Aberrant sleep | 0.8 (1.0)a | 1.8 (1.8)a |
| Aberrant eating | 4.6 (2.5)a | 5.9 (4.4)a |
Bold and Italicized text: Significant change in FTD patients from Time 1 to Time 2 at p<0.05.
Pathological score.
Table 2.
FTD subjects’ scores on neuropsychological testing at Time 1 and Time 2
| Test | FTD |
NC |
|
|---|---|---|---|
| TIME 1 Mean (S.D.) |
TIME 2 Mean (S.D.) |
TIME 1 Mean (S.D.) |
|
| Language | |||
| Boston naming test (max=60) | 49.3 (11.8) | 51.6 (10.9) | 58.4 (2.8) |
| FAS verbal fluency (SS) | 8.3 (4.0)* | 7.0 (4.5)* | 13.3 (4.2) |
| Animal fluency (# words/min) | 11.2 (7.0)* | 10.4 (6.5)* | 24.6 (6.1) |
| Visuospatial | |||
| Block design (SS) | 9.6 (3.8) | 7.7 (5.2) | 12.0 (1.5) |
| VOSP number location (max=10) | 8.3 (1.7) | 6.8 (3.8) | 9.3 (1.1) |
| Verbal memory | |||
| CVLT-MS | |||
| Trials 1-4 Total (max=36) | 20.8 (5.3)* | 18.9 (7.5)* | 29.7 (4.7) |
| 30-s delay (max=9) | 4.9 (1.1)* | 3.4 (2.6)* | 8.0 (1.4) |
| 10-min delay | 4.1 (2.1)* | 2.6 (2.9)* | 7.6 (1.5) |
| # Recognized | 8.6 (0.5) | 8.3 (0.9) | 8.6 (0.7) |
| Nonverbal memory | |||
| Visual reproductions 1 (SS) | 8.3 (4.8) | 7.4 (6.8) | 10.8 (3.0) |
| Visual reproductions 2 (SS) | 11.0 (5.5) | 8.0 (5.6)* | 12.8 (2.8) |
| Executive | |||
| WAIS-III digit span (SS) | 9.7 (3.0) | 7.6 (1.8)* | 12.5 (2.3) |
| # digits forward | 7.0 (1.4) | 5.9 (1.2) | 6.9 (1.1) |
| # digits backward | 4.4 (1.3) | 3.6 (0.8)* | 5.5 (1.7) |
| WAIS-III spatial span (SS) | 7.9 (4.5) | 6.4 (4.2) | 11.5 (1.2) |
| Set-Shifting (SS) | 5.8 (3.8)* | 8.8 (5.0) | 13.1 (1.7) |
| Color-word interference | |||
| Word (SS) | 6.0 (3.9) | 3.4 (4.8)* | 10.8 (1.4) |
| Color (SS) | 4.0 (3.1)* | 3.4 (4.8)* | 10.5 (2.1) |
| Interference (SS) | 2.3 (2.3)* | 2.0 (1.7)* | 12.0 (1.2) |
| Trailmaking | |||
| Number sequencing (SS) | 8.0 (3.8) | 6.2 (5.6) | 11.3 (1.6) |
| Letter sequencing (SS) | 7.0 (4.9) | 5.0 (5.4)* | 11.9 (1.4) |
| Number-Letter sequencing (SS) | 6.0 (6.0) | 6.0 (5.0) | 11.9 (2.0) |
Bold and Italicized text: Significant change in FTD patients from Time 1 to Time 2 at p<0.05.
Differs from NC group at p<0.05.
Abbreviations: SS=Scaled Score; VOSP=Visual Object and Space Perception; CVLT-MS=California Verbal Learning Test-Mental Status; WAIS=Wechsler Adult Intelligence Scale.
Average MMSE was 25.5±3.0 and total CDR score was 0.9±0.5, suggesting borderline abnormal general cognition and functional status in FTD patients (Table 1). Fluency, verbal learning but not recognition memory, and some executive tests were impaired at Time 1 compared to controls. Consistent with the diagnosis of FTD, patients had significantly abnormal behaviour as revealed by the NPI, with highest scores in apathy, aberrant motor behaviour and aberrant eating behaviour (Table 3).
The CDR Sum of Box scores showed significant progression of functional impairment over 1 year (Table 2). Mild progression of cognitive deficits over 1 year was seen in working memory and efficiency of learning and free recall on both verbal and non-verbal memory tests (Table 2). However, many patients’ scores at Time 2 still did not fall in the impaired range. NPI scores showed significant worsening over time only in the domain of aberrant motor behaviour (Table 3).
All subjects or their caregivers gave informed consent and the study was approved by UCSF Committee on Human Research.
Imaging acquisition
Early and late brain structural MRI scans were obtained with a 1.5 Tesla Magneton VISION system (Siemens Inc., Iselin, NJ). A volumetric magnetization prepared rapid gradient echo (MP-RAGE) MRI was used to obtain a T1-weighted image of the entire brain, 1.0×1.0 mm in-plane resolution, 1.5 mm slab thickness, as described in a previous study (Rosen et al., 2002).
Tensor based morphometry analysis
TBM analysis included image pre-processing and statistical analysis, both implemented in the SPM2 software package (The Wellcome Department of Imaging Neuroscience, London; http:www.fil.ion.ucl.ac.uk/spm). Pre-processing TBM procedures are described in detail in a previous article (Kipps et al., 2005). In addition, we applied a bias correction to the late scan to make it comparable to the early one. Briefly, a high-dimensional deformation field was used to warp the corrected late image to match the early one within subject (Ashburner et al., 2000). The amount of volume change was quantified by taking the determinant of the gradient of deformation at a single-voxel level (Jacobian determinants). The following formula was applied to the segmented gray matter image obtained from the first scan and the Jacobian determinant map: (Jacobian value-1)*GM. The resulting product image represented a measure of the gray matter specific volume change between the first and the second scan. A study-specific template and prior probability maps were created. The normalization parameters were estimated by matching the customized gray matter template with the segmented gray matter image from the first scan and were then applied to the product image (Ashburner and Friston, 1999). Normalized images were smoothed using a 12 mm isotropic Gaussian kernel. Finally, smoothed images were multiplied by an inclusive binary mask identifying only gray matter tissue.
A ‘single-subject conditions and covariate’ statistical model was used to identify the brain regions showing greater progression of gray matter atrophy in FTD than in controls over a 1-year period. Sex, age, and total intracranial volume at the time of the second scan were entered into the statistical model as nuisance covariates. Regionally specific differences in gray matter volume contraction were assessed using the general linear model and the significance of each effect was determined using the theory of Gaussian fields (Friston et al., 1995). Two analyses were performed on TBM data: 1) A whole-brain analysis, in which we accepted a conservative level of significance of p<0.05 corrected for multiple comparisons (SPM-family wise error-FWE); and 2) A region of interest (ROI) analysis, looking for longitudinal changes in regions where Broe and colleagues (Broe et al., 2003) found pathological changes in FTD patients at a comparable stage of disease. The ROI included the medial and orbital frontal regions, anterior cingulate gyrus, insula, amygdala and hippocampus bilaterally. It was created from the AAL brain atlas (Tzourio-Mazoyer et al., 2002) and applied to the SPM dataset using WFU Pickatlas (Maldjian et al., 2003, 2004). Within this ROI we accepted a more sensitive level of significance of p<0.001 uncorrected.
Results
In the whole brain analysis, the only region showing significant longitudinal progression of gray matter atrophy in FTD compared to controls was the bilateral anterior cingulate/paracingulate gyri (BA 32) (p<0.05 FWE whole brain corrected) (Table 4 and Fig. 1).
Table 4.
Regions that show gray matter contraction in FTD compared to controls at p<0.001 uncorrected for multiple comparisons
| Brain region (BA) | x | y | z | T value | Z score | |
|---|---|---|---|---|---|---|
| Anterior cingulate/paracingulate gyrus (10/32) | L | -6 | 37 | 32 | 6.4 | 4.6* |
| L | -6 | 54 | 9 | 4.7 | 3.8 | |
| R | 7 | 55 | 5 | 6.5 | 4.7* | |
| R | 8 | 32 | 41 | 5.3 | 4.1 | |
| R | 12 | 53 | 27 | 4.2 | 3.5 | |
| Ventro-medial frontal cortex (11) | L | -2 | 21 | -13 | 4.1 | 3.4 |
| Superior frontal gyrus, medial portion (32) | R | 10 | 52 | 27 | 3.8 | 3.2 |
| Insula (NA) | L | -28 | 15 | -13 | 4.1 | 3.4 |
| R | 41 | 10 | -1 | 4.1 | 3.4 | |
| Amygdala/Hippocampus (NA) | L | -20 | -2 | -15 | 4.0 | 3.4 |
R=right; L=left; BA=Brodmann area; NA=no Brodmann’s designation.
p<0.05 corrected for multiple comparisons (SPM-Family Wise Error, FWE).
Fig. 1.
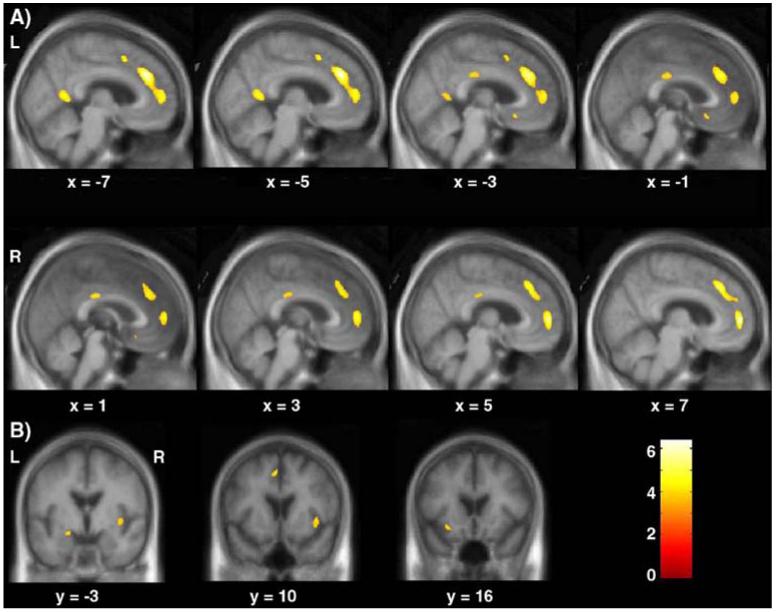
Representative sagittal (A) and coronal (B) slices showing progression of gray matter contraction over 1-year period in FTD relative to controls. The results are superimposed on the study-specific anatomical template. The threshold for display is p<0.001 uncorrected.
In the ROI analysis, progression of atrophy was observed in the left ventro-medial frontal cortex (BA 11), the right medial portion of the superior frontal gyrus (BA 32), the insulae and the left medial temporal lobe in a cluster including both the amygdala and the hippocampus (at p<0.001 uncorrected).
We also explored whether other regions outside of our ROI showed atrophy changes compared to controls at a threshold of p<0.001 uncorrected. Two small regions within the middle and posterior cingulate gyrus were the only additional areas that showed a difference compared to controls at a threshold of p<0.001 uncorrected. Since these effects did not reach our pre-established level of significance, these regions will not be discussed but are nevertheless illustrated in Fig. 1.
Discussion
We used tensor based morphometry (TBM) to investigate the progression of gray matter atrophy over a 1-year period in FTD, also known as the “frontal” or “behavioural variant” of frontotemporal lobar degeneration (FTLD). Results showed gray matter contraction in the anterior cingulate/paracingulate and ventro-medial frontal regions, the insulae, and the medial temporal cortex. These findings substantiate previous studies that emphasize the important role of damage to limbic/paralimbic circuits in the pathogenesis of FTD. Furthermore, tracking longitudinal changes in these regions with TBM provided an informative measure of disease progression.
The most significant progression of atrophy over a 1-year period in FTD was observed in the anterior cingulate/paracingulate cortex. Previous cross-sectional neuroimaging studies have consistently shown that FTD is associated with atrophy or decreased metabolism in this region compared to controls or other dementias (Ishii et al., 1998; Garraux et al., 1999; Rosen et al., 2002; Varrone et al., 2002; Salmon et al., 2003; Boccardi et al., 2005; Franceschi et al., 2005; Jeong et al., 2005; Williams et al., 2005). The other regions that showed longitudinal loss of gray matter (the medial temporal, medial frontal, and insular cortices) are heavily anatomically interconnected with the anterior cingulate and with each other. They form the limbic/paralimbic circuit that has been shown to have a functional role in the orchestration of flexible, goal-directed behaviour (Ongur and Price, 2000). Progressive atrophy of this network is likely responsible for the development of typical behavioural abnormalities in FTD. Further investigations involving larger groups of subjects and including cognitive and behavioural tasks sensitive to medial frontal lobe functions, will allow direct correlation of regional MRI atrophy progression with decline in behavioural measures. This type of correlation analysis has previously provided promising results in FTD patients (Avants et al., 2005).
Although MR images were acquired only 1 year apart and on a 1.5 T magnet, the results showed significant progression of gray matter loss restricted to the regions most relevant to FTD, suggesting that TBM is a very sensitive method for detecting disease-specific longitudinal anatomical changes. On the other hand, the NPI did not detect significant commensurate behavioural changes in this small group of mild to moderate stage patients (MMSE 25, CDR 0.9). This discrepancy between clinical and anatomical findings could be due to the fact that automated brain analysis is a more objective measure, not susceptible to the many uncontrolled factors influencing clinical assessment. Therefore, TBM may be a useful technique for assessing the effects of potentially disease-modifying treatments in clinical trials. To assess the utility of TBM in this application, its anatomical specificity would first have to be evaluated by comparing large groups of patients with different, pathologically confirmed neurodegenerative diseases. Our study does not directly address this issue, but our results are encouraging since they show anatomical progression of FTD in a paralimbic network distinct from the temporo-parietal regions in which progression has been demonstrated in AD using similar tensor-based methods (Thompson et al., 2003).
In conclusion, our study shows that the anterior cingulate, medial frontal, insular, and temporal regions that show early atrophy in FTD (Broe et al., 2003) are also the ones that progress most rapidly. The ability to track regional atrophy changes over time may help refine clinical diagnosis and monitor disease progression in FTD.
Acknowledgments
The study was supported by NINDS (R01 NS050915), NIA (P50 AG03006, P01 AG019724), the State of California (DHS 04-35516), the John Douglas French Alzheimer’s Foundation, the McBean Foundation and the Larry Hillblom Foundation (grant #2002/2F). We thank patients and their families for the time and effort they dedicate to this research.
References
- Ashburner J, Friston KJ. Nonlinear spatial normalization using basis functions. Hum. Brain Mapp. 1999;7(4):254–266. doi: 10.1002/(SICI)1097-0193(1999)7:4<254::AID-HBM4>3.0.CO;2-G. [DOI] [PMC free article] [PubMed] [Google Scholar]
- Ashburner J, Friston KJ. Morphometry. In: Frackowiak RSJ, Friston KJ, Frithet CD, editors. Human Brain Function. Academic Press; 2003. [Google Scholar]
- Ashburner J, Andersson JL, Friston KJ. Image registration using a symmetric prior—in three dimensions. Hum. Brain Mapp. 2000;9(4):212–225. doi: 10.1002/(SICI)1097-0193(200004)9:4<212::AID-HBM3>3.0.CO;2-#. [DOI] [PMC free article] [PubMed] [Google Scholar]
- Avants B, Grossman M, Gee JC. The correlation of cognitive decline with frontotemporal dementia induced annualized gray matter loss using diffeomorphic morphometry. Alzheimer Dis. Assoc. Disord. 2005;19(Suppl 1):S25–S28. doi: 10.1097/01.wad.0000183083.14939.82. [DOI] [PubMed] [Google Scholar]
- Boccardi M, Sabattoli F, Laakso MP, Testa C, Rossi R, Beltramello A, Soininen H, Frisoni GB. Frontotemporal dementia as a neural system disease. Neurobiol. Aging. 2005;26(1):37–44. doi: 10.1016/j.neurobiolaging.2004.02.019. [DOI] [PubMed] [Google Scholar]
- Broe M, Hodges JR, Schofield E, Shepherd CE, Kril JJ, Halliday GM. Staging disease severity in pathologically confirmed cases of frontotemporal dementia. Neurology. 2003;60(6):1005–1011. doi: 10.1212/01.wnl.0000052685.09194.39. [DOI] [PubMed] [Google Scholar]
- Chan D, Fox NC, Jenkins R, Scahill RI, Crum WR, Rossor MN. Rates of global and regional cerebral atrophy in AD and frontotemporal dementia. Neurology. 2001;57(10):1756–1763. doi: 10.1212/wnl.57.10.1756. [DOI] [PubMed] [Google Scholar]
- Folstein MF, Folstein SE, McHugh PR. “Mini-mental state”. A practical method for grading the mental state of patients for the clinician. J. Psychiatr. Res. 1975;12:189–198. doi: 10.1016/0022-3956(75)90026-6. [DOI] [PubMed] [Google Scholar]
- Franceschi M, Anchisi D, Pelati O, Zuffi M, Matarrese M, Moresco RM, Fazio F, Perani D. Glucose metabolism and serotonin receptors in the frontotemporal lobe degeneration. Ann. Neurol. 2005;57(2):216–225. doi: 10.1002/ana.20365. [DOI] [PubMed] [Google Scholar]
- Friston KJ, Holmes AP, Worsley KJ, Poline J-B, Frith CD, Frackowiak RSJ. Statistical parametric maps in functional imaging: a general linear approach. Hum. Brain Mapp. 1995;2:189–210. [Google Scholar]
- Garraux G, Salmon E, Degueldre C, Lemaire C, Laureys S, Franck G. Comparison of impaired subcortico-frontal metabolic networks in normal aging, subcortico-frontal dementia, and cortical frontal dementia. NeuroImage. 1999;10(2):149–162. doi: 10.1006/nimg.1999.0463. [DOI] [PubMed] [Google Scholar]
- Gregory CA, Serra-Mestres J, Hodges JR. Early diagnosis of the frontal variant of frontotemporal dementia: how sensitive are standard neuroimaging and neuropsychologic tests? Neuropsychiatry, Neuropsychology, and Behavioral Neurology. 1999;12(2):128–135. [PubMed] [Google Scholar]
- Hodges JR, Davies R, Xuereb J, Kril J, Halliday G. Survival in frontotemporal dementia. Neurology. 2003;61(3):349–354. doi: 10.1212/01.wnl.0000078928.20107.52. [DOI] [PubMed] [Google Scholar]
- Ishii K, Sakamoto S, Sasaki M, Kitagaki H, Yamaji S, Hashimoto M, Imamura T, Shimomura T, Hirono N, Mori E. Cerebral glucose metabolism in patients with frontotemporal dementia. J. Nucl. 1998;39(11):1875–1878. [PubMed] [Google Scholar]
- Jeong Y, Cho SS, Park JM, Kang SJ, Lee JS, Kang E, Na DL, Kim SE. 18F-FDG PET findings in frontotemporal dementia: an SPM analysis of 29 patients. J. Nucl. Med.: Off. Publ. Soc. Nucl. Med. 2005;46(2):233–239. [PubMed] [Google Scholar]
- Kipps CM, Duggins AJ, Mahant N, Gomes L, Ashburner J, McCusker EA. Progression of structural neuropathology in preclinical Huntington’s disease: a tensor based morphometry study. J. Neurol. Neurosurg. Psychiatry. 2005;76(5):650–655. doi: 10.1136/jnnp.2004.047993. [DOI] [PMC free article] [PubMed] [Google Scholar]
- Leow AD, Klunder AD, Jack CR, Jr., Toga AW, Dale AM, Bernstein MA, Britson PJ,, Gunter JL, Ward CP, Whitwell JL, Borowski BJ, Fleisher AS, Fox NC, Harvey D, Kornak J, Schuff N, Studholme C, Alexander GE, Weiner MW, Thompson PM. Longitudinal stability of MRI for mapping brain change using tensor-based morphometry. NeuroImage. 2006;31(2):627–640. doi: 10.1016/j.neuroimage.2005.12.013. [DOI] [PMC free article] [PubMed] [Google Scholar]
- Maldjian JA, Laurienti PJ, Kraft RA, Burdette JH. An automated method for neuroanatomic and cytoarchitectonic atlas-based interrogation of fMRI data sets. NeuroImage. 2003;19(3):1233–1239. doi: 10.1016/s1053-8119(03)00169-1. [DOI] [PubMed] [Google Scholar]
- Maldjian JA, Laurienti PJ, Burdette JH. Precentral gyrus discrepancy in electronic versions of the Talairach atlas. NeuroImage. 2004;21(1):450–455. doi: 10.1016/j.neuroimage.2003.09.032. [DOI] [PubMed] [Google Scholar]
- Morris JC. The clinical dementia rating (CDR): current version and scoring rules. Neurology. 1993;43(11):2412–2414. doi: 10.1212/wnl.43.11.2412-a. [DOI] [PubMed] [Google Scholar]
- Neary D, Snowden JS, Gustafson L, Passant U, Stuss D, Black S, Freedman M, Kertesz A, Robert PH, Albert M, Boone K, Miller BL, Cummings J, Benson DF. Frontotemporal lobar degeneration: a consensus on clinical diagnostic criteria. Neurology. 1998;51(6):1546–1554. doi: 10.1212/wnl.51.6.1546. [DOI] [PubMed] [Google Scholar]
- Ongur D, Price JL. The organization of networks within the orbital and medial prefrontal cortex of rats, monkeys and humans. Cereb. Cortex. 2000;10(3):206–219. doi: 10.1093/cercor/10.3.206. [DOI] [PubMed] [Google Scholar]
- Roberson ED, Hesse JH, Rose KD, Slama H, Johnson JK, Yaffe K, Forman MS, Miller CA, Trojanowski JQ, Kramer, et al. Frontotemporal dementia progresses to death faster than Alzheimer disease. Neurology. 2005;65(5):719–725. doi: 10.1212/01.wnl.0000173837.82820.9f. [DOI] [PubMed] [Google Scholar]
- Rosen HJ, Gorno-Tempini ML, Goldman WP, Perry RJ, Schuff N, Weiner M, Feiwell R, Kramer JH, Miller BL. Patterns of brain atrophy in frontotemporal dementia and semantic dementia. Neurology. 2002;58(2):198–208. doi: 10.1212/wnl.58.2.198. [DOI] [PubMed] [Google Scholar]
- Salmon E, Garraux G, Delbeuck X, Collette F, Kalbe E, Zuendorf G, Perani D, Fazio F, Herholz K. Predominant ventromedial frontopolar metabolic impairment in frontotemporal dementia. NeuroImage. 2003;20(1):435–440. doi: 10.1016/s1053-8119(03)00346-x. [DOI] [PubMed] [Google Scholar]
- Srikanth S, Nagaraja AV, Ratnavalli E. Neuropsychiatric symptoms in dementia-frequency, relationship to dementia severity and comparison in Alzheimer’s disease, vascular dementia and frontotemporal dementia. J. Neurol. Sci. 2005;236(12):43–48. doi: 10.1016/j.jns.2005.04.014. [DOI] [PubMed] [Google Scholar]
- Studholme C, Cardenas V, Schuff N, Rosen H, Miller B, Weiner M. Detecting spacially consistent structural differences in Alzheimer’s and frontotemporal dementia using deformation morphometry. MICCAI. 2001:41–48. [Google Scholar]
- Thompson PM, Hayashi KM, de Zubicaray G, Janke AL, Rose SE, Semple J, Herman D, Hong MS, Dittmer SS, Doddrell DM, Toga AW. Dynamics of gray matter loss in Alzheimer’s disease. J. Neurosci. 2003;23(3):994–1005. doi: 10.1523/JNEUROSCI.23-03-00994.2003. [DOI] [PMC free article] [PubMed] [Google Scholar]
- Tzourio-Mazoyer N, Landeau B, Papathanassiou D, Crivello F, Etard O, Delcroix N, Mazoyer B, Joliot M. Automated anatomical labeling of activations in SPM using a macroscopic anatomical parcellation of the MNI MRI single-subject brain. NeuroImage. 2002;15(1):273–289. doi: 10.1006/nimg.2001.0978. [DOI] [PubMed] [Google Scholar]
- Varrone A, Pappata S, Caraco C, Soricelli A, Milan G, Quarantelli M, Alfano B, Postiglione A, Salvatore M. Voxel-based comparison of rCBF SPET images in frontotemporal dementia and Alzheimer’s disease highlights the involvement of different cortical networks. Eur. J. Nucl. Med. Mol. Imaging. 2002;29(11):1447–1454. doi: 10.1007/s00259-002-0883-5. [DOI] [PubMed] [Google Scholar]
- Whitwell JL, Anderson VM, Scahill RI, Rossor MN, Fox NC. Longitudinal patterns of regional change on volumetric MRI in frontotemporal lobar degeneration. Dement. Geriatr. Cogn. Disord. 2004;17(4):307–310. doi: 10.1159/000077160. [DOI] [PubMed] [Google Scholar]
- Williams GB, Nestor PJ, Hodges JR. Neural correlates of semantic and behavioural deficits in frontotemporal dementia. NeuroImage. 2005;24(4):1042–1051. doi: 10.1016/j.neuroimage.2004.10.023. [DOI] [PubMed] [Google Scholar]
- Yesavage JA, Brink TL, Rolse TL, Lum O, Huang V, Adey M, Leiter VO. Development and validity of a geriatric depression scale: a preliminary report. J. Psychiatr. Res. 1983;17:37–49. doi: 10.1016/0022-3956(82)90033-4. [DOI] [PubMed] [Google Scholar]