Abstract
Plasmids maintain themselves in their bacterial host through several different mechanisms, one of which involves the synthesis of plasmid-encoded toxin and antitoxin proteins. When the plasmid is present the antitoxin binds to and neutralizes the toxin. If a plasmid-free daughter cell arises, however, the labile antitoxin is degraded (and not replenished) and the toxin kills the cell from within. These toxin-antitoxin (TA) systems thereby function as post-segregational killing systems, and the disruption of the TA interaction represents an intriguing antibacterial strategy. It was recently discovered that the genes for one particular TA system, MazEF, are ubiquitous on plasmids isolated from clinical vancomycin-resistant enterococci (VRE) strains. It thus appears that small molecule disruptors of the MazEF interaction have potential as antibacterial agents. The MazF toxin protein is known to be a ribonuclease. Unfortunately, traditional methods for the assessment of MazF activity rely on the use of radiolabeled substrates followed by analysis with polyacrylamide gel electrophoresis. Described herein is a simple and convenient continuous assay for the assessment of MazF activity. This assay utilizes an oligonucleotide with a fluorophore on the 5′-end and a quencher on the 3′-end, and processing of this substrate by MazF results in a large increase in the fluorescence signal. Through this assay we have for the first time determined a KM and Vmax for this enzyme, and have also found that MazF is not inhibited by standard ribonuclease inhibitors. This assay will be useful to those interested in the biochemistry of the MazF family of toxins and the disruption of MazE-MazF.
Introduction
Once regarded as a microbiological curiosity, it is now apparent that toxin-antitoxin (TA) systems play important roles in bacterial stress response and resistance to antibiotics [1-3]. Most proteic TA systems are characterized by two small (8-15 kDa) proteins, a stable toxin and a labile antitoxin, and genes encoding these proteins have been identified on a wide range of bacterial chromosomes and plasmids [4, 5]. If both proteins are actively being produced by the bacterial cell, the antitoxin binds the toxin and inhibits its toxic activity. However, if the cellular levels of the antitoxin drop, the toxic protein will be unleashed to halt growth and/or kill the cell.
When encoded by plasmids, TA systems serve as a postsegregational killing system (PSK) [6] that allows the plasmid to maintain itself in the bacterial population in the absence of selective pressure; if during cell division a plasmid-free daughter cell arises, the labile antitoxin is quickly degraded (and due to the absence of plasmid is not replenished) freeing the toxin to kill the cell [1]. Such TA systems are sometimes referred to as “plasmid addiction” modules [7, 8]. The precise role of TA systems encoded by bacterial chromosomes is less clear, but there is evidence that they may serve as stress response elements, as toxin-induced cell death is observed under conditions including high temperatures, DNA damage, oxidative stress [9], thymine starvation [10], and antibiotic treatment [11]. In addition, the transcription of genes from chromosomally encoded TA loci are upregulated during amino acid starvation [12, 13].
Given that a large percentage of genes that mediate resistance to antibiotics are found on extrachromosomal DNA such as plasmids [14, 15], coupled with the ability of TA systems to stabilize plasmids, it has been speculated that pharmacological disruption of the toxin-antitoxin protein-protein interaction could unleash the toxin and be a novel antibacterial strategy [2, 5, 16, 17]. It was not until recently, however, that it was discovered that TA systems are indeed ubiquitous on plasmids that reside in a common bacterial pathogen that is refractory to most antibiotics, vancomycin-resistant enterococci (VRE) [5]. In this survey, the genes encoding the mazEF, relBE, and axe-txe TA systems were found to be quite prevalent on plasmids isolated from clinical VRE strains. In particular, the mazEF genes were found on plasmids in 100% (75 out of 75) of the VRE isolates [5].
MazEF was originally discovered on the E. coli chromosome [18, 19] and has since been extensively characterized. Much is known about the TA protein complex, as the crystal structure of the toxin, MazF, in complex with the antitoxin, MazE, has been solved [20]. The MazEF complex has a heterohexamer structure, with two MazF homodimers flanking a single MazE homodimer. The C-terminus of each MazE monomer wraps around the interface of each MazF homodimer to neutralize MazF toxicity. It has only been recently, however, that the toxic effect of MazF has been conclusively tied to its ribonuclease activity [21, 22]. MazF is known to have a specificity for ACA sequences in single-stranded RNA, typically cleaving after the first A, although cleavage before the first A has also been observed [23, 24].
No detailed analysis of the kinetics of the MazF-mediated cleavage of RNA is available, and such studies are hampered by the lack of a convenient method for the assessment of MazF activity. Up until now, MazF activity has been monitored with radiolabeled oligonucleotides/gel electrophoresis, or MALDI mass spectrometry [23-25]. While these techniques have proved instrumental to the characterization of MazF activity, these discontinuous methods make the evaluation of multiple substrate types and concentrations prohibitive. Described herein is a continuous fluorometric substrate for MazF that enables a real-time quantitation of MazF enzymatic activity and a full kinetic analysis of this enzyme. We show this new assay is also suitable for the quantitative evaluation of MazF inhibitors and could be used to screen for disruptors of the MazEF complex in a high-throughput manner.
Materials and Methods
Materials
Primers, unlabeled oligonucleotides, oligonucleotides of the sequence 5′-AAGTCrGACATCAG-3′ labeled with 6-carboxyfluorescein (6-FAM) on the 5′-end and with Black Hole Quencher 1 (BHQ1) on the 3′-end, and the corresponding oligonucleotide cleavage fragments, 6-FAM-labeled 5′-AAGTCG-3′ and BHQ1-labeled 5′-ACATCAG-3′, were purchased from Integrated DNA Technologies (Coralville, IA). Black, tissue culture treated 384-well plates were purchased from Matrix Technologies (Hudson, NH). Protein purification buffers were modified from those described for protein purification under native conditions by Qiagen (Valencia, CA). Binding buffer consists of 50 mM Tris-Cl (pH 8.0), 300 mM NaCl, and 10 mM imidazole, wash buffer consists of 50 mM Tris-Cl (pH 8.0), 300 mM NaCl, 20 mM imidazole, and elution buffer contains 50 mM Tris-Cl (pH 8.0), 300 mM NaCl, and 250 mM imidazole.
Cloning
The mazEF gene cassette was amplified by PCR (primers 5′-CACCATGATCCACAGTAGCGTAAAGCGTTGG-3′ and 5′-CTACCCAATCAGTACGTTAATTTTGGC-3′) using plasmid DNA extracted from a clinical isolate of vancomycin resistant enterococci (SL171RF) [5]; sequence analysis of this mazEF loci showed it to be identical to the mazEF sequence from the E. coli chromosome. Plasmid pKm6EF was then constructed by cloning the amplified mazEF gene cassette into the pET200 expression vector using the Champion pET Directional TOPO Expression Kit (Invitrogen, Carlsbad, CA). pKm6EF encodes the MazEF protein complex with an N-terminal histidine-6 tag; thus in this system, the histidine tag is appended to the N-terminus of the MazE protein, and the MazF protein is not tagged. To create an expression vector that would result in an untagged MazE and a C-terminally tagged MazF, site-directed mutagenesis of pKm6EF was performed in two rounds to install restriction sites on each end of the mazEF gene cassette. The first round introduced an NcoI restriction site on the 5′-end of the gene (primers 5′-GATAAGGATCATCCCTTCACCATGGTCCACAGTAGCGRAAAGCG-3′ and 5′–CGCTTTACGCTACTGTGGACCATGGTGAAGGGATGATCCTTATC-3′) and the second round of mutagenesis introduced a XhoI cut site on the 3′-end of the mazEF insert and removed the stop codon to allow translation of a 3′-histidine tag (primers 5′-GGATCGTTGAGCTCGAGCTTCTTCCCAATCAGTACGTTAATTTTGG-3′ and 5′-CCAAAATTAACGTACTGATTGGGAAGAAGCTCGAGCTCAACGATCC-3′). The mazEF gene was excised from this mutated pKm6EF plasmid with NcoI and XhoI and digestion products were run on a 0.6% agarose gel. The mazEF gene cassette was purified by gel extraction and cloned into the pET28a expression vector (Novagen, San Diego, CA) to construct plasmid pKmEF6.
Each site directed mutagenesis reaction was performed in a final volume of 50 μL containing 1 ng/μL template DNA, 2.5 ng/μL each primer, 200 μM each deoxynucleoside triphosphate, 2.5 units of PfuTurbo DNA polymerase (Stratagene, La Jolla, CA), 10 mM KCl, 10 mM (NH4)2SO4, 20 mM Tris-HCl (pH 8.8), 2 mM MgSO4, 0.1% Triton X-100, and 100 ng/μL bovine serum albumin (BSA). Reactions were carried out in a PTC-200 DNA thermal cycler (MJ Research, Cambridge, MA) with an initial denaturation step (95°C, 30 sec) followed by 20 cycles of denaturation (95°C, 30 sec), annealing (55°C, 1 min), and extension (68°C, 7 min). DnpI (20 units; New England Biolabs, Ipswich, MA) was subsequently added to each reaction and digests were allowed to incubate at 37°C for 1 hour.
Protein expression and purification
(His)6MazE/MazF and MazE/MazF(His)6 were expressed using the same procedure. A 20 mL overnight culture of E. coli BL21(DE3) transformed with the appropriate expression vector (either pKm6EF or pKmEF6) was used to inoculate 2 L of LB media containing kanamycin (50 μg/mL). The bacterial culture was grown at 37°C to OD600 = 0.4, and protein expression was then induced by addition of IPTG (Research Products International, Mt. Prospect, IL) to a final concentration of 1.0 mM. The culture was allowed to grow for an additional 4 hours. Cells were then harvested by centrifugation and stored in pellets (corresponding to 1 L of culture) at -20°C.
Protocols for protein purification were modified from protocols reported by Zhang [26]. To purify MazF(His)6, a MazE/MazF(His)6 expression pellet was thawed at room temperature and resuspended in 10 mL cold binding buffer (50 mM Tris-Cl, 300 mM NaCl, 10 mM imidazole, pH 8.0). Cells were subsequently lysed by sonication and lysate was centrifuged (35,000×g for 30 min). Subsequent steps of purification of MazEF from the supernatant were performed at 4°C. The protein complex was trapped on Ni-NTA resin by mixing 2 mL Qiagen NTA resin with the supernatant by inversion for 1 hour. Resin was then washed with 10 mL of binding buffer containing 8 M urea to disrupt the MazE-MazF interaction and remove MazE. This was followed with seven washes of 10 mL urea/binding buffer with the concentration of urea decreasing by 1 M each wash to slowly refold the protein on the column. The resin was then washed with 10 mL binding buffer and 10 mL wash buffer (50 mM Tris-Cl, 300 mM NaCl, 20 mM imidazole, pH 8.0). MazF(His)6 was eluted with 5 mL elution buffer (50 mM Tris-Cl, 300 mM NaCl, and 250 mM imidazole, pH 8.0) and the elution was collected in five 1 mL fractions. (His)6MazE was purified in an analogous fashion to that described above from (His)6MazE/MazF expression pellets.
Protein concentration was determined by Bradford assay. To enhance the accuracy of these concentration measurements, calibration curves were constructed for each protein by performing the Bradford assay on resolubilized lyophilized protein of known mass. As these calibration curves were used in future experiments to relate absorbance values from the Bradford assay to protein concentration, the Bradford assay was performed in exactly the same manner every time. To perform this assay, 60 μL water was added to 20 μL protein solution in a well of a 96-well plate. 20 μL Bradford assay dye (Bio-Rad Laboratories, Hercules, CA) was then added to the well and mixed by pipetting. The absorbance of the well at 595 nm was read exactly 10 minutes after addition of Bradford assay dye to the well. The calibration curves for MazE/MazF(His)6, (His)6MazE/MazF, MazF(His)6 and (His)6MazE are shown in Figure 1 of the Supporting Information. Elution fractions for both proteins were stored on ice for no more than two hours before they were used in experiments as a decrease in MazF(His)6 activity was observed with longer storage times.
HPLC analysis of oligonucleotide cleavage products
A 250 μL solution of 11.5 μM MazF(His)6 (or 3 μM MazE/MazF(His)6) and 24 μM chimeric oligonucleotide of the sequence 5′-AAGTCrGACATCAG-3′ in elution buffer were allowed to incubate for 5 hours at room temperature. The reaction mixture was subsequently flash frozen in liquid nitrogen. A 100 μL portion of each thawed reaction mixture was analyzed by HPLC using a Biocad Sprint liquid chromatograph (260 nm detector). An Xterra MS C18 column (10 mm × 50 mm, 2.5 μm; Waters Corporation, Milford, MA) was used to separate intact oligonucleotide from cleavage fragments with a linear gradient from 0.1 M triethylammonium acetate (TEAA) (pH 7.0) to 0.085 M TEAA/15% acetonitrile (pH 7.0) over 20 min. Fractions with A260 of greater than 0.01 were collected and lyophilized. Lyophilized oligonucleotide was resuspended in 100 μL RNase-free water and analyzed by MALDI mass spectrometry.
Fluorescence plate reader settings
Fluorescence was measured on a Criterion Analyst AD (Molecular Devices, Sunnyvale, CA) using a 485 ± 15 nm excitation filter, a 530 ± 15 nm emission filter, and a 505 nm cut-off dichroic mirror. The fluorophore was excited with a 1000 W continuous lamp with 10 reads per well.
Oligonucleotide cleavage assay
Wells of a black 384-well plate were filled with 5 μL of the 6-FAM and BHQ1 dually labeled fluorescent oligonucleotide in TE buffer and 10 μL cold elution buffer. Fluorescence of the filled wells was measured every 20 sec for 20 min, at which point 15 μL of either cold elution buffer or MazF was added. Fluorescence was subsequently measured every 20 seconds for 33.3 min.
Construction of calibration plot
Solutions containing a 1:1 (mol/mol) mixture of the labeled 5′- and 3′-cleavage fragments at concentrations of 0.3, 0.6, 1.5, 3.0, 6.0, and 9.0 μM were prepared by dilution with TE buffer. Wells of a black 384-well plate were filled with 5 μL of each solution and 10 μL cold elution buffer. Fluorescence of the filled wells was measured as described above. A 15 μL portion of cold elution buffer was added to each well after a 20 minute read. Fluorescence values at the 20 min timepoint (20 min after second elution buffer addition) were used to construct a calibration plot of relative fluorescence units (RFUs) against oligonucleotide fragment concentration. This experiment was repeated and a calibration plot was constructed for each plate read.
Kinetic analysis
Slopes derived from the MazF processing of the labeled substrate were compared to controls in which no enzyme was added. Data obtained for these controls (in which just elution buffer was added) was subtracted from that obtained for addition of MazF, and the difference was converted from relative fluorescence units to pmol oligonucleotide cleaved using the slope obtained from the calibration plot. Microsoft Excel was used to perform linear regression analysis on this data to obtain initial velocities for reactions involving MazF and a range of fluorescent oligonucleotides (0.05 μM – 50 μM). The initial velocities were plotted against substrate concentration and, using Kaleidagraph graphing software (Synergy Software), the Michaelis-Menten equation was fit to the data for oligonucleotide concentrations < 0.3 μM and > 20 μM.
MazE inhibition studies
Experiments were performed as described for the oligonucleotide cleavage assay for 20 μM fluorescent oligonucleotide substrate; however, in addition to preparing a reaction by adding MazF(His)6 alone to the elution buffer/oligonucleotide solution, another reaction was prepared by adding a mixture of separately purified (His)6MazE and MazF(His)6 to a final concentration of 1.5 μM and 3 μM, respectively. The MazE/MazF mixture was allowed to incubate on ice for 10 min before addition to the well. Data obtained was background subtracted as described above.
Ribonuclease inhibitor protein (RI) inhibition studies
Experiments were performed as described for MazE inhibition studies; however, a 2:1 (v/v) mixture of MazF(His)6 and Protector RNase Inhibitor (Roche, Nutley, NJ) was added to the oligonucleotide/elution buffer solution to a final concentration of 3 μM and 6.7 U/μL, respectively. The reaction involving MazF(His)6 alone was prepared in such a way that a 2:1 (v/v) mixture of MazF(His)6 and RI storage buffer (50 mM Hepes (pH 7.6), 20 mM potassium chloride, 8 mM DTT, 50% glycerol) was added to account for the effect of DTT and glycerol on reaction velocity.
Adenosine 3′,5′-diphosphate (pAp) inhibition studies
Experiments were performed as described for MazE inhibition studies. A solution of MazF(His)6 and pAp were added to the oligonucleotide/elution buffer solution to a final concentration of 3 μM and 1 mM, respectively.
High-throughput screen simulation
A 25 μL solution of 0.9 μM MazE/MazF(His)6 was delivered to all wells of a black 384-well plate, excluding wells in column 24 and wells M3, J7, G13, and C18. Column 24 was reserved for control reactions (25 μL elution buffer in A, B, and C; 25 μL 0.9 μM MazE/MazF(His)6 in wells D, E, and F; 25 μL of 3.6 μM MazF(His)6 in wells G, H, and I) and 25 μL of 3.6 μM MazF(His)6 was pipetted into each of the four remaining wells (M3, J7, G13, C18). Compounds from an in-house compound collection [27] were delivered to the first 23 columns of the plate via a pin-transfer device, and 5 μL fluorescent oligonucleotide substrate was added to each well to a final concentration of 12.5 nM. Immediately after substrate addition (t = 0), the fluorescence of each well was measured (ex = 485 nm; em = 530 nm). The plate was then allowed to incubate in the dark at room temperature for 2.5 hours. The fluorescence of the wells were then measured again, and the fluorescence values for the t = 0 read were subtracted from those obtained after 2.5 hours.
Results
Substrate design
Fluorogenic substrates have been used to analyze ribonuclease kinetics, substrate specificity [28], and inhibition [29-31]. These substrates are often chimeric, as they are composed of a single RNA base flanked by short (1 - 4 bases) sequences of DNA bases, and they are labeled on one end with a fluorophore and on the other end with a quencher. In an intact oligonucleotide, the fluorophore is in close proximity to the quencher and a low amount of fluorescence is observed. However, upon cleavage of the oligonucleotide the distance between fluorophore and quencher increases, resulting in an increase in observed fluorescence.
Short (7 - 15 bases) chimeric oligonucleotides have been designed to report on MazF activity, and cleavage of the 32P-labeled versions of these oligonucleotides by MazF has been demonstrated [23]. We used one such oligonucleotide of the sequence 5′-AAGTCrGACATCAG-3′ to design a fluorogenic MazF substrate by appending 6-carboxyfluorescein (6-FAM) to the 5′-end and Black Hole Quencher 1 (BHQ1) to the 3′-end (Figure 1). Cleavage of this oligonucleotide by MazF is indicated by an increase in fluorescent emission of 6-FAM at 530 nm and was assessed as described in the sections below.
Figure 1.
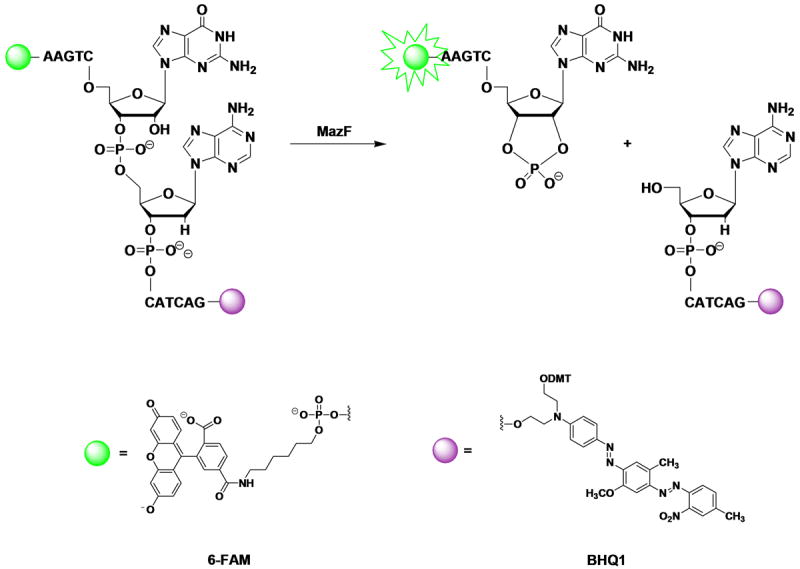
Substrate design. A chimeric DNA/RNA oligonucleotide (5′-AAGTCrGACATCAG-3′) previously shown to be cleaved by MazF was labeled with 6-carboxyfluorescein (6-FAM) on the 5′-end and with Black Hole Quencher 1 (BHQ1) on the 3′-end. When the oligonucleotide is intact, BHQ1 quenches the fluorescence of 6-FAM; however, cleavage of the oligonucleotide at the RNA base by MazF releases 6-FAM from BHQ1, thereby increasing the fluorescence of 6-FAM.
Construction of a calibration curve
A calibration curve relating fluorescence emission at 530 nm to the extent of oligonucleotide substrate cleavage is shown in Figure 2. Oligonucleotides of identical sequence and labeling to the fluorescent oligonucleotide substrate cleavage products (5′-6-FAM-AAGTCG-3′ and 5′-ACATCAG-BHQ1-3′) were purchased. For ease of synthesis, the RNA base of the 5′-cleavage fragment was replaced with the corresponding DNA base; however, this replacement is not expected to change the fluorescent properties of the cleavage fragment. The two oligonucleotide fragments were mixed in 1:1 molar ratios for various oligonucleotide concentrations to mimic cleavage reactions at various stages of completion and the fluorescence of the solutions were quantified by excitation at 485 nm and emission at 530 nm. The calibration curve was linear up to concentrations of 60 pmol (2 μM) cleaved oligonucleotide, and was constructed in parallel to each kinetic experiment.
Figure 2.
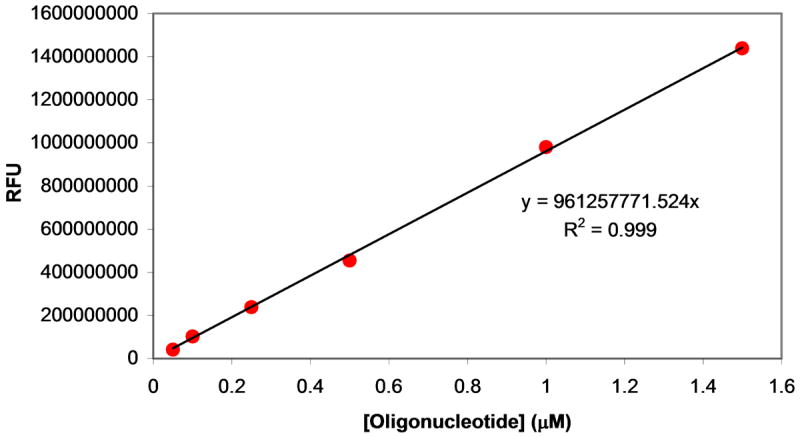
Construction of a calibration curve. Labeled oligonucleotides corresponding to products formed by cleavage of the fluorescently-labeled oligonucleotide substrate by MazF were mixed at 1:1 molar ratios for various concentrations. Fluorescence values for these 1:1 mixtures in elution buffer were measured upon excitation at 485 nm and emission at 530 nm allowing a calibration curve to be constructed that relates fluorescence to the amount of oligonucleotide cleaved. Calibration curves were linear up to 60 pmol (2 μM) of each cleavage fragment; a calibration curve was constructed in parallel with every experiment.
Kinetics of the MazF-mediated cleavage of the fluorescently-labeled chimeric substrate
The sensitivity of the fluorogenic substrate allowed us to study the reaction kinetics of oligonucleotide cleavage by MazF. Solutions of oligonucleotide (at final concentrations ranging from 0.1 – 50 μM) were prepared and distributed in the wells of a 384-well plate. MazF(His)6 was added to a final concentration of 3 μM, and the reaction progress was monitored by observing the fluorescence emission at 530 nm after excitation at 485 nm. Upon addition of elution buffer to oligonucleotide substrate, an initial increase in fluorescence was observed (see Figure 2A of the Supporting Information). This increase is not due to oligonucleotide cleavage, as the same effect was observed upon addition of elution buffer to 6-FAM alone (see Figure 2B of the Supporting Information). This increase leveled off after 15 minutes, therefore each data set was analyzed after this 15 minute time period elapsed, as shown in Figure 3A. Data for addition of elution buffer alone was then subtracted from that for addition of MazF to obtain reaction progress curves from which reaction velocities could be calculated. Reaction velocity increases with increasing substrate concentration, as shown in Figure 3B.
Figure 3.
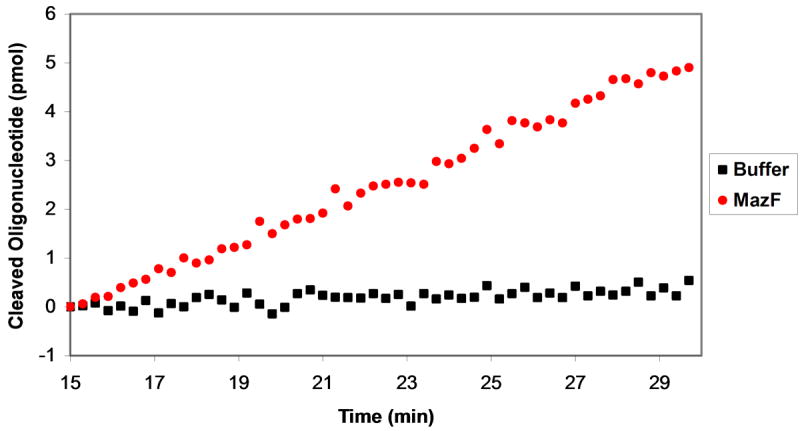
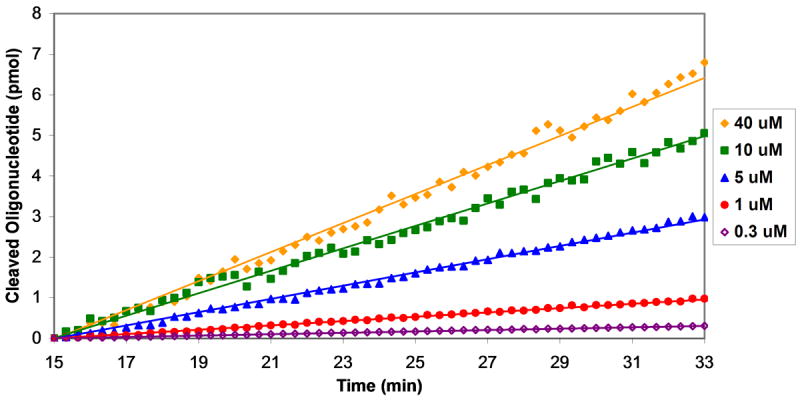
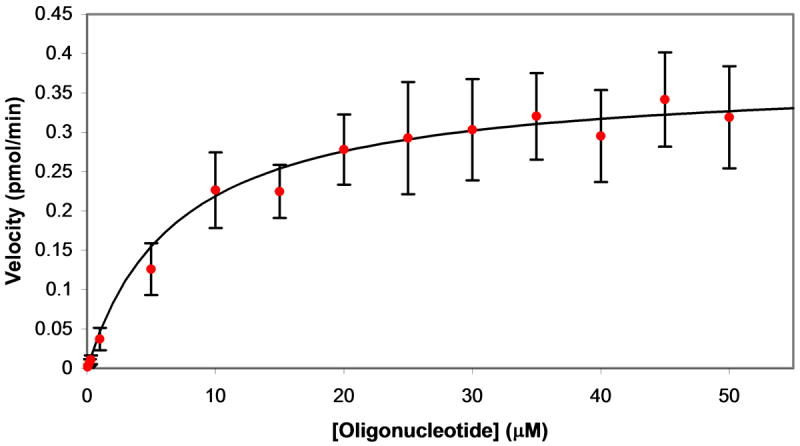
Determination of kinetic parameters for substrate cleavage by MazF. MazF (final concentration of 3 μM) was added to various concentrations of oligonucleotide substrate and fluorescence was monitored upon excitation at 485 nm and emission at 530 nm. A. Data analysis began 15 minutes after addition of MazF or elution buffer. The change in 6-FAM emission with reaction progress is shown for addition of MazF (red circles) and elution buffer (black squares) to a solution of 20 μM of the fluorescently-labeled chimeric substrate. Data for elution buffer addition was then subtracted from that for MazF addition and the resulting data were used to construct the plots shown in B. B. Linear regression analysis was performed on the background-subtracted data set for each oligonucleotide substrate concentration. Shown are data sets for substrate at 40 μM (filled yellow diamonds), 10 μM (filled green squares), 5 μM (filled blue triangles), 1 μM (filled red circles), and 0.3 μM (empty purple diamonds). C. The slopes from the data sets shown in B were plotted against oligonucleotide substrate concentration. Reaction velocities were determined for three separate batches of purified MazF and average velocities are plotted. Error bars represent the standard deviation from the mean. The Michaelis-Menten equation was fit to the data for substrate concentrations ≤ 0.3 μM and ≥ 20 μM; from the curve fit, Vmax = 0.37 ± 0.02 pmol/min, and KM = 6.9 ± 1.9 μM.
Reaction velocities were measured in this manner for three separate batches of purified MazF(His)6 (see Figure 3 of the Supporting Information for raw data from each of these three trials), and the average velocities were plotted against oligonucleotide substrate concentration (Figure 3C). The shape of the plotted data indicates that the cleavage reaction follows Michaelis-Menton kinetics; however, as 3 μM MazF(His)6 was used in each reaction, there are several reactions for which the oligonucleotide substrate concentration is less than or equal to enzyme concentration. Thus, standard kinetic analysis of enzymatic reactions dictate that the Michaelis-Menten equation could not be fit to the entire data set [32]. An equation similar to the Michael-Menten equation,
where KS is the dissociation constant for the enzyme/substrate complex, can be fit to data where the enzyme concentration is at least 10-fold greater than the substrate concentration [32]; therefore, this equation can be used to describe the MazF(His)6 reactions with oligonucleotide substrate of 0.3 μM or less. It has been shown that for enzymatic reactions with a low turnover number (kcat), KM is approximately equal to KS [33]; in this case the above equation is equivalent to the Michaelis-Menten equation. Analysis of the plotted data in Figure 3C indicated that the kcat for oligonucleotide cleavage by MazF was low, as a large concentration (3 μM) of MazF was required to achieve moderate values for Vmax. Thus, the Michaelis-Menten equation was fit to data for oligonucleotide concentrations of 0.3 μM and lower and 20 μM and higher. From the curve fit, Vmax = 0.37 ± 0.02 pmol/min, and KM = 6.9 ± 1.9 μM.
Analysis of the MazF cleavage of the chimeric substrate by liquid chromatography and mass spectrometry
To verify that the fluorescence increase observed upon incubation of MazF with oligonucleotide substrate is indeed due to cleavage by MazF, reaction products were analyzed by HPLC. A 24 μM solution of unlabeled oligonucleotide (5′-AAGTCrGACATCAG-3′) was incubated for 5 hours with either 1) 11.5 μM MazF(His)6 or, 2) 5.75 μM MazE plus 11.5 μM MazF(His)6 as a 2:4 complex. As shown in Figure 4, the HPLC trace of the oligonucleotide reaction with MazE/MazF(His)6 contained a single peak at retention time of 14.3 min, while the trace for the reaction with MazF(His)6 contained two peaks at lower retention times. Analysis of the elution fractions corresponding to each peak by MALDI mass spectrometry revealed that the peak at the longer retention time corresponded to m/z 3983.82, the mass of intact unlabeled oligonucleotide (see Figure 4A of the Supporting Information for mass spectrum). The peaks produced in the presence of MazF(His)6 correspond to m/z 1890.6 and 2088.7, the masses of the oligonucleotide fragments produced by MazF cleavage of the unlabeled oligonucleotide (see Figures 4B and 4C of the Supporting Information for mass spectra). The unlabeled oligonucleotide substrate is cleaved at the RNA base by MazF(His)6 in the absence but not in the presence of MazE (see Figure 4D of the Supporting Information for mass spectrum). Thus, we conclude that MazF cleaves labeled oligonucleotide substrate in a similar manner and that the increase in fluorescence observed in the presence of MazF is indeed a direct result of this cleavage event.
Figure 4.
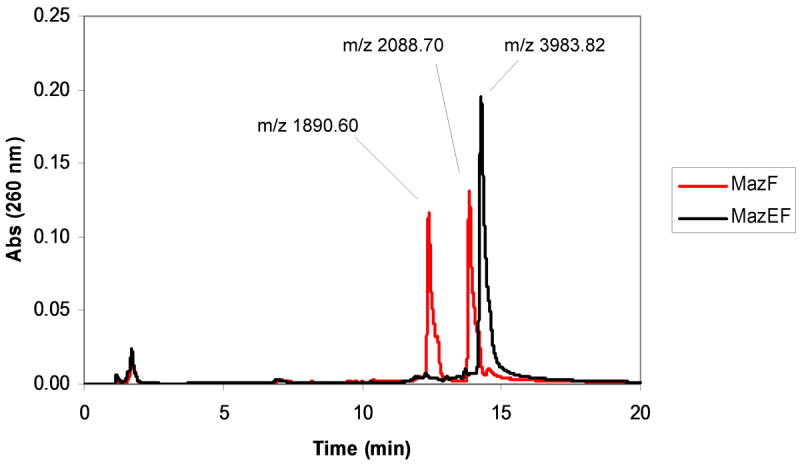
Verification of substrate cleavage by HPLC. Products from a 5 hour incubation of 24 μM unlabeled chimeric oligonucleotide (5′-AAGTCrGACATCAG-3′) with 11.5 μM MazF(His)6 in the presence (black) and absence (red) of 5.75 μM MazE were observed by HPLC analysis. Peak fractions were analyzed by MALDI mass spectrometry. The peak at longest retention time corresponds to intact oligonucleotide (calculated MW = 3983.6). The peaks at shorter retention times correspond to 5′- and 3′-fragments generated from MazF cleavage (calculated MW = 1894.2 and 2088.4, respectively).
The fluorescent substrate can be used to assess inhibitors of MazF
The assay was also used to investigate the effect of various ribonuclease inhibitors on MazF activity. The only reported inhibitor of MazF to date is MazE; thus, the effect of MazE on MazF cleavage of the fluorescent oligonucleotide substrate was investigated. As expected, the addition of 1.5 μM MazE abolishes the activity of 3 μM MazF against 20 μM oligonucleotide substrate (Figure 5A). Thus the fluorescent oligonucleotide substrate can be used to detect MazF inhibition.
Figure 5.
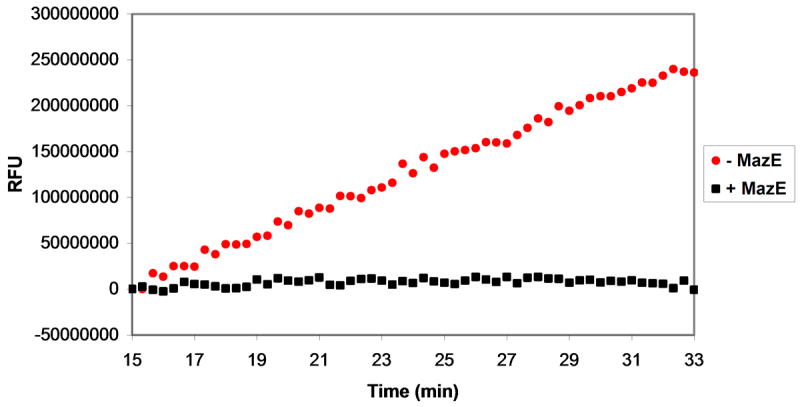
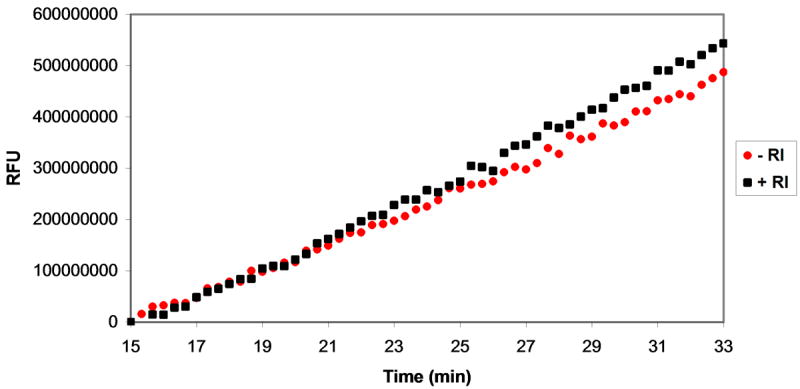
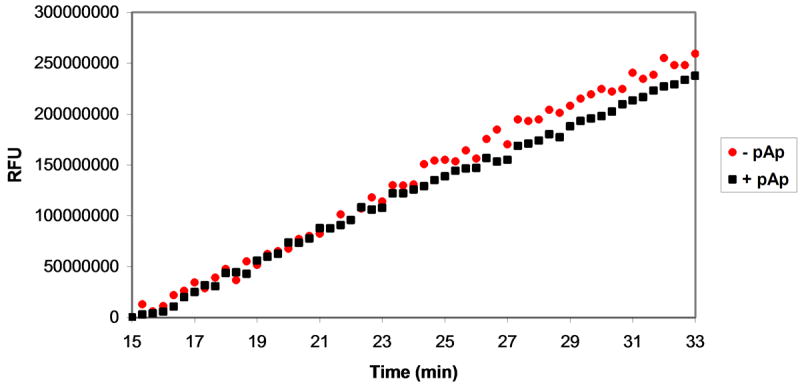
Assessment of MazF activity in the presence of ribonuclease inhibitors. Various ribonuclease inhibitors were added to MazF and elution buffer prior to their addition to oligonucleotide substrate. The effects of inhibitors on reaction velocity were monitored by fluorescence quantification by excitation at 485 nm and emission at 530 nm. A. A mixture of MazF and MazE was added to oligonucleotide substrate to final concentrations of 3 μM MazF and 1.5 μM MazE. Inhibition of MazF by MazE is indicated by the static fluorescence observed after MazF/MazE addition (black squares) in comparison to the increase in fluorescence observed after addition of MazF alone (red circles). B. A MazF/ribonuclease inhibitor (RI) solution was added to oligonucleotide substrate to final concentrations of 3 μM MazF and 200U RI. No inhibition of MazF by RI is observed as the fluorescence change of the oligonucleotide/MazF solution is the same in the presence and absence of RI. C. An experiment similar to that described in B was repeated for the RNaseA inhibitor, adenosine 3′,5′-diphosphate (pAp). Again, no inhibition of MazF by pAp is observed as the fluorescence change of the reaction solution is the same in the presence or absence of 1 mM pAp.
The products of oligonucleotide cleavage by MazF, most notably a 2′,3′-cyclic phosphodiester on the 3′-end of the 5′-fragment (Figure 1), have been shown to be similar to those observed upon oligonucleotide cleavage by RNaseA. It has therefore been suggested that MazF and RNaseA cleave RNA via a similar mechanism [23]. If this were true, one might expect that certain RNaseA inhibitors would also inhibit MazF. To test this, we incubated MazF with fluorescent oligonucleotide substrate in the presence of two RNaseA inhibitors, ribonuclease inhibitor protein (RI, 200 U) and adenosine 3′,5′-diphosphate (pAp, 1 mM) [34, 35]. Neither RNaseA inhibitor resulted in a decrease in velocity of the MazF/oligonucleotide substrate reaction (Figures 5B and 5C), thus neither inhibitor inhibits MazF to any appreciable extent at the concentrations evaluated.
The fluorescent substrate can be used as a reporter of MazEF disruption in a high-throughput screeen
The expression of MazF without MazE has been shown to reduce cell viability [36]; thus, it has been speculated that small molecule disruptors of the MazE-MazF complex could function as novel antibiotics [5]. The identification of such a small molecule disruptor could potentially be discovered via high-throughput screening of a large library of compounds. The fluorescent oligonucleotide substrate reported herein could be an integral component of such a screen, as the disruption of the MazE-MazF complex would release active MazF to cleave the substrate, resulting in an increase in fluorescence. To assess the utility of our fluorescent oligonucleotide substrate in this capacity, all but four wells of the first 23 columns of a black 384-well plate were filled with 25 μL of a MazE/MazF(His)6 solution; MazE:MazF form a 2:4 complex, thus the final concentrations in these solutions are 1.5 μM MazE, 3.0 μM MazF. The remaining four wells were filled with 25 μL of MazF(His)6 to a final concentration of 3.0 μM. Compounds from an in-house collection [27] were delivered to the plate via a pin-transfer device, and 5 μL substrate was then pipetted into all wells to a final concentration of 12.5 nM. Column 24 of the plate was reserved for controls. Three wells of this column were filled with 25 μL elution buffer, three wells were filled with 25 μL of the MazE/MazF(His)6 solution, and another three were filled with 25 μL of the MazF(His)6 solution. A 5 μL solution of the substrate was added to all wells of the 384-well plate, and after a 2.5 hour incubation at room temperature, the fluorescence (ex = 485 nm, em = 530 nm) of all wells was analyzed. Wells containing MazF were easily distinguishable from those containing MazE/MazF(His)6, indicating that a small molecule disruptor of the MazE/MazF complex would indeed be detectable using this substrate (Figure 6). It should be noted that very low concentrations (12.5 nM) of the substrate can be used in these experiments, making it practical on the large scale required for screening thousands of compounds.
Figure 6.
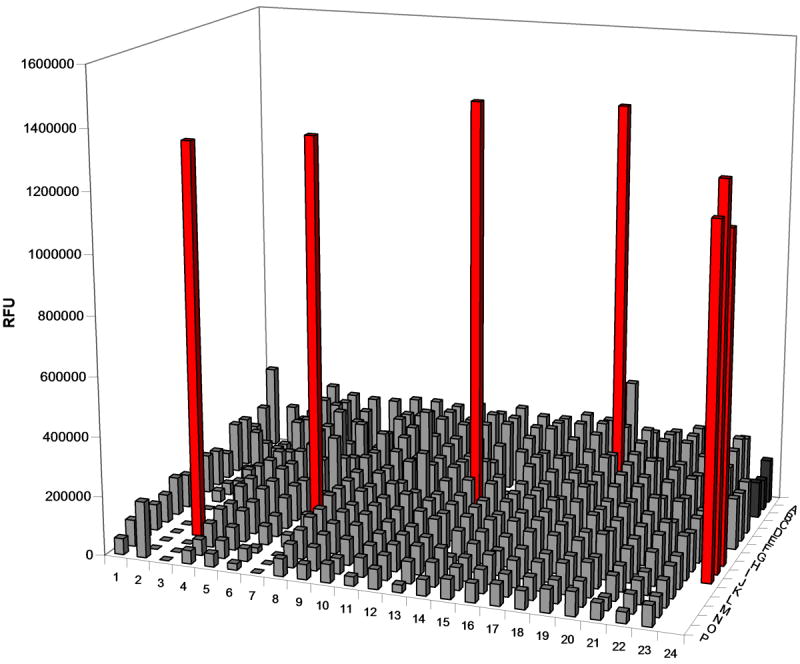
High-throughput screen simulation. A 12.5 nM solution of the fluorescently-labeled oligonucleotide substrate was incubated in wells of a 384-well plate filled with either MazE:MazF(His)6 (1.5 μM:3.0 μM) or MazF(His)6 (3 μM). Control wells were prepared in column 24 in which oligonucleotide was incubated in the absence of compound with elution buffer (dark grey), MazE:MazF(His)6 (1.5 μM:3.0 μM; light grey), and MazF(His)6 (red). After a 2.5 hr incubation, wells containing MazF(His)6 (M3, J7, G13, and C18) are easily distinguished from those that contain MazE/MazF(His)6. These results demonstrate that the fluorescent oligonucleotide substrate could be used to detect MazEF complex disruptors in a high-throughput screen.
Described herein is a simple and convenient method for the detailed assessment of MazF activity, and we have used this assay to determine a KM and Vmax for MazF. The assay can easily be performed in 384-well plates and can be run with commercially available materials. Interestingly, two common ribonuclease inhibitors (ribonuclease inhibitor protein and pAp) do not inhibit the MazF-catalyzed reaction. As MazEF appears to be part of a larger family of toxin-antitoxin systems [37], this assay should be useful for the study of the entire family of MazEF-like proteins. Through use of this assay, unresolved questions about the substrate specificity of MazF can now be answered in a facile manner, and the novel substrate reported herein should also facilitate high-throughput screens aimed at the identification of MazF inhibitors or MazE-MazF disruptors.
Supplementary Material
Supporting Information. Bradford assay calibration curves, raw kinetic data, complete kinetic data used to determine KM and Vmax for MazF cleavage of the described substrate, and MALDI mass spectra of oligonucleotide cleavage products can be found in the supporting information.
Acknowledgments
This work was supported by the National Institutes of Health (R01-GM68385) and the Office of Naval Research (N00014-02-1-0390). N.R.W. was supported through the Department of Homeland Security (DHS) Scholarship and Fellowship Program.
Footnotes
Publisher's Disclaimer: This is a PDF file of an unedited manuscript that has been accepted for publication. As a service to our customers we are providing this early version of the manuscript. The manuscript will undergo copyediting, typesetting, and review of the resulting proof before it is published in its final citable form. Please note that during the production process errors may be discovered which could affect the content, and all legal disclaimers that apply to the journal pertain.
References
- 1.Zielenkiewicz U, Ceglowski P. Mechanisms of plasmid stable maintenance with special focus on plasmid addiction systems. Acta Biochim Pol. 2001;4:1003–1023. [PubMed] [Google Scholar]
- 2.Gerdes K, Christensen SK, Lobner-Olesen A. Prokaryotic toxin-antitoxin stress response loci. Nat Rev Microbiol. 2005;5:371–382. doi: 10.1038/nrmicro1147. [DOI] [PubMed] [Google Scholar]
- 3.Hayes F. Toxins-antitoxins: plasmid maintenance, programmed cell death, and cell cycle arrest. Science. 2003;5639:1496–1499. doi: 10.1126/science.1088157. [DOI] [PubMed] [Google Scholar]
- 4.Pandey DP, Gerdes K. Toxin-antitoxin loci are highly abundant in free-living but lost from host-associated prokaryotes. Nucleic Acids Res. 2005;3:966–976. doi: 10.1093/nar/gki201. [DOI] [PMC free article] [PubMed] [Google Scholar]
- 5.Moritz EM, Hergenrother PJ. Toxin-antitoxin systems are ubiquitous and plasmid-encoded in vancomycin-resistant enterococci. Proc Natl Acad Sci U S A. 2007;1:311–6. doi: 10.1073/pnas.0601168104. [DOI] [PMC free article] [PubMed] [Google Scholar]
- 6.Gerdes K, Rasmussen PB, Molin S. Unique type of plasmid maintenance function: postsegregational killing of plasmid-free cells. Proc Natl Acad Sci. 1986;10:3116–3120. doi: 10.1073/pnas.83.10.3116. [DOI] [PMC free article] [PubMed] [Google Scholar]
- 7.Yarmolinsky MB. Programmed cell death in bacterial populations. Science. 1995;5199:836–837. doi: 10.1126/science.7846528. [DOI] [PubMed] [Google Scholar]
- 8.Jensen RB, Gerdes K. Programmed cell death in bacteria: proteic plasmid stabilization systems. Mol Microbiol. 1995;2:205–210. doi: 10.1111/j.1365-2958.1995.mmi_17020205.x. [DOI] [PubMed] [Google Scholar]
- 9.Hazan R, Sat B, Engelberg-Kulka H. Escherichia coli mazEF-mediated cell death is triggered by various stressful conditions. J Bacteriol. 2004;11:3663–3669. doi: 10.1128/JB.186.11.3663-3669.2004. [DOI] [PMC free article] [PubMed] [Google Scholar]
- 10.Sat B, Reches M, Engelberg-Kulka H. The Escherichia coli mazEF suicide module mediates thymineless death. J Bacteriol. 2003;6:1803–1807. doi: 10.1128/JB.185.6.1803-1807.2003. [DOI] [PMC free article] [PubMed] [Google Scholar]
- 11.Sat B, Hazan R, Fisher T, Khaner H, Glaser G, Engelberg-Kulka H. Programmed cell death in Escherichia coli: some antibiotics can trigger mazEF lethality. J Bacteriol. 2001;6:2041–2045. doi: 10.1128/JB.183.6.2041-2045.2001. [DOI] [PMC free article] [PubMed] [Google Scholar]
- 12.Christensen SK, Mikkelsen M, Pedersen K, Gerdes K. RelE, a global inhibitor of translation, is activated during nutritional stress. Proc Natl Acad Sci. 2001;25:14328–14333. doi: 10.1073/pnas.251327898. [DOI] [PMC free article] [PubMed] [Google Scholar]
- 13.Christensen SK, Pedersen K, Hansen FG, Gerdes K. Toxin-antitoxin loci as stress-response-elements: ChpAK/MazF and ChpBK cleave translated RNAs and are counteracted by tmRNA. J Mol Biol. 2003;4:809–819. doi: 10.1016/s0022-2836(03)00922-7. [DOI] [PubMed] [Google Scholar]
- 14.Alekshun MN, Levy SB. Molecular mechanisms of antibacterial multidrug resistance. Cell. 2007;6:1037–1050. doi: 10.1016/j.cell.2007.03.004. [DOI] [PubMed] [Google Scholar]
- 15.Moritz EM, Hergenrother PJ. The prevalence of plasmids and other mobile genetic elements in clinically important drug-resistant bacteria. Horizon bioscience; 2007. [Google Scholar]
- 16.Engelberg-Kulka H, Sat B, Reches M, Amitai S, Hazan R. Bacterial programmed cell death systems as targets for antibiotics. Trends Microbiol. 2004;2:66–71. doi: 10.1016/j.tim.2003.12.008. [DOI] [PubMed] [Google Scholar]
- 17.DeNap JC, Hergenrother PJ. Bacterial death comes full circle: targeting plasmid replication in drug-resistant bacteria. Org Biomol Chem. 2005;6:959–966. doi: 10.1039/b500182j. [DOI] [PubMed] [Google Scholar]
- 18.Metzger S, Dror IB, Aizenman E, Schreiber G, Toone M, Friesen JD, Cashel M, Glaser G. The nucleotide sequence and characterization of the relA gene of Escherichia coli. J Biol Chem. 1988;30:15699–15704. [PubMed] [Google Scholar]
- 19.Masuda Y, Miyakawa K, Nishimura Y, Ohtsubo E. chpA and chpB, Escherichia coli chromosomal homologs of the pem locus responsible for stable maintenance of plasmid R100. J Bacteriol. 1993;21:6850–6856. doi: 10.1128/jb.175.21.6850-6856.1993. [DOI] [PMC free article] [PubMed] [Google Scholar]
- 20.Kamada K, Hanaoka F, Burley SK. Crystal structure of the MazE/MazF complex: molecular bases of antidote-toxin recognition. Mol Cell. 2003;4:875–884. doi: 10.1016/s1097-2765(03)00097-2. [DOI] [PubMed] [Google Scholar]
- 21.Engelberg-Kulka H, Hazan R, Amitai S. mazEF: a chromosomal toxin-antitoxin module that triggers programmed cell death in bacteria. J Cell Sci. 2005:4327–4332. doi: 10.1242/jcs.02619. [DOI] [PubMed] [Google Scholar]
- 22.Engelberg-Kulka H, Amitai S, Kolodkin-Gal I, Hazan R. Bacterial programmed cell death and multicellular behavior in bacteria. PLoS Genet. 2006;10:e135. doi: 10.1371/journal.pgen.0020135. [DOI] [PMC free article] [PubMed] [Google Scholar]
- 23.Zhang Y, Zhang J, Hara H, Kato I, Inouye M. Insights into the mRNA cleavage mechanism by MazF, an mRNA interferase. J Biol Chem. 2005;5:3143–3150. doi: 10.1074/jbc.M411811200. [DOI] [PubMed] [Google Scholar]
- 24.Zhang Y, Zhang J, Hoeflich KP, Ikura M, Qing G, Inouye M. MazF cleaves cellular mRNAs specifically at ACA to block protein synthesis in Escherichia coli. Mol Cell. 2003;4:913–923. doi: 10.1016/s1097-2765(03)00402-7. [DOI] [PubMed] [Google Scholar]
- 25.Munoz-Gomez AJ, Santos-Sierra S, Berzal-Herranz A, Lemonnier M, Diaz-Orejas R. Insights into the specificity of RNA cleavage by the Escherichia coli MazF toxin. FEBS Lett. 2004;2-3:316–320. doi: 10.1016/j.febslet.2004.05.005. [DOI] [PubMed] [Google Scholar]
- 26.Zhang Y, Zhang J, Hoeflich KP, Ikura M, Qing G, Inouye M. MazF cleaves cellular mRNAs specifically at ACA to block protein synthesis in Escherichia coli. Mol Cell. 2003;4:913–23. doi: 10.1016/s1097-2765(03)00402-7. [DOI] [PubMed] [Google Scholar]
- 27.Hergenrother PJ. Obtaining and screening compound collections: a user's guide and a call to chemists. Curr Opin Chem Biol. 2006;3:213–8. doi: 10.1016/j.cbpa.2006.04.005. [DOI] [PubMed] [Google Scholar]
- 28.Park C, Kelemen BR, Klink TA, Sweeney RY, Behlke MA, Eubanks SR, Raines RT. Fast, facile, hypersensitive assays for ribonucleolytic activity. Methods Enzymol. 2001:81–94. doi: 10.1016/s0076-6879(01)41146-3. [DOI] [PubMed] [Google Scholar]
- 29.Bretscher LE, Abel RL, Raines RT. A ribonuclease A variant with low catalytic activity but high cytotoxicity. J Biol Chem. 2000;14:9893–9896. doi: 10.1074/jbc.275.14.9893. [DOI] [PubMed] [Google Scholar]
- 30.Kelemen BR, Klink TA, Behlke MA, Eubanks SR, Leland PA, Raines RT. Hypersensitive substrate for ribonucleases. Nucleic Acids Res. 1999;18:3696–3701. doi: 10.1093/nar/27.18.3696. [DOI] [PMC free article] [PubMed] [Google Scholar]
- 31.Klink TA, Raines RT. Conformational stability is a determinant of ribonuclease A cytotoxicity. J Biol Chem. 2000;23:17463–17467. doi: 10.1074/jbc.M001132200. [DOI] [PubMed] [Google Scholar]
- 32.Schnell S, Maini PK. A century of enzyme kinetics: reliability of the Km and Vmax estimates. Comments on Theoretical Biology. 2003:169–187. [Google Scholar]
- 33.Segel IH. Enzyme Kinetics: Behavior and Analysis of Rapid Equilibrium and Steady State Enzyme Systems. Wiley; New York: 1975. [Google Scholar]
- 34.Russo N, Shapiro R, Vallee BL. 5′-Diphosphoadenosine-3′-Phosphate is a potent inhibitor of bovine pancreatic ribonuclease A. Biochem Biophys Res Commun. 1997:671–674. doi: 10.1006/bbrc.1997.6167. [DOI] [PubMed] [Google Scholar]
- 35.Yakovlev GI, Mitkevich VA, Makarov AA. Ribonuclease inhibitors. Mol Biol. 2006;6:867–874. [Google Scholar]
- 36.Kolodkin-Gal I, Engelberg-Kulka H. Induction of Escherichia coli chromosomal mazEF by stressful conditions causes an irreversible loss of viability. J Bacteriol. 2006;9:3420–3423. doi: 10.1128/JB.188.9.3420-3423.2006. [DOI] [PMC free article] [PubMed] [Google Scholar]
- 37.Mittenhuber G. Occurrence of mazEF-like antitoxin/toxin systems in bacteria. J Mol Microbiol Biotechnol. 1999;2:295–302. [PubMed] [Google Scholar]
Associated Data
This section collects any data citations, data availability statements, or supplementary materials included in this article.
Supplementary Materials
Supporting Information. Bradford assay calibration curves, raw kinetic data, complete kinetic data used to determine KM and Vmax for MazF cleavage of the described substrate, and MALDI mass spectra of oligonucleotide cleavage products can be found in the supporting information.


