

Abstract
Objective
To examine prospective changes in cardiovascular disease (CVD) and type-2 diabetes risk factors in young adult first episode psychotic (FEP) patients treated with second generation antipsychotic medications.
Methods
At baseline, fasting serum and anthropometric measures were obtained from 45 FEP patients and 41 healthy adults (controls) of similar age, ethnicity and sex; sixteen of the FEP patients remained on the same antipsychotic medication and were available for a second blood draw at 24 weeks of treatment. Serum was assayed for glucose, insulin, triglycerides, total cholesterol and high and low density lipoproteins (HDL, LDL), adiponectin, leptin, interleukin 6, E-selectin and VCAM-1. Wilcoxon nonparametric tests were used to compare risk markers between the FEP and control group at baseline and to evaluate pre-post treatment changes within the FEP group.
Results
At baseline, the distributions of risk marker values were similar between the two groups and the percentages of FEP patients and healthy controls who were overweight/obese, dyslipidemic, hyperglycemic, and hyperinsulinemic did not differ. At 24 weeks, compared to baseline, FEP patients showed significant increases in BMI (p=0.0002), glucose (p=0.0449), insulin (p=0.0161), cholesterol (p=0.0129), leptin (p=0.0215), and E-selectin (p=0.0195), and a decrease in adiponectin (p=0.0371).
Conclusions
Among patients with first episode psychosis, 6-month treatment with second generation antipsychotics is associated with the exacerbation of pre-existing and emergence of new CVD and diabetes risk factors.
Keywords: atypical antipsychotic, first episode psychosis, cardiovascular disease, diabetes, inflammation, cell adhesion, metabolism
1. Introduction
Compared to the general population, people with schizophrenia have increased risks of developing cardiovascular disease (CVD) and type 2 diabetes (T2DM) (Brown et al., 2000; Ryan and Thakore, 2002; Susce et al., 2005), and their life expectancy is shorter by 15 years primarily because of coronary heart disease (Hennekens et al., 2005). Two important factors contributing to this increased morbidity and mortality are inherent susceptibility and antipsychotic medication side effects.
A link between metabolic abnormalities (i.e., high blood glucose and abnormal glucose tolerance) and psychotic illness was recognized in the pre-antipsychotic era (reviewed by Kohen, 2004). Some (Ryan et al., 2003) but not all (Arranz et al., 2004, Zhang et al., 2004a) more recent studies have confirmed this finding. Reasons for elevated glucose parameters in psychotic illness may include unhealthy lifestyle (Zhang et al., 2004a; McEvoy and Brown, 1999; Ryan et al., 2004) in the early stages of schizophrenia as well as genetic factors: diabetes occurs in up to 30% of the relatives of those with schizophrenia (Mukherjee et al., 1989).
An association between antipsychotic medication use and metabolic dysregulation has also been suspected for many years, based on a series of published case reports describing increased rates of diabetes (Charatan and Bartlett, 1995; Hiles, 1956; Dynes, 1969) in patients taking chlorpromazine, and on inpatient studies showing that the rate of diabetes in female psychiatric inpatients rose from roughly 4% to 17% between 1956 and 1968, as antipsychotic use increased (Thonnard-Neumann, 1968). In the last decade it has become very clear that many second-generation antipsychotic (SGA) medications also have the propensity to cause significant weight gain in very short amounts of time and to adversely affect glucose metabolism. Clozapine and olanzapine have consistently been identified as having the greatest weight gain liability, followed by risperidone and quetiapine with intermediate weight gain, and then ziprasidone, haldol, molindone, and aripiprazole with minimal weight gain on average (Allison et al., 1999b; Christensen et al., 2006; Lieberman et al., 2005l; Marder et al., 2003; Wirshing et al., 1999). Consistent with their high weight gain profile, clozapine and olanzapine are also thought to be the two medications most likely associated with glucose dysregulation (reviewed in Jin et al., 2004).
Individuals with chronic schizophrenia have high rates of overweight and obesity (Susce et al., 2005; Homel et al., 2002), but it is not known whether they are heavier than the general adult population. One analysis, based on 1989 National Health Interview Survey data (i.e., from the pre-SGA era), found similar BMI distribution for men with and without schizophrenia, but that women with schizophrenia had a statistically and clinically significantly higher mean BMI compared to women without this illness (Allison et al., 1999a). In the same paper, comparison of BMI from a large group of schizophrenia clinical trial subjects with BMI data from the National Health and Nutrition Examination Survey III showed similar albeit non-significant trends. However, the results of these analyses may have been biased because some patients with very low or very high BMI, as well as those with significant medical illness, were excluded. Efforts to study this phenomenon in patients who are drug naïve or early in treatment compared to age- and sex-matched controls have been limited and yielded mixed results: some (Thakore et al., 2002) but not all (Ryan et al., 2004; Zhang et al., 2004a) studies found higher BMI in patients, and some (Ryan et al., 2004; Thakore et al., 2002) but not all (Zhang et al., 2004a) studies found higher intra-abdominal fat (IAF) in patients.
The finding of higher IAF in SGA-treated patients is of interest because of the association between abdominal obesity and higher levels of the proinflammatory adipokines (leptin, interleukin 6 [IL-6], C-reactive protein, and tumor necrosis factor) and less secretion of the protective adipokine, adiponectin. These proinflammatory agents are thought to induce oxidative stress thereby exacerbating underlying pathological processes leading to dyslipidemia, glucose intolerance, insulin resistance, and endothelial dysfunction that are common in obesity and type II diabetes mellitus (T2DM) (Sonnenberg et al., 2004). Previous cross-sectional studies found both higher (Togo et al., 2004) and lower (Richards et al., 2006) adiponectin levels in patients treated with olanzapine compared to healthy controls as well as lower levels in untreated patients compared to controls (Cohn et al., 2006). One additional study found no change in adiponectin after 4 weeks of olanzapine treatment (Hosojima et al., 2006). Similarly, IL-6 levels were elevated in patients with schizophrenia compared to controls but appeared unchanged after 12 weeks of risperidone treatment (Zhang et al., 2004b). Our study extends this work by prospectively evaluating changes in adiponectin, IL-6, and other important risk markers in patients early in treatment who received SGAs for a longer duration (approximately six months).
Here, we investigated laboratory cardiovascular disease (CVD) and T2DM risk markers in first episode psychosis patients who are either antipsychotic naïve or have had only short exposure to antipsychotics. Sixteen of the patients remained on the same antipsychotic medication for 6 months, and so a second assessment of risk markers was completed in this subgroup. The markers under investigation include fasting glucose, insulin, and lipid panel, as well as novel risk markers including leptin, adiponectin, and IL-6, and the cellular adhesion molecules associated with T2DM risk, E-selectin and VCAM-1. These same markers were assayed in a comparison group of physically and mentally healthy subjects of similar age, ethnicity, gender and BMI for baseline comparison.
2. Experimental/Materials and methods
2.1. Subjects
Between June 2001 and April 2005, blood from 45 patients experiencing a first episode of psychosis (FEP) and from 41 healthy control subjects was drawn, processed, and frozen for later use. Patients were recruited from inpatient wards and outpatient clinics of The University of North Carolina at Chapel Hill Hospitals or Dorothea Dix State Psychiatric Hospital in Raleigh, North Carolina. Fifteen of the 45 recruited patients were antipsychotic naïve at the time of first blood draw, while 12 had less then 2 weeks exposure, eight had 2 to 4 weeks exposure, and 10 had between 4 and 16 weeks exposure to antipsychotic medication. Seven patients were inpatients at the time of baseline evaluation. Of those patients already on medication at baseline assessment, 18 were on risperidone, eight were on olanzapine, one was on quetiapine, one was on a combination of olanzapine and quetiapine, and two were on aripiprazole. The FEP subjects were not on any other medication known to effect weight (lithium, depakote, mirtazepine, stimulants, or weight loss medications). Healthy control subjects were recruited through advertisements posted on bulletin boards in Chapel Hill and Durham, North Carolina. Healthy subjects were screened by both a clinical social worker and a psychiatrist and could have no known psychiatric or medical illness, and were between the ages of 16 and 40. Healthy subjects were not matched to the patient population. All subjects consented to having blood drawn and stored as approved by the UNC Investigational Review Board. Approximately 6 months after the initiation of antipsychotic medication treatment, blood from 16 of the patient subjects was again drawn, processed, frozen and stored for later use. Reasons for subject dropout between baseline and follow up were change in antipsychotic medication (n=13), patient stopped antipsychotic against medical advice (n=11), relocation (n=3), patient lost to follow-up (n=1) and patient unwilling to have blood drawn (n=1). Sample size for individual assays ranged from 10 to 14 however, due to research personnel error, or insufficient quantity of blood drawn to run all assays. The median time to follow-up was 174 days. Of these 16 patients, none of whom switched antipsychotic medications during the study period: nine were on risperidone, four were on olanzapine, two were on quetiapine, and one was on aripiprazole.
2.2. General Methods
Height was measured using a wall mounted stadiometer. Weight was measured on a digital scale that was calibrated monthly with subjects wearing one layer of light clothing and no shoes. BMI was calculated by weight in kg/height (in meters2) for all subjects where both height and weight were available (41 FEP subjects and 34 controls).
Subjects were requested both orally and with written notice of the need to fast for at least 10 hours before bloodwork. Additionally, subjects were called the day before scheduled blood draw as a reminder to fast overnight. On the morning of the bloodwork, subjects were asked if they had anything to eat or drink for the previous 10 hours. If they had anything other than water and their medication, bloodwork was rescheduled. Blood was collected in BD vacutainer SST tubes and then spun for 10 min (25° C, 3000 rpm); the serum was stored at −80° C. Fasting levels for glucose, cholesterol (total), HDL and triglycerides were all processed on the VITROS 5,1 FS Chemistry platform (OrthoClinical Diagnostics) in McLendon Clinical Laboratory at UNC Hospital on serum specimens. Low-density lipoprotein (LDL) cholesterol was estimated using the calculation: LDL = total cholesterol – [HDL – (triglycerides/5)] (Friedewald et al., 1972). Blood for these tests was assayed on the day of the blood draw. The Clinical Nutrition Research Center of UNC Chapel Hill performed the enzyme-linked immunosorbent assays for sE-Selectin, sVCAM-1, IL-6, leptin, adiponectin, (R&D Systems, Inc.) and insulin (Linco Research) as directed by the manufacturers, in a single batch. The Qualitative Insulin Sensitivity Check Index (QUICKI) method was used to estimate insulin sensitivity (Katz et al., 2000).
2.3. Statistical Methods
The Fisher’s Exact Test was used to compare ethnicity distributions between patient and control groups. Chi-square Test was used to compare gender distributions between patient and control groups The Mean Score Test was used to compare the BMI categorical distributions between patient and control groups. Due to small sample sizes and non-normal distributions for some of the variables, nonparametric tests were used to compare risk markers between groups (Wilcoxon Rank Sum Test) at baseline as well as to evaluate pre-post treatment changes in each risk marker within the patient group (Wilcoxon Signed Rank Test and Sign Test). Associations between BMI and lab values were evaluated using Spearman Rank Correlations. Computations were performed using SAS software (v. 9.1, SAS Institute, Cary, NC), and a p-value less than 0.05 was considered statistically significant. Given the exploratory nature of this study, p-values were not adjusted for the multiple testing and should be viewed with appropriate caution.
3. Results
3.1. Subject Characteristics at Baseline
3.1.1 Comparison of Patient Group to Healthy Control Group
Mean patient age was 23.33 year (SD 6.07) and mean healthy control age was 25.39 (SD 5.55), giving a borderline significant p value of p=0.0530. Thirty-three percent of the patient group were female compared to 46 % of the control group (p = 0.2178). 82.22 % of the patients were Caucasian, while 15.56 were African American and 2.22 % were Asian. This was not statistically different from the Healthy Control Group (70.7% Caucasian, 29.3% African American and no Asians). Mean BMI was also not significantly different. (Table 1).
Table 1.
Baseline Sample Characteristics for All Subjects
| Patient Group (n=45) | Control Group (n=41) | ||||
|---|---|---|---|---|---|
| Mean (SD) or % | n | Mean (SD) or % | n | p-value | |
| Age (years) | 23.33 (6.07) | 45 | 25.39 (5.55) | 41 | 0.0530 |
| Sex – % female | 33 | 15 | 46 | 19 | 0.2178 |
| Ethnicity | 0.1927 | ||||
| % Caucasian | 82.22 | 37 | 70.73 | 29 | |
| % AA | 15.56 | 7 | 29.27 | 12 | |
| % Asian | 2.22 | 1 | 0 | 0 | |
| BMI (kg/m2) | 24.29 (4.06) | 43 | 25.64 (4.64) | 34 | 0.1775 |
| Weight Classification | 0.3344 | ||||
| Under (BMI < 18.5) | 2.33 | 1 | 2.94 | 1 | |
| Normal (BMI 18.5–24.9) | 55.81 | 24 | 44.12 | 15 | |
| Over (BMI 25–29.9) | 32.56 | 14 | 38.24 | 13 | |
| Obese (BMI > 30) | 9.30 | 4 | 14.71 | 5 | |
3.1.2 Comparison of Longitudinal Group of Patients to Patients with only Baseline Data
Sixteen of the 45 patient subjects remained on the same medication and were available to have a second blood draw. There were no significant differences between the group followed longitudinally and those with only baseline measurement with respect to ethnicity (p =0.8017), gender distribution (p=0.3312), range of BMI (p=0.6303) and the percentage who were drug free at baseline (p=0.7463).
3.1.3 Baseline comparison of Drug Naïve Patients to Patients on Medication
Fifteen patient subjects were drug naïve at baseline and 30 were taking an antipsychotic medication. Of those taking medication, 12 had less then 2 weeks exposure, eight had 2 to 4 weeks exposure, and 10 had between 4 and 16 weeks exposure to antipsychotic medication. There were no significant differences between these groups with respect to ethnicity (p =0.3583), gender distribution (p=0.7384), or range of BMI (p=0.4593). Additionally, there were no significant differences in any of the lab values.
3.2. Risk Markers at Baseline
3.2.1 Comparison of Patient Group to Healthy Control Group
At baseline, many FEP subjects already displayed several of the usual risk factors for CVD and diabetes, but did not differ substantially in these respects from the healthy controls: overweight or obese: patients = 41.9%, controls = 52.9% (p > 0.36); elevated cholesterol: patients = 28.6%, controls = 25.0% (p > 0.80); elevated triglycerides: patients = 16.7%, controls = 13.9% (p > 0.76); elevated LDL: patients = 21.4%, controls = 22.2% (p > 0.99); low HDL: patients = 19.0%, controls = 2.8% (p > 0.03); elevated insulin: patients = 9.3%, controls = 4.9% (p > 0.67); elevated glucose: patients = 2.5%, controls = 0.0% (p > 0.99). As displayed in Table 2, the distributions of demographic characteristics and risk markers did not differ between patients and controls at baseline with the exception of glucose: the median and interquartile range for glucose were higher in patients than controls (p < 0.05).
Table 2.
Comparison of CVD and Diabetes Risk Markers Distributions at Baseline for FEP and Control Groups
| Patient Group (n=45) | Control Group (n=41) | ||||||
|---|---|---|---|---|---|---|---|
| Mean (SD) | Median | Interquartile Range | Mean (SD) | Median | Interquartile Range | P-value | |
| BMI (kg/m2) | 24.29 (4.06) | 23.56 | 20.90 to 27.02 | 25.64 (4.64) | 25.26 | 21.42 to 28.59 | 0.1661 |
| Triglycerides (mg/dl) | 107.12 (55.23) | 94 | 66 to 117 | 93.22 (47.28) | 69 | 59.5 to 119.5 | 0.2138 |
| Cholesterol (mg/dl) | 178.79 (39.39) | 173 | 150 to 212 | 174.11 (34.26) | 166.5 | 156 to 195.5 | 0.7144 |
| LDL (mg/dl) | 104.67 (34.79) | 103 | 80 to 124 | 102.39 (29.29) | 93 | 82 to 121.5 | 0.7713 |
| HDL (mg/dl) | 52.69 (15.44) | 49.5 | 43 to 59 | 55.36 (18.11) | 52.5 | 46 to 58.5 | 0.4311 |
| Glucose (mg/dl) | 85.34 (8.09) | 85 | 82 to 88.5 | 81.92 (6.65) | 83 | 77 to 85 | 0.0467 |
| Insulin (µU/ml) | 6.82 (7.2) | 5 | 3.5 to 7 | 5.5 (3.38) | 4.8 | 3.1 to 6.7 | 0.7438 |
| QUICKI | 0.39 (0.04) | 0.38 | 0.36 to 0.41 | 0.39 (0.04) | 0.39 | 0.36 to 0.43 | 0.5195 |
| Adiponectin (µg/ml) | 10.27 (5.73) | 10.10 | 5.46 to 12.85 | 9.08 (4.50) | 7.86 | 5.52 to 12.77 | 0.5692 |
| Leptin (pg/ml) | 10756.33 (13504.03) | 5716.5 | 1711 to 14821 | 9081.54 (10022.03) | 6544 | 2604 to 13605 | 0.9125 |
| Interleukin 6 (pg/ml) | 1.70 (1.65) | 1.19 | 0.8 to 2.01 | 1.73 (1.63) | 1.16 | 0.79 to 2.00 | 0.8483 |
| VCAM-1 (ng/ml) | 517.93 (142.31) | 487.5 | 431 to 571 | 561.29 (150.93) | 516 | 472 to 601 | 0.0851 |
| E-selectin (ng/ml) | 31.64 (13.48) | 31.89 | 22.35 to 42 | 30.29 (17.98) | 25.77 | 20.05 to 40.18 | 0.3389 |
Note: Sample size used for the analysis is smaller for some of the risk makers due to the missing values.
3.2.2 Comparison of Longitudinal Group of Patients to Patients with only Baseline Data
There were no significant differences in baseline risk marker results other then fasting glucose, which was significantly lower in the group of 16 followed longitudinally (82.6 +− 11.31) compared to the group (n=29) with only the one timepoint (86.81 +−5.41) (p=0.0207). This difference becomes non-significant if we consider multiple comparisons. Numerically this is a small difference and both means are well within the normal range for glucose.
3.3 Change in Risk Markers at 6 Month Follow-up in Patients
BMI significantly increased with treatment by a median of 3.45 kg/m2 (P = 0.0002). The mean (SD) BMI changed from 23.93 (4.4) to 27.63 (5.04) kg/m2, and 71.4% of patients were overweight/obese (up from 41.9% at baseline) (Figure 1). The 6-month changes in all other risk markers among patients are presented in Table 3. Fasting glucose (P=0.0449) and fasting insulin (P = 0.0161) increased significantly, and were associated with a trend toward decreased insulin sensitivity. The lipid profile worsened, as reflected in a trend toward increased triglyceride levels and a significant increase in total cholesterol (P = 0.0129), which was largely due to increased LDL.
Figure 1.
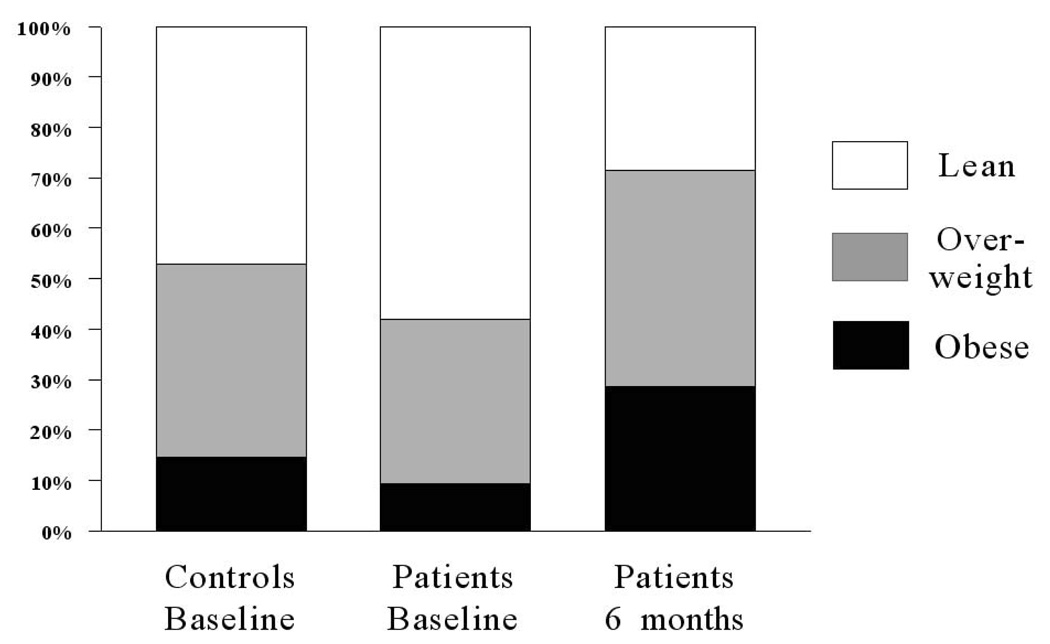
Percentages of healthy comparison group at baseline and first episode psychotic patient (FEP) group at baseline and after 6 months of antipsychotic treatment that were lean (body mass index [BMI] ≤ 24.9 kg/m2; white bar), overweight (BMI = 25 to 29.9 kg/m2; gray bar), and obese (BMI ≥ 30 kg/m2; black bar).
Table 3.
Change in Risk Markers in 16 Patients after Approximately 6 Months of Treatment.
| Baseline Visit | Final visit | Change * | p-value | |||
|---|---|---|---|---|---|---|
| Variable | Mean (SD) | Median (interquartile range) | Mean | Median (interquartile range) | Median (interquartile range) | |
| Triglycerides (mg/dl) | 111.13 (53.39) | 93 (86 to 116) | 145.54 (50.33) | 133 (107 to 185) | 35 (5.5 to 63) | 0.0742 |
| Total Cholesterol (mg/dl) | 179.6 (38.15) | 175 (156 to 199) | 207.4 (39.32) | 209 (166 to 227) | 24 (11 to 38) | 0.0129 |
| LDL (mg/dl) | 106.27 (37.6) | 104 (84 to 130) | 127.08 (36.61) | 119 (100 to 150) | 18.5 (−0.5 to 33.5) | 0.0542 |
| HDL (mg/dl) | 51 (13.55) | 51 (36 to 60) | 52 (13.49) | 52 (41 to 62) | 1.5 (−5 to 6) | 0.4236 |
| Glucose (mg/dl) | 82.6 (11.31) | 82 (78 to 85) | 83.8 (23.39) | 85 (83 to 96) | 5 (0 to 8) | 0.0449 |
| Insulin (µU/ml) | 7.59 (6.55) | 5.05 (3.1 to 10) | 13.43 (12.24) | 7.85 (5.85 to 17) | 2.8 (0 to 8) | 0.0161 |
| QUICKI | 0.38 (0.05) | 0.38 (0.33 to 0.42) | 0.36 (0.09) | 0.35 (0.31 to 0.38) | −0.03 (−0.04 to 0.01) | 0.1016 |
| Adiponectin (µg/ml) | 9.78 (5.23) | 10.63 (5.31 to 11.78) | 9.04 (6.42) | 8.736 (3.96 to 12.39) | −1.597 (−2.39 to −0.67) | 0.0371 |
| Leptin (pg/ml) | 12382.5 (11518.96) | 8515 (5506 to 18999) | 22210.64 (24359.93) | 11792 (6138 to 28889) | 6156 (5175 to 17936) | 0.0215 |
| Interleukin 6 (pg/ml) | 2.03 (2.55) | 1.14 (0.67 to 1.42) | 1.85 (1.68) | 1.31 (0.62 to 3) | 0.01 (−.28 to 1.58) | 1 |
| VCAM-1 (ng/ml) | 509.64 (181.2) | 464 (414 to 528) | 470.27 (74.36) | 467 (413 to 489) | 2 (−23 to 6) | 0.8672 |
| E-selectin (ng/ml) | 30.6 (13.27) | 33.32 (22.35 to 42) | 38.23 (21.02) | 30.57 (25.11 to 62.69) | 5.02 (1.55–20.69) | 0.0195 |
Note: Due to missing values, n=14 (insulin, cholesterol, HDL), n=13 (glucose), n=12 (triglycerides, LDL), n=1 1 (QUICKI), n=10 (all others)
Of the novel risk markers, leptin (P = 0.0215) and E-selectin (P = 0.0195) increased significantly and adiponectin decreased significantly (P = 0.0371), representing a worsening in these markers with treatment. Correlations between BMI changes and lab value changes revealed only one significant relationship, for E-selection (r = 0.66, P = 0.038), indicating a modest association between increasing E-selectin and increasing BMI during treatment.
4. Discussion
In this report, we determined that BMI as well as several other markers of CVD risk were similar in a cohort of first episode psychotic (FEP) adults who were studied before or within weeks of starting antipsychotic medication compared to a group of healthy individuals of comparable age, gender, and ethnicity. The only measured difference was a higher fasting glucose in the FEP group. However, in a subset of patients re-examined after 24 weeks of treatment there was a statistically significant worsening in seven out of 12 laboratory risk markers for CVD and T2DM. It is noteworthy that these changes occurred over a relatively short period of time and in a group of young adults. It should also be noted that despite these statistically significant changes, most of the traditional CVD risk factors remained within a low risk range (i.e., glucose); thus, their long-term clinical significance remains uncertain. The exception to this pattern was total cholesterol, which increased into the high (>200 mg/dl) range during the course of treatment in the FEP subjects. Sengupta and colleagues (Sengupta et al., 2005) studied 9 patients very early into treatment with antipsychotic medications and found significant increase in total cholesterol and LDL-cholesterol after 3 to 4 months but no increases in triglycerides, HDL, insulin, insulin resistance or glucose.
Previously, our group reported an increase in body fat by dual X-ray absorptiometry and an increase in waist circumference in FEP adults treated with olanzapine for 3 months (Graham et al., 2005). The increased leptin and decreased adiponectin observed after 6 months of treatment in the current study are consistent with these observations. Leptin, produced primarily in adipocytes, is well established to increase with body fat. Excessive body fat (i.e., obesity) is also strongly linked to diminished insulin sensitivity, which is, in turn, associated with diminished adiponectin (Furler et al., 2006). In the present study, insulin sensitivity tended to decrease during the treatment period in the group of FEP subjects, as well. Future studies that prospectively evaluate changes in insulin sensitivity simultaneously with changes in adiponectin and body composition within larger, more heterogeneous patient samples are needed to improve our understanding of the mechanisms underlying changes in body composition and obesity-related CVD risk in FEP subjects.
Endothelial dysfunction is a common precursor to CVD, T2DM and stroke. Elevated levels of various cellular adhesion molecules including E-selectin and vascular cell adhesion molecule 1 (VCAM-1) are considered putative markers of endothelial dysfunction. These cellular adhesion molecules are typically elevated in individuals at risk for T2DM, and they are elevated further in diabetic patients who have had silent cerebral infarction (Kawamura et al. 1998). A recent longitudinal study in T2DM patients (Stehouwer et al., 2002) indicated that endothelial dysfunction and inflammation progress together over time, each influencing the other and creating a vicious downward spiral. In our group of patients, E-selectin (but not VCAM-1 or IL-6) increased over the course of treatment. Longer duration studies will be necessary to understand the clinical significance and reproducibility of this finding, its role in the unfolding of this complex cycle of events, and its contribution to diabetic outcomes in patients treated with SGAs.
In the present study, the distribution of a number of the risk marker values changed significantly between the baseline and 6 month follow-up assessments; specifically, the ranges for E-selectin, leptin, adiponectin, insulin, glucose and cholesterol broadened. This suggests that the study medications may have adversely affected some participants more than others. Determining the causes of this variability is essential to understanding why some SGA-treated patients develop CVD and T2D and others do not. With a larger sample, statistical analysis of risk marker changes for the individual SGAs will be very important.
There are several limitations to our study including small sample size and short follow-up period. In this pilot study, no statistical adjustments were made for controlling error. Thus, both our positive as well as our negative findings should be viewed judiciously, and larger studies should be planned that will permit such important statistical control. The lack of drug free status at baseline for all FEP subjects may be viewed as a potential limitation, but one that is inherent (for both ethical and practical reasons) to studies with this patient population. Additionally, since most patients and all control subjects were not hospitalized prior to their blood draw, their fasting status was not verified. This may have occurred more often in the patient group because of symptoms such as disorganization leading to greater difficulty in following directions, possibly contributing to the greater glucose value at baseline for the patient group compared to the control group. To maximize true fasting status all subjects were given both written and oral instructions on fasting, as well as a reminder call the day before.
In summary, several key laboratory indicators of inflammation and endothelial dysfunction worsened in this cohort of FEP patients early in their treatment (i.e., during approximately the first 6–8 months of SGA use). This pattern of effects suggests that SGAs may confer excess CVD and diabetes risk partly via their impact on inflammatory and vascular processes. Early intervention to prevent these underlying pathogenic developments may be warranted.
Acknowledgments
This study was supported primarily by an unrestricted research grant from Eli Lilly and Co., Indianapolis, Indiana, and in part by grants from the National Institutes of Health to the University of North Carolina at Chapel Hill General Clinical Research Center (RR00046) and Clinical Nutrition Research Unit (DK56350).
Role of the Funding Source This study was supported primarily by an unrestricted research grant from Eli Lilly and Co., Indianapolis, Indiana, and in part by grants from the National Institutes of Health to the University of North Carolina at Chapel Hill General Clinical Research Center (RR00046) and Clinical Nutrition Research Unit (DK56350). Eli Lilly had no involvement in study design; in the collection, analysis and interpretation of data; in the writing of the report; and in the decision to submit the paper for publication.
Abbreviations
- FEP
(first episode psychosis)
Footnotes
Publisher's Disclaimer: This is a PDF file of an unedited manuscript that has been accepted for publication. As a service to our customers we are providing this early version of the manuscript. The manuscript will undergo copyediting, typesetting, and review of the resulting proof before it is published in its final citable form. Please note that during the production process errors may be discovered which could affect the content, and all legal disclaimers that apply to the journal pertain.
Contributor Information
Karen A. Graham, Email: Karen_Graham@med.unc.edu.
Hyunsoon Cho, Email: hscho@email.unc.edu.
Kimberly A. Brownley, Email: kbrownle@med.unc.edu.
Joyce B. Harp, Email: jharp@email.unc.edu.
References
- Allison DB, Fontaine KR, Heo M, Mentore JL, Cappelleri JC, Chandler LP, Weiden PJ, Cheskin LJ. The distribution of body mass index among individuals with and without schizophrenia. J Clin Psychiatry. 1999a;60:215–220. doi: 10.4088/jcp.v60n0402. [DOI] [PubMed] [Google Scholar]
- Allison DB, Janet L, Mentore MS, Moonseong H, Chandler L, Cappelleri JC, Infante M, Weiden P. Antipsychotic-induced weight gain: a comprehensive research synthesis. Am J Psychiatry. 1999b;156:1686–1695. doi: 10.1176/ajp.156.11.1686. [DOI] [PubMed] [Google Scholar]
- Arranz B, Rosel P, Ramirez N, Duenas F, Fernandez P, Sanchez JM, Navarro MA, San L. Insulin resistance and increased leptin concentrations in noncompliant schizophrenia patients but not in antipsychotic-naive first-episode schizophrenia patients. J Clin Psychiatry. 2004;65(10):1335–1342. doi: 10.4088/jcp.v65n1007. [DOI] [PubMed] [Google Scholar]
- Brown S, Barraclough B, Inskip H. Causes of the excess mortality of schizophrenia. British J Psych. 2000;177:212–217. doi: 10.1192/bjp.177.3.212. [DOI] [PubMed] [Google Scholar]
- Charatan FBE, Bartlett NG. The effect of chlorpromazine (‘Largactil’) on glucose tolerance. J Ment Sci. 1955;101:351–353. doi: 10.1192/bjp.101.423.351. [DOI] [PubMed] [Google Scholar]
- Christensen AF, Poulsen J, Nielsen CT, Bork B, Christensen A, Christensen M. Patients with schizophrenia treated with aripiprazole, a multicentre naturalistic study. Acta Psychiatr Scand. 2006;113(2):148–153. doi: 10.1111/j.1600-0447.2005.00736.x. [DOI] [PubMed] [Google Scholar]
- Cohn TA, Remington G, Zipursky RB, Azad A, Connolly P, Wolever TMS. Insulin resistance and adiponectin levels in drug-free patients with schizophrenia: A preliminary report. Can J Psychiatry. 2006;51(6):382–386. doi: 10.1177/070674370605100608. [DOI] [PubMed] [Google Scholar]
- Dynes JB. Diabetes in schizophrenia and diabetes in nonpsychotic medical patients. Dis Nerv Sys. 1969;30(5):341–344. [PubMed] [Google Scholar]
- Friedewald WT, Levy RI, Fredrickson DS. Estimation of the concentration of low-density lipoprotein cholesterol in plasma, without use of the preparative ultracentrifuge. Clin Chem. 1972;18:499–502. [PubMed] [Google Scholar]
- Furler SM, Gan SK, Poynten AM, Chisholm DJ, Campbell LV, Kriketos AD. Relationship of adiponectin with insulin sensitivity in humans, independent of lipid availability. Obesity. 2006;14:228–234. doi: 10.1038/oby.2006.29. [DOI] [PubMed] [Google Scholar]
- Graham KA, Perkins DO, Edwards LJ, Barrier RC, Jr, Lieberman JA, Harp JB. Effect of olanzapine on body composition and energy expenditure in adults with first-episode psychosis. Am J Psychiatry. 2005;162(1):118–123. doi: 10.1176/appi.ajp.162.1.118. [DOI] [PubMed] [Google Scholar]
- Hennekens CH, Hennekens AR, Hollar DH, Casey DE. Schizophrenia and increased risks of cardiovascular disease. Am Heart J. 2005;150:1115–1121. doi: 10.1016/j.ahj.2005.02.007. [DOI] [PubMed] [Google Scholar]
- Hiles BW. Hyperglycemia and glycosuria following chlorpromazine therapy. JAMA. 1956;162:1651. [Google Scholar]
- Homel P, Casey D, Allison DB. Changes in body mass index for individuals with and without schizophrenia, 1987–1996. Schizophr Res. 2002;55(3):277–284. doi: 10.1016/s0920-9964(01)00256-0. [DOI] [PubMed] [Google Scholar]
- Hosojima H, Togo T, Odawara T, Hasegawa K, Miura S, Kato Y, Kanai A, Kase A, Uuchikado H, Hirayasu Y. Early effects of olanzapine on serum levels of ghrelin, adiponectin and leptin in patients with schizophrenia. Psychopharmacology. 2006;20(1):75–79. doi: 10.1177/0269881105056647. [DOI] [PubMed] [Google Scholar]
- Jin H, Meyer JM, Jeste DV. Atypical antipsychotics and glucose dysregulation: a systematic review. Schizophr Res. 2004;71(2–3):195–212. doi: 10.1016/j.schres.2004.03.024. [DOI] [PubMed] [Google Scholar]
- Katz A, Nambi SS, Mather K, Baron AD, Follman DA, Sullivan G, Quon MJ. Quantitative insulin sensitivity check index: a simple, accurate method for assessing insulin sensitivity in humans. J Clin Endoc Metabol. 2000;85(7):2402–2410. doi: 10.1210/jcem.85.7.6661. [DOI] [PubMed] [Google Scholar]
- Kawamura T, Umemura T, Kanai A, Uno T, Matsumae H, Sano T, Sakamoto N, Sakakibara T, Nakamura J, Hotta N. The incidence and characateristics of silent cerebral infarction in elderly diabetic patients: association with serum-soluble adhesion molecules. Diabetologia. 1998;41(8):911–917. doi: 10.1007/s001250051007. [DOI] [PubMed] [Google Scholar]
- Kohen D. Diabetes mellitus and schizophrenia: historical perspective. Br J Psychiatry. 2004;184 suppl 47:S64–S66. doi: 10.1192/bjp.184.47.s64. [DOI] [PubMed] [Google Scholar]
- Lieberman JA, Stroup TS, McEvoy JP, Swartz MS, Rosenheck RA, Perkins DO, Keefe RSE, Davis SM, Davis CE, Lebowitz BD, Severe J, Hsiao JK Clinical Antipsychotic Trials of Intervention Effectiveness (CATIE) Investigators. Effectiveness of antipsychotic drugs in patients with chronic schizophrenia [Google Scholar]
- Marder Sr, McQuade RD, Stock E, Kaplita S, Marcus R, Safferman AZ, Saha A, Ali M, Iwamoto T. Aripiprazole in the treatment of schizophrenia: safety and tolerability in short-term, placebo-controlled trials. Schizophr Res. 2003;61(2–3):123–136. doi: 10.1016/s0920-9964(03)00050-1. [DOI] [PubMed] [Google Scholar]
- McEvoy JP, Brown S. Smoking in first-episode patients with schizophrenia. Am J Psychiatry. 1999;156(7):1120–1121. doi: 10.1176/ajp.156.7.1120a. [DOI] [PubMed] [Google Scholar]
- Mukherjee S, Schnur D, Reddy R. Family history of type 2 diabetes in schizophrenia patients (letter) Lancet. 1989;1(8636):495. doi: 10.1016/s0140-6736(89)91392-5. [DOI] [PubMed] [Google Scholar]
- Richards AA, Hickman IJ, Want AYH, Jones AL, Newell F, Mowry BJ, Whithead J, Prins JB, Macdonald GA. Olanzapine treatment is associated with reduced high molecular weight adiponectin in serum: A potential mechanism for loanzapine-induced insulin resistance in patients with schizophrenia. J Clin Psychopharmacol. 2006;26(3):232–237. doi: 10.1097/01.jcp.0000218404.64619.52. [DOI] [PubMed] [Google Scholar]
- Ryan MCM, Thakore JH. Physical consequences of schizophrenia and its treatment: The metabolic syndrome. Life Sci. 2002;71:239–257. doi: 10.1016/s0024-3205(02)01646-6. [DOI] [PubMed] [Google Scholar]
- Ryan MC, Collins P, Thakore JH. Impaired fasting glucose tolerance in first-episode, drug-naïve patients with schizophrenia. Am J Psychiatry. 2003;160(2):284–289. doi: 10.1176/appi.ajp.160.2.284. [DOI] [PubMed] [Google Scholar]
- Ryan MCM, Flanagan S, Kinsella U, Keeling F, Thakore JH. The effects of atypical antipsychotics on visceral fat distribution in first episode, drug-naïve patients with schizophrenia. Life Sci. 2004;74(16):1999–2008. doi: 10.1016/j.lfs.2003.08.044. [DOI] [PubMed] [Google Scholar]
- Sengupta SM, Klink R, Stip E, Baptista T, Malla A, Joober R. Weight gain and lipid metabolic abnormalities induced by olanzapine in first-episode, drug-naïve patients with psychotic disorders. Schizophr Res. 2005;80(1):131–133. doi: 10.1016/j.schres.2005.07.024. [DOI] [PubMed] [Google Scholar]
- Sonnenberg GE, Krakower GR, Kissebah AH. A novel pathway to the manifestations of metabolic syndrome. Obes Res. 2004;12(2):180–186. doi: 10.1038/oby.2004.24. [DOI] [PubMed] [Google Scholar]
- Stehouwer CD, Gall MA, Twisk JW, Knudsen E, Emeis JJ, Parving HH. Increased urinary albumin excretion, endothelial dysfunction, and chronic low-grade inflammation in type 2 diabetes: progressive, interrelated, and independently associated with risk of death. Diabetes. 2002;51:1157–1165. doi: 10.2337/diabetes.51.4.1157. [DOI] [PubMed] [Google Scholar]
- Susce MT, Villanueva N, Diaz FJ, de Leon J. Obesity and associated complications in patients with severe mental illnesses: A cross-sectional survey. J Clin Psychiatry. 2005;66(2):167–173. doi: 10.4088/jcp.v66n0203. [DOI] [PubMed] [Google Scholar]
- Thakore JH, Mann JN, Vlahos I, Martin A, Reznek R. Increased visceral fat distribution in drug-naive and drug-free patients with schizophrenia. Int J Obes Relat Metab Disord. 2002;26(1):137–141. doi: 10.1038/sj.ijo.0801840. [DOI] [PubMed] [Google Scholar]
- Thonnard-Neumann E. Phenothiazines and diabetes in hospitalized women. Am J Psychiatry. 1968;124(7):978–982. doi: 10.1176/ajp.124.7.978. [DOI] [PubMed] [Google Scholar]
- Togo T, Kojima K, Shoji M, Kase A, Uchikado H, Katsuse O, Iseki E, Kosada K. Serum adiponectin concentrations during treatment with olanzapine or risperidone: A pilot study. Int Clin Psychopharmacol. 2004;19(1):37–40. doi: 10.1097/00004850-200401000-00007. [DOI] [PubMed] [Google Scholar]
- Wirshing DA, Wirshing WC, Kysar L, Berisford MA, Goldstein D, Pashdag J, Mintz J, Marder SR. Novel antipsychotics: comparison of weight gain liabilities. J Clin Psychiatry. 1999;60(6):358–363. [PubMed] [Google Scholar]
- Zhang ZJ, Yao ZJ, Liu W, Fang Q, Reynolds G. Effects of antipsychotics on fat deposition and changes in leptin and insulin levels. Magnetic resonance imaging study of previously untreated people with schizophrenia. Br J Psychiatry. 2004a;184:58–62. doi: 10.1192/bjp.184.1.58. [DOI] [PubMed] [Google Scholar]
- Zhang XY, Zhou DR, Cao LY, Zhang PY, Wu GY, Shen YC. Changes in serum interleukin-2, -6, and -8 levels before and during treatment with risperidone and haloperidol: relationship to outcome in schizophrenia. J Clin Psychiatry. 2004b;65(7):940–947. doi: 10.4088/jcp.v65n0710. [DOI] [PubMed] [Google Scholar]