

Abstract
The light induced proton transport in bacteriorhodopsin has been considered as a model for other light-induced proton pumps. However, the exact nature of this process is still unclear. For example, it is not entirely clear what the driving force of the initial proton transfer is and, in particular, whether it reflects electrostatic forces or other effects. The present work simulates the primary proton transfer (PT) by a specialized combination of the EVB and the QCFF/PI methods. This combination allows us to obtain sufficient sampling and a quantitative free energy profile for the PT at different protein configurations. The calculated profiles provide new insight about energetics of the primary PT and its coupling to the protein conformational changes. The present finding confirms the tentative analysis of our early work [1] and determines that the overall PT process is driven by the energetics of the charge separation between the Schiff base and its counterion Asp85. Apparently, the light-induced relaxation of the steric energy of the chromophore leads to an increase in the ion-pair distance, and this drives the PT process. Our use of the linear response approximation allows us to estimate the change in the protein conformational energy and provides the first computational description of the coupling between the protein structural changes and the PT process. It is also found that the PT is not driven by twist-modulated changes of the Schiff base’s pKa, changes in the hydrogen bond directionality, or other non-electrostatic effects. Overall, based on a consistent use of structural information as the starting point for converging free-energy calculations, we conclude that the primary event should be described as a light-induced formation of an unstable ground state, whose relaxation leads to charge separation and to the destabilization of the ion-pair state. This provides the driving force for the subsequent PT steps.
Keywords: Proton transport in protein, QM/MM Convergence, energy storage, pKa in proteins
I. Introduction
The conversion of light energy to electrostatic energy in the form of proton transport (PTR) against a pH gradient is a problem of significant interest in bioenergetics (e.g., [2–12]). One of the best model systems that can help in gaining molecular understanding of such processes is provided by bacteriorhodopsin. This system absorbs light and then undergoes a sequence of relaxation and PTR processes, which eventually lead to proton pumping (for reviews see [2, 9–20]). The advances in structural and kinetic studies of this system have yielded major insights about this conversion of light energy to pH gradient [2, 13, 14, 21]. However, the detailed molecular picture of the overall process is still incomplete. What is currently missing is a clear conversion of the available structural information to activation energies and rate constants for the proton pumping process as well as detailed information on the excited state reaction.
In order to correlate the structure and function of bR, it is useful to apply theoretical approaches capable of modeling different aspects of the cycle of bR. In fact, this problem has been subjected to significant numbers of theoretical studies, ranging from conceptual analysis of the pumping process or some key elements of this process [1, 22–25], to calculation of the spectral changes (e.g., [26–31]), calculations of the excited-state dynamics [28, 32, 33], and studies of the protonation state of the system (e.g., [19, 34, 35]). The above studies have helped to advance our understanding, but some issues are still unresolved. More specifically, while different aspects of the excited state dynamics are relatively clear (e.g., [8, 28, 33]), the studies of the ground-state relaxation processes and the PTR process are at a more preliminary stage. That is, early studies have explored the energetics of the pumping process in bR [1, 22, 23] and established general concepts about PTR in proteins [1, 22], and led eventually to actual simulations of PTR in proteins (e.g., [36, 37]). However, none of these simulation approaches was applied to the action of bR.
Recent QM/MM studies [38, 39] have examined the delocalization of the proton charge near Glu204 and Glu194, but they have not explored the barriers for the PTR process. Other recent QM/MM studies [18, 40] have explored the primary PT step and provided instructive insight, but the calculations have not provided the relevant activation free energies (instead they estimated activation energies). Furthermore, these calculations have not demonstrated their consistency by reproducing the observed pKa of the system and, probably, have not provided the extensive sampling for quantitative conclusions about the relevant energetics (see below). Macroscopic studies that consider the pKa changes of the system (e.g., ([19, 20, 34, 35]) have provided an important insight, but have not evaluated the activation barrier for the PT steps or the effect of possible distortions of the chromophore.
In exploring the energetics of the primary PT it is important to take advantage of the available experimental information. Fortunately, we now have information about the changes in structure after absorption of light and the corresponding change in protonation states [2, 13, 21, 41]. It is generally agreed that the chromophore is protonated in bR and that, following absorption of light, it isomerizes around the 13–14 bond from the trans to the cis configuration and then relaxes through a series of intermediates (K, L, M1 and M2), where, at M1, the proton is transferred from the Schiff Base (SB) to Asp85 (the relevant system is depicted in Fig. 1). Subsequent relaxation processes lead to proton transport (PTR) to the extracellular side, followed by proton uptake from the cytoplasmic side.
Figure 1.
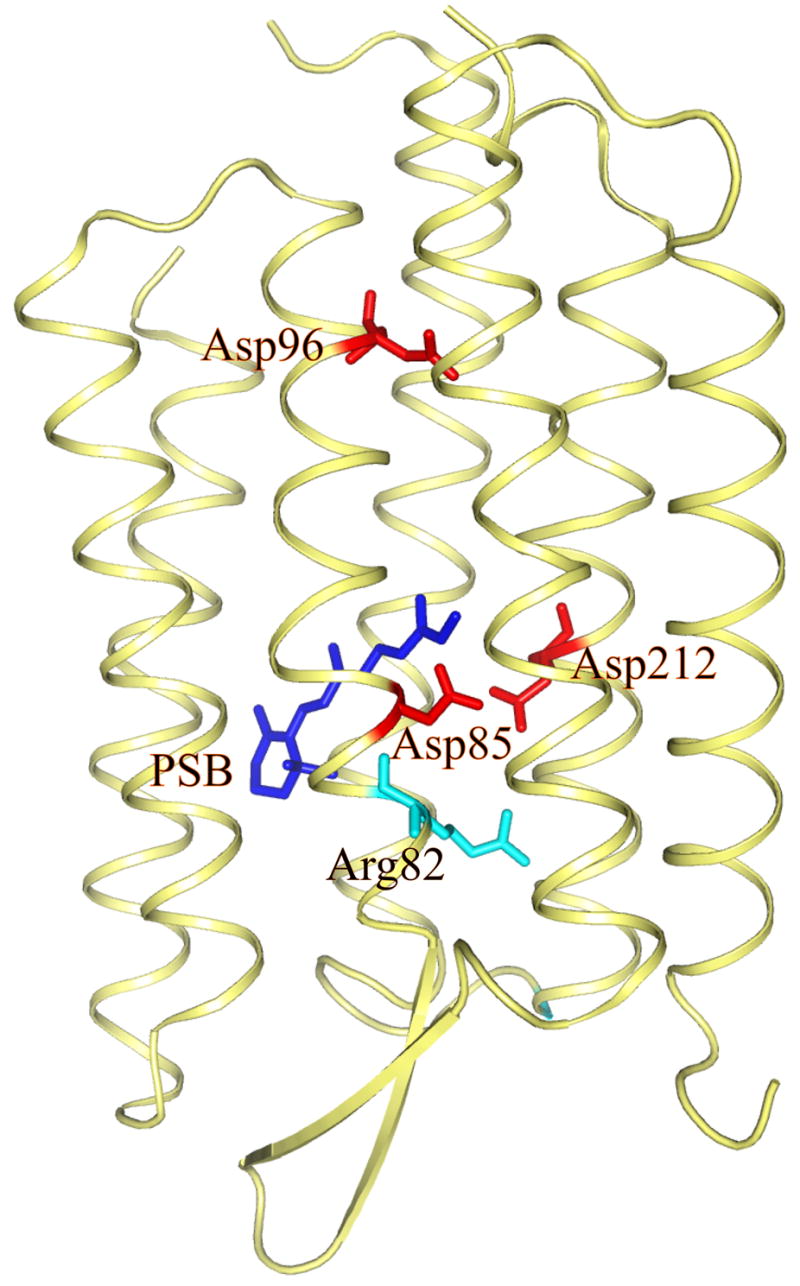
Showing the structures of bacteriorhodopsin, the bound protonated Schiff base (PSB) and some key groups.
Current high resolution studies (e.g., [21, 42–50]) as well as earlier studies [13, 51] provide structural information about key intermediates, although some structural features are still controversial [18, 41, 52–54]. Using these structures as starting points for the simulation can help in examining the landscape for the PT process.
The present work is aimed at quantifying the energetics of the primary PT in the landscape of key protein configurations by converting the structural information to free energy barriers. This is done by taking the structures of different protein intermediates and evaluating the PT profile in each of them. Our treatment provides detailed insight about the coupling between the protein conformational changes and the PT process. This offers instructive clues about the overall energy relaxation in the free energy landscape in bacteriorhodopsin. Furthermore, it is demonstrated that the overall process still involves light-induced charge separation as suggested long ago [1, 3], but that the corresponding conversion of strain to electrostatic energy is rather slow.
II. Methods
Insofar as the simulation method is concerned, our main problem is to select a reliable procedure for the evaluation of the free energy for PT in proteins. Such a method should take into account the chromophore conformations and the protein electrostatic potential. In principle one can try to use an ab initio QM/MM approach, but at present such approaches are unable to provide reliable free energy surfaces for reactions in solutions or in proteins, since they require an extensive configurational averaging and thus extremely long simulation times (e.g., see discussion in [55–57]). In principle, it is possible to use a special approach that uses the EVB as the reference potential for ab initio free energy calculations [57]. However, even such simulation approaches may not lead to convergent results. The same problem seems to exist at present with alternative simulation approaches (see discussion in section IV). Thus, we introduce here an effective yet reliable combination of the QCFF/PI method (e.g. [58]) and the EVB approach [59] in a unified QM/MM treatment. As will be demonstrated here, this combination provides a powerful way of obtaining reliable results for the PT reaction (by the EVB) and for the effect of delocalization on the chromophore pKa (by the QCFF/PI) while allowing for sufficient sampling.
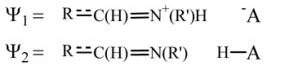
Formally, we describe the reacting system in terms of two resonance structures of the form:
 |
(1) |
where R
 C(H)=N+(R′)H and R
 C(H)=N(R′) are the SBH+ and SB, respectively, and AH is the protonated acceptor (i.e., Asp85). The charge sets for the EVB approach is taken from either DFT calculations [34] or the QCFF/PI charge set.
The EVB energetics of the two states are obtained by representing the chromophore (either SBH+ or SB) by the QCFF/PI potential surface, and treating the proton acceptor by empirical potential functions. The surrounding solvent (and/or protein) is coupled to the QCFF/PI Hamiltonian through a standard QM/MM treatment [28, 32, 60–62] and, of course, the solvent is incorporated into the EVB part of the Hamiltonian. That is, our model is based on the following diabatic states,
| (2) |
where the εQCFF/PI of the indicated form of the chromophore includes the potential from the solvent/protein system, ε′ is an EVB description of the indicated form of Asp85, and εSS′ is the interaction between the classical (EVB) and π-electron systems, which is being treated as in the regular EVB treatment by considering the classical electrostatic and steric interactions between the two fragments. Finally, ε(ι)sS represents the interaction between the solvent (s) and the solute (S) in the given state, while α(i) is the so-called “gas-phase shift”, which will be considered below. This procedure couples the EVB and the QCFF/PI methods in an effective and stable way to capture both the conjugation effect of the chromophore and the proper treatment of the PT process. Note that the solvent effect on the PT process is obtained here consistently by allowing the diabatic states to interact with instantaneous solvent configurations, which are, in turn, polarized by the ground state (mixed charges) of the solute (see discussion in [63]). This is done in addition to the interaction of the solvent with the QCFF/PI Hamiltonian.
The actual ground state energy that reflects the mixing between Ψ1 and Ψ2 is given by [59]
| (3) |
where H12 is the off-diagonal element that couples Ψ1 and Ψ2.
The use of the EVB philosophy allows for a reliable calibration of the PT energetics by forcing the pKa of SBH+ and AspH to reproduce the corresponding observed values in water. This is accomplished by requiring that the free energy for PT between SBH+ and Asp− at large separation in solution would reproduce the observed pKa difference. That is, we adjust the gas phase shift, α(ι), by requiring that
| (4) |
where the superscript w indicates that the given value corresponds to a proton transfer in water and the subscript ∞ indicates that the PT process occurs at a large separation between the donor and acceptor. Here, the values are taken as 7 for the Schiff base [64] and 4 for Aspartic acid [65]. The overall set of parameters used is summarized in Table 1. Now, when we move to the protein simulations, we keep all parameters unchanged and this guarantees well calibrated results.
Table 1.
EVB and QCFF/PI parameters used
| EVB-DFT | QCFF/PI-DFT | QCFF/PI-QC | |||||||||||||
|---|---|---|---|---|---|---|---|---|---|---|---|---|---|---|---|
| Bond Parametersa | D | b0 | β | D | b0 | β | D | b0 | β | ||||||
| OD85-H | 30.0 | 0.96 | 2.0 | 102.0 | 0.96 | 2.0 | 102.0 | 0.96 | 2.0 | ||||||
| NSB-H | 30.0 | 1.02 | 2.0 | 99.0 | 1.0 | 93.0 | 99.0 | 1.0 | 2.0 | ||||||
| EVB Atom c | Charges b | Charges b | Charges c | ||||||||||||
|
| |||||||||||||||
| HN | 0.346 | 0.346 | 0.203 | ||||||||||||
| HO | 0.303 | 0.203 | 0.203 | ||||||||||||
| OD85- | −0.750 | −0.700 | −0.700 | ||||||||||||
| OD85-H | −0.450 | −0.200 | −0.200 | ||||||||||||
| NSB-H+ | −0.260 | −0.260 | −0.229 | ||||||||||||
| NSB | −0.474 | −0.474 | −0.395 | ||||||||||||
| Off-diagonal Hij’s | A | α | β′ | γ′ | θ0′ | A | α | β′ | γ′ | θ0′ | A | α | β′ | γ′ | θ0′ |
| O−---HN+ | 480.0 | 0.9 | 2.0 | 0.5 | 180.0 | 480.0 | 0.9 | 2.0 | 0.5 | 180.0 | 480.0 | 0.9 | 2.0 | 0.5 | 180.0 |
For the QCFF/PI calculations, the bond stretching energies are described by an exponential (rather than the typical Morse) equation, with parameters D, b0 and β. The OD85-H bond in these cases is calculated by the normal EVB Morse equation, but the NSB-H bond is calculated with the exponential equation. This equation is of the form: f(b) = D[exp(−2β (b− b0)) − 2exp(−β (b−b0))].
The charges on the retinal are taken from reference [34].
The charges on the retinal are taken from the QCFF/PI calculations.
It should be clarified that Eq. (4) reflects a thermodynamic fact, and thus presents a consistency requirement for any theoretical methods including ab initio QM/MM studies. In fact, our recent advanced QM/MM approach satisfies this requirement in key test cases without any parameterization [66].
The EVB-QCFF/PI potential surfaces provide convenient analytical surfaces that allow for efficient free energy calculations. This is done by the standard EVB Free Energy Perturbation/Umbrella Sampling (FEP/US) approach [59]. Using this approach we obtain the ground-state free energy surface by defining a mapping potential of the form
| (5) |
When ηm is changed from 0 to 1 in n+1 fixed increments (ηm = 0/n, 1/n, 2/n, …, n/n), potentials with one or more of the intermediate values of ηm will force the system to fluctuate near the TS.
The free energy, ΔGm, associated with changing ηm from 0 to m/n is evaluated by the well known free energy perturbation (FEP) procedure, described elsewhere (see, e.g., [59]). However, after obtaining ΔGm we still need to obtain the free energy that corresponds to the adiabatic ground state surface (the Eg of Eq. 3) along the reaction coordinate, x. This free energy (referred to as a “free energy functional”) is obtained by the FEP/US method, which can be written as
| (6) |
where εm is the mapping potential that keeps x in the region of x′ and 〈 〉 εm designates a molecular dynamics (MD) average with the potential εm. If the changes in εm are sufficiently gradual, the free energy functional, Δg(x′), obtained with several values of m, overlap over a range of x′, and patching together the full set of Δg(x′) gives the complete free energy curve for the reaction. In choosing the general reaction coordinate, x, we note that the regular geometrical coordinate, used in gas phase studies, cannot provide a practical way to model the multidimensional reaction coordinate of reactions in solution and protein. In modeling such processes, it is crucial to capture the effect of the solvent polarization and probably the best way to describe this effect microscopically is to follow our early treatment [59] and to use the electronic energy gap as the general reaction coordinate (x = ε1 − ε2).
The FEP/US approach may be also used to obtain the free energy functional of the isolated diabatic states. For example, the diabatic free energy, Δg1, of the reactant state can be calculated as [59]
| (7) |
The diabatic free energy profiles of the reactant and product states provide the microscopic equivalent of the Marcus’ parabolas [67].
As will be demonstrated here, it is unlikely that other QM/MM methods can provide sufficient sampling to address the problems explored here. Thus, it is essential to use an approach that allows for a fully consistent sampling of PT reactions and also for efficient examination of the chromophore delocalization. Thus, we consider EVB-QCFF/PI as the most suitable approach for exploring the energetics of the primary PT in bR.
All the EVB calculations were done with the ENZYMIX module of the MOLARIS program [68, 69]. The calculations involved the surface constraint all atom solvent (SCAAS) spherical boundary conditions [70] and the local reaction field (LRF) long-range treatment [71]. The SCAAS simulations inserted as usual water molecules in all the available protein cavities, but in some cases we kept the X-ray observed water molecules. The free energy simulations were done with 21 windows of 10 ps each. The simulations were done with time steps of 1 fs at 300 K. The QCFF/PI surface was obtained by coupling MOLARIS to the QCFF/PI program [72] in its heteroatom version [61]. The protein force field used in the EVB/QCFF/PI simulation used the polarizable ENZYMIX force field [68].
The use of a polarizable force field may be important when one deals with ionized groups in the protein interior [73], and it is hard to know a priori whether it is needed or not (thus, its use is highly recommended to explore the polarizability effects).
In addition to the microscopic EVB calculations, it is important to explore the stability and validity of the calculations by focusing on the electrostatic contributions and the relevant pKa values, while using stable and reliable semi-macroscopic approaches. This is important since we are dealing with heterogeneous protein interiors where the convergence of fully microscopic approaches is quite slow and frequently problematic [55, 74]. For this purpose, we find it useful to evaluate the relevant electrostatic energies by the PDLD/S-LRA method [65, 68, 75]. This method evaluates the change in solvation free energies upon transfer of a given group (or groups) from water to the protein by using the effective potential (see Eq. 8) [68].
| (8) |
where is the free energy of solvation of the ith ionizable group in water (the self-energy in water), and are the free energies of solvation of the entire protein in water with atomic charges present on the particular group (“charged state”) and with atomic charges on the group set to zero (“uncharged state”), respectively. The term approximates the case where the ionizable group is not in the protein cavity. ΔUqμ is the vacuum interaction between the atomic charges on the ionizable group and the permanent dipoles of the protein (represented by atomic charges), εw is the dielectric constant of water, and εp is the dielectric constant of the protein, which is basically a semi-macroscopic scaling factor that accounts for the interactions that are not considered explicitly. This factor is quite different than the actual macroscopic dielectric constant of the protein (see [76]).
To capture the physics of the reorganization of the protein dipoles in the charging process, it is necessary to relax the protein structure in the relevant charged and uncharged states. Moreover, for accurate free energy differences, several protein configurations should be averaged. This is done here by using the LRA framework [65, 68]. This approach approximates the free energy associated with a transformation between two charged states by averaging the potential difference between the initial and final states over trajectories propagated on these two states, respectively. Using the PDLD/S free energy that corresponds to a single protein structure as an effective potential in the PDLD/S-LRA method, the free energy of solvation is given by
| (9) |
where the is the PDLD/S effective potential of Eq. 8, the 〈 〉 q=qi and 〈 〉 q=0 terms designate an average over protein configurations generated in the charged and uncharged states of the given group, respectively. Although this approach takes into account the reorganization of the environment explicitly, it may not fully account for some effects such as the complete water penetration and protein reorganization. These factors and the effect of induced dipoles are implicitly included in the model, which lead to the use of εp in the PDLD/S model.
The basic PDLD/S-LRA calculations are performed with all the protein groups (except some active site residues) in their neutral form. The effect of ionizing these groups is evaluated macroscopically by finding their ionization state in a self-consistent way [65] and then evaluating the effect of these groups using a distance dependent dielectric constant.
As described and justified elsewhere [65, 76], with PDLD/S-LRA solvation free energies we can evaluate the apparent pKa of any given group. This is done using [65]
| (10) |
where q̄i is the charge of the ionized form of the given residue, for acidic groups we have q̄i = −1 (q(AH)=0, q(A−)=−1) and for basic groups we have q̄i = +1 (q(BH)=+1, q(B)=0). is the pKa of the ith group when all the other groups are neutral, while reflect the effects of all other ionized groups on the ith group. This effect is evaluated self consistently using a distance dependent dielectric constant for charge-charge interactions (e.g., see [76]). Since can be determined experimentally, one needs to focus only on the second and third terms in Eq. 10. Similar treatment is used for the energy of ion pairs.
The PDLD/S-LRA calculations involved, as usual, two steps (e.g., [65]), first running MD to generate protein configurations for the charged and uncharged states, and then averaging the PDLD/S results for the generated configurations. All the PDLD/S-LRA calculations were performed by the automated procedure of the MOLARIS program [68], where we generated typically 20 configurations for the charged and uncharged state, using MD simulations of 1ps, with a 1fs time step, for each configuration. As in the previous studies, we used εp = 4, which is the optimal value when the LRA approach is used [76].
One of the challenges of obtaining a complete picture of the energetics of PT in proteins involves the case when the protein conformation changes in a significant way. In such cases, we have to assess the relative energy of the different configurational states. In general, it is tempting to estimate these energies by the approach introduced for this purpose in ref. [1] and used in recent studies of bR [19, 34] and other systems (e.g., [65, 77]. That is, we can express the free energy of the mth state by
| (11) |
where is defined in Eq. (10), and the last term corresponding to the combined effect of the last term of Eq. (10) is applied to all ionized residues. It is possible to appreciate this equation by noting that the first term represents the free energy of ionizing the given set of protein groups and the second term represents the interaction between these groups. Thus, ΔGm gives the free energy of assembling the given set of charges in the protein and provides a way of estimating the free energy difference between different ionization states of the protein. Unfortunately, Eq. (11) involves a significant problem when we deal with states with very different protein configurations. In this case, even an LRA pKa calculation in each protein structure is likely to miss the free energy associated with the change in the protein structure (the LRA charging procedure only captures the local protein reorganization within each substructure). Thus, we did not use Eq. (11) in the present work and concluded that in the case of bR (when we have different protein structures) it is useful to apply the same LRA treatment used in our study of the effect of the protein configurational changes in ATPase [78] and in cytochrome c [79]. The LRA treatment gives relevant free energy by:
| (12) |
where 〈 〉 ri,m indicates an average over the charge distribution, qm, where the system is held by a weak constraint near the coordinates of the indicated states (ri). This treatment will allow us to explore the change in the protein internal free energy upon conformational change.
III. Results and Discussion
In order to gain a detailed insight into the nature of the primary PT in bR, we explored this process in a systematic way focusing on the following issues.
III.1 Energetics and Dynamics of the PT process
Our analysis of the PT process started with the working hypothesis that the proton stays on the Schiff base after the light excitation that transforms the system from bR to K (based on extensive spectroscopic studies [2, 8, 27, 80]. The first step of this analysis started by following the time-dependent energy gap (Δε (t) = ε(2) − ε(1)) between the reactant and product state in different protein configurations in the structural models 1C3W [42], 1M0K [43], 1O0A [44], 1P8H [45], 1CWQ [46], 1F4Z [50] and 1C8S [47], which correspond, respectively, to the bR, K, L, M1, M2, M2′ and M22 protein configurations. Other structures (e.g., 1IW9 [41], 1UCQ [54], 1X0S [81] and 2NTW [82] etc.) have emerged during the recent years (after we started this project) but their analysis is left to subsequent studies. Figure 2 presents some of these results and illustrates that the average of Δε is smaller in M2 than in K. Now, according to the analyses presented in many of our early works (e.g., [4, 83]), the proton transfer occurs when the energy fluctuations of the energy gap reach a low value. Furthermore, the chance for a productive PT is proportional to exp{−〈Δε〉/RT}, where R is the gas constant and T is the absolute temperature. Thus, for example, the PT is more likely in M2 than in bR. However, instead of simulating the fluctuations and waiting for extremely long times until Δε reaches its minimum value, it is much more practical to use the EVB mapping procedure and to evaluate the probability distribution (free energy functional) of ε(1) and ε(2) by using Eq. 7, and more importantly, by using Eq. 6 to evaluate the ground state adiabatic free energy surface and the relevant activation free energies. Thus, we calculated the activation free energies by starting from the x-ray models of bR, K, L, M1, M2, M2′ and M22, relaxing each model and then performing EVB free energy mapping calculations. Figure 3 illustrates the relationship between the free energy functional and the adiabatic free energy surface for bR, while Fig. 4 and Table 2 summarize the calculated EVB results for all the systems studied.
Figure 2.
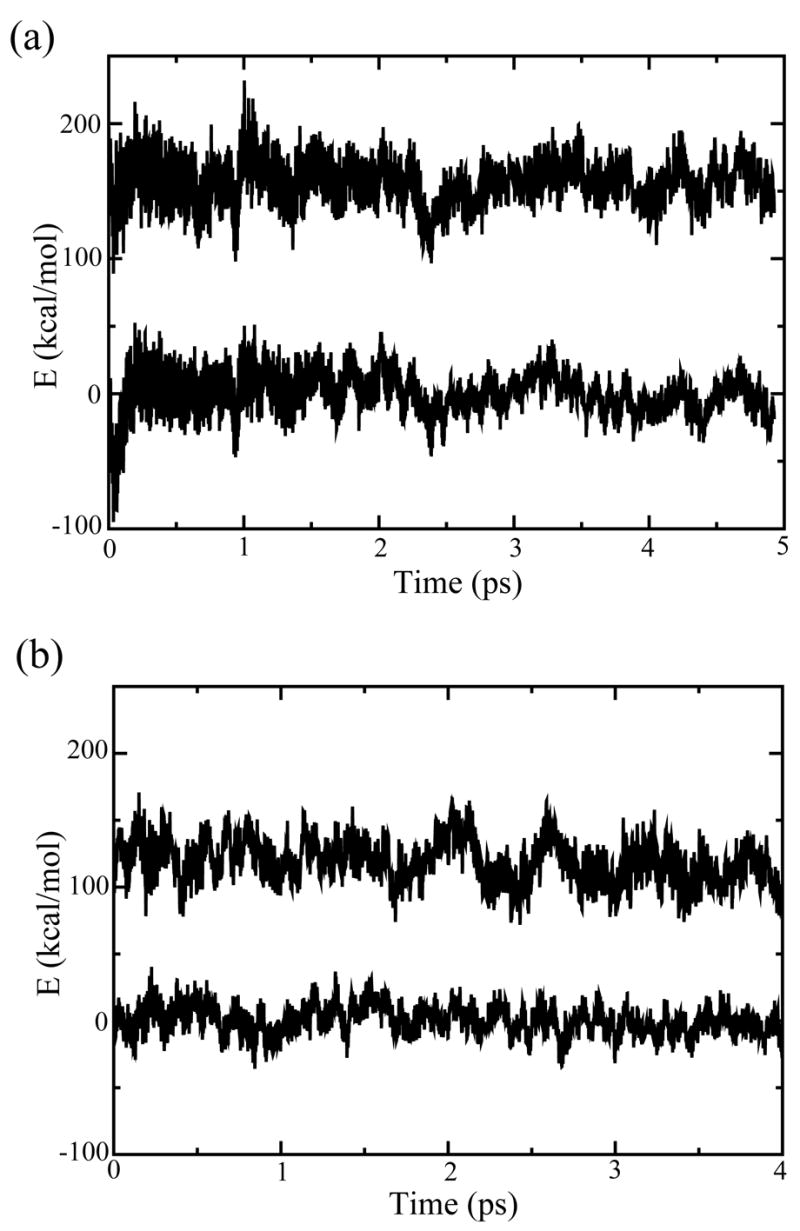
The time-dependent fluctuations of the energy gap that controls the PT in: (a) bR and (b) M2. The PT process occurs when the energy gap is small, although running on the initial state means that one has to wait for an extremely long time for the energy gap to become zero (this is why we use a FEP approach). As seen from the figure, the energy gap is smaller in M2 than in bR and thus, the PT is more likely to occur in M2.
Figure 3.
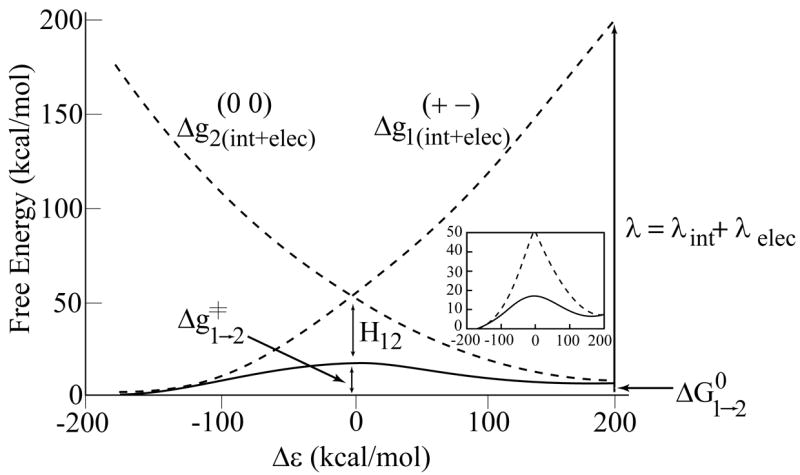
The calculated diabatic and adiabatic free energy surfaces for the PT process in bR. The figure defines the key parameters that control the PT process (as discussed in the text). The inset shows the adiabatic surface in details.
Figure 4.
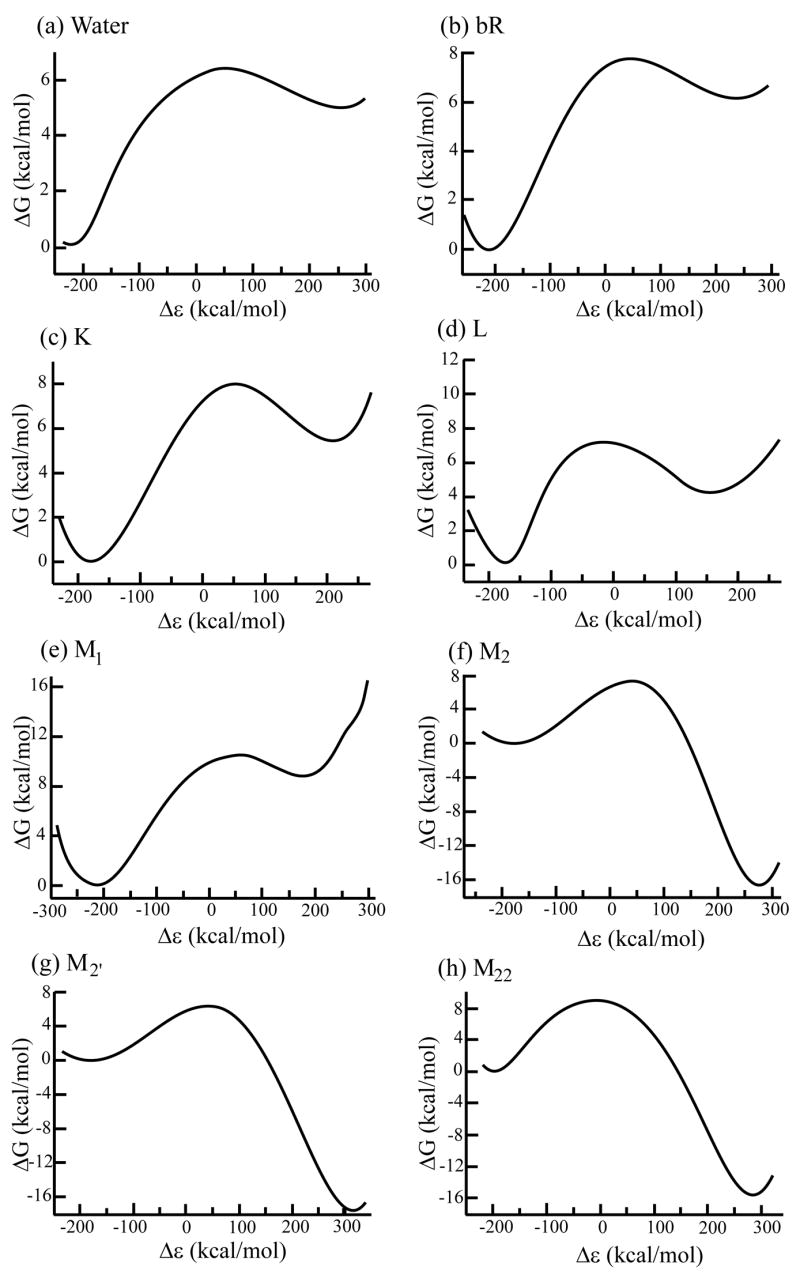
The free energy surfaces for PT in the systems studied by EVB-QCFF/PI approaches. The results are depicted in terms of the energy gap reaction coordinate (Δε = ε1 − ε2).
Table 2.
QCFF/PI-EVB proton transfer energiesa
| System | ΔGPTb | ΔGPTc | λ;PT | |
|---|---|---|---|---|
| water | 6.5 | 6.5 | 8.5 | 46 |
| bR | 8.0 | 7.5 | 9.5 | 17 |
| K | 7.0 | 6.4 | 8.5 | 15 |
| L | 4.5 | 5.8 | 8.2 | 20 |
| M1 | 4.5 | 8.5 | 10.5 | 19 |
| M2 | −28 | −14.0 | 2.0 | 13 |
| M2′ | −16 | −15.5 | 2.0 | 17 |
| M22 | −20 | −13.8 | 2.0 | 11 |
Energies in kcal/mol.
Nonpolarizable force field.
Using polarizable force field.
As seen from the figure, the profiles for PT change from being endothermic (ΔGPT ≈ 6) in bR and K, and then reach ΔGPT ≈ 4 for L and then becomes negative in M2 and M22. The same results are also compiled in Table 2. Before commenting on the overall picture that emerges from Fig. 4 and Table 2, it is crucial to comment on the stability of the calculations. That is, as we stated repeatedly (e.g., [74–76]), it is a major challenge to obtain accurate microscopic results for charge separation processes in protein interiors. The EVB provides one of the most effective ways of doing so, but even this requires averaging over several mapping runs. Furthermore, at least when one compares the calculations in water and in the protein, it is important to use a polarizable force field, as is done with the ENZYMIX force field used here (see [73]). We also provide the PDLD/S-LRA results for ΔGPT in Table 3, where the changes in the free energies are smaller than those obtained by the microscopic treatment. This is expected in view of the larger dielectric compensation obtained in semimicroscopic treatments. Interestingly, insightful macroscopic calculations [19] also gave quite different results with different models.
Table 3.
PDLD/S-LRA energiesa
| System | b | pKa(SBH+) b | c | Δ GPTd |
|---|---|---|---|---|
| water | – | 7.0 | – | 6.5 |
| bR | +2.6 | 8.9 | 0.4 | 6.7 |
| K | +0.3 | 7.2 | − 1.0 | 5.7 |
| L | +3.8 | 9.8 | 0.5 | 6.2 |
| M1 | +4.0 | 9.9 | 1.2 | 7.1 |
| M2 | +2.6 | 8.9 | − 3.0 | 1.3 |
| M2′ | +3.7 | 9.7 | − 3.5 | 1.4 |
| M22 | +3.0 | 9.2 | − 4.0 | 0.5 |
Energies in kcal/mol, where R82 and D212 are ionized; Asp85 is designated by A in the equations below.
is the change in the solvation of the Schiff base upon transfer from water to the protein site, calculated when D85 is negatively charged and where the ‘solvation’ energy in the protein includes the interaction with D85. Here ‘np’ and ‘po’ designate nonpolar and polar, respectively. The corresponding pKa of the Schiff base (when D85 is ionized) is given in pKa units (pKa = 7.0+ ΔΔGsol/1.38).
ΔGPT is evaluated as . Here, is the gas-phase charge-charge interaction between SB+ and A−, and the factor 20 represents the estimate of the dielectric effect for the charge-charge interaction in short distances in water (see related cycle in [111]). is the gas-phase interaction between the polar pair.
The above discussion underscores the importance of “quality control” by comparing the results obtained by starting from different initial configurations generated by perturbing the given PDB structure. Such a treatment is rarely performed by other QM/MM approaches. Another important issue is the possible coupling between the chromophore structure and the pKa of the Schiff base. Here the QCFF/PI offers a powerful way to examine the effect of the torsional distortion which is not available in continuum studies. This issue will be discussed further in Section III.2. At any rate, the main point is the overall trend in Table 2. That is, despite the spread in the results obtained by different approaches (i.e., Table 2 and Table 3), the trend of ΔGPT and for the structures considered is similar and allows one to make general assessments of the energetics of the system. In this respect it is important to clarify that despite the extensive conformational averaging, we recognize the fact that regular MD simulation time is simply unable to lead us from one PDB set to another. This dependence on the structural information leaves our conclusions about M2′ somewhat ambiguous. That is, the calculations yield ΔGPT > 0 for M1, which is problematic. This might reflect either poor convergence or some structural inaccuracies. Since we reproduced the overall trend in the change of ΔGPT in the other configurations, we leave more detailed explanation of this issue to subsequent studies.
Taking the results of Fig. 4 as a reasonable estimate of the conformational dependence of the PT process, we tried to generate a landscape map for the primary PT. The problem is to get the change of energy along the protein coordinate. In principle, we can also estimate the energetics along the conformational coordinate by using the electrostatic configurational energy of Eq. (11), but as stated in Section II, this expression might not give quantitative results when it involves charge configurations that correspond to very different protein configurations. A more quantitative estimate can be obtained by the linear response approximation (LRA) [68] used in our studies of protein conformational changes in F1-ATPase [78] and cytochrome c [79]. In particular, we apply here the trick used in our study of ATPase and evaluate the change in the energy along the protein coordinate using a variant of Eq. (12):
| (13) |
where Δε1→2 = ε2 − ε1 and where 〈 〉 i,rj designates trajectories on state i with a weak constraint that holds the system near the protein configuration rj (see ref. [78]). This approach is illustrated schematically in Fig. 5 and was used to generate the map described in Fig. 6. This figure placed sections of the PT profiles along a coordinate that represents the conformational changes of the protein-chromophore system.
Figure 5.

A schematic description of the LRA procedure used to align the PT surfaces along the protein coordinates, while taking the protein interaction energy into account. The PT conformational coordinate is taken as the gap Δ ε, where the proton is on the Schiff base when Δ ε ≈ − 200. The protein coordinates are described by the transition from bR to M22. The figure illustrates the use of Eq. 13, and the way we manage to take the change in the protein-protein free energy into account without ever calculating this unstable quantity.
Figure 6.
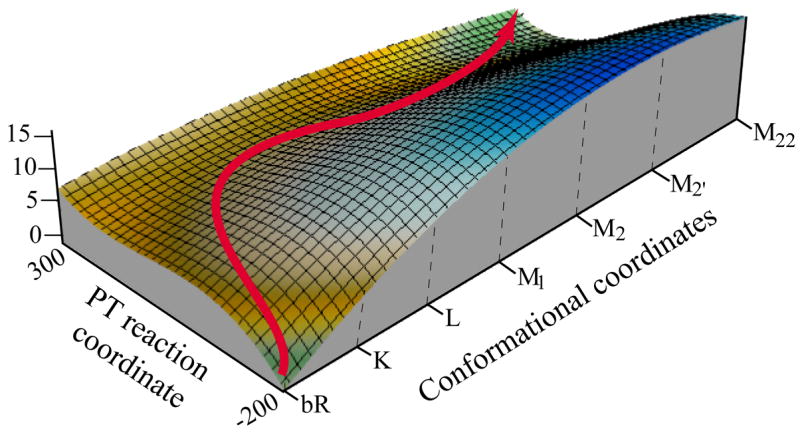
A qualitative description of the free energy surface in the space defined by the protein conformation and the PT coordinate. The figure describes the path for the overall PT process. It also illustrates the coupling between the protein structural change and the PT surfaces. Basically, upon moving from K to M22, the average distance between the donor and the acceptor increases and the ion pair energy increases. This, in turn, drives the PT process.
Fig. 6 can be considered as a semi-quantitative estimate of the relevant landscape, where the changes in the y direction are qualitative and the changes in the x direction are more quantitative. With this in mind, we provide in the figure a tentative PT path. In this path the proton is attached to the SB in states bR and K, in agreement with experimental observations (e.g., ref. [2]). In the subsequent state, the situation is more complicated due to uncertainty in the X-ray structures (e.g., the calculated difference between M1 and M2 may reflect inaccuracy in the corresponding X-ray structures; see also concluding remarks) and/or in the calculations. Nevertheless, the overall trend is very reasonable. In state L the proton can be on both the SB and Asp85 and, in some stage of the transfer to the M2 configuration, it moves entirely to Asp85 (probably an improved treatment or improved structure of M1 will lead to a transfer at M1). The effective activation free energy is about 10 ± 2 kcal/mol, and the addition of nuclear quantum mechanical (NQM) corrections reduces the barrier by about 1–2 kcal/mol [84]. Thus, the calculated barrier is 8 ± 2 kcal/mol. This leads to an observed rate constant of 10 −5 ± 2 in agreement with experimental estimates [85] that assigned a rate of 105 s−1 for the L → M1 transition. Note that Fig. 6 provides, for the first time, a picture of the coupling between the protein conformational change and the PT process. This issue will be further discussed in section IV.
One of the interesting issues that can be explored by the present approach is the nature of the barrier for the PT process. In order to explore this question, we evaluate the electrostatic contribution to the reorganization energy in several PT steps (Table 2). In general, as described in many of our works (e.g., [74]), we can describe the barrier for a PT process by the modified Marcus formula [59],
| (14) |
where λ is the reorganization energy and H12 is the mixing term that mixes states 1 and 2. The effect of the environment manifests itself in both ΔG0 and λ. As long as the distance between the donor and acceptor is sufficiently small and H12 is large, the barrier is mainly determined by ΔG0. However, once the distance is larger than 4.0 Å, the barrier starts to increase very fast due to both the exponential decrease in H12 and the increase in the solvent contribution to λ (that goes like 1/R [79]). This situation means that the PT process would usually occur at a relatively short donor acceptor distance, even if the initial and the final distance is relatively large [86]. Here we have two possibilities, either a transfer through an intervening group (as proposed in refs. [18, 40]), or reduction of the proton acceptor distance. Now, in the present work it was found that a direct PT could be accomplished in each of the intermediate steps at a small cost of change in the donor and acceptor distance. Similarly, the displacement of the intermediate water molecule(s) occurs at very low cost. It is important to clarify that this type of protein plus solvent rearrangement might be hard to obtain in QM/MM studies that freeze parts of the protein (see discussion in [87]). In fact, our study indicated that it is essential to use very extensive sampling in order to obtain the correct trend in the calculated activation barriers.
III.2 Validation by Electrostatic and pKa Calculations
In addition to the brute-force EVB calculations of the previous section, it is useful and important to establish the nature of the energy difference between the corresponding reactant and product states. More specifically, the PT process involves the reaction
| (15) |
and the corresponding PT free energy plays a key role in establishing the barrier for the PT process (see Eq. 4). Here we evaluate ΔGPT and its components by both the semi-macroscopic PDLD/S-LRA method (Table 3) and the microscopic QCFF/PI-EVB method, but in this case by using an electrostatic charging cycle rather than an EVB mapping (Table 4).
Table 4.
QCFF/PI-EVB energetics of the ion pair statesa
| System | b | pKa (SBH+) b | c | Δ GPTd |
|---|---|---|---|---|
| water | – | 7.0 | – | 6.5 |
| bR | 13.0 | 16.4 | 2.2 | 7.7 |
| K | 11.0 | 15.0 | 3.0 | 8.2 |
| L | 9.0 | 13.5 | 1.8 | 6.3 |
| M1 | 11.0 | 15.0 | 2.0 | 5.8 |
| M2 | 7.0 | 12.1 | − 14.0 | − 4.0 |
| M2′ | 4.0 | 9.9 | − 17.0 | − 6.0 |
| M22 | 7.0 | 12.1 | − 18.0 | − 7.0 |
Microscopic free energies in kcal/mol, where R82 and D212 are ionized, Asp85 is designated by A in the equations below.
is the change in the solvation of the Schiff base upon moving from solution to the protein site. The corresponding absolute pKa (when D85 is ionized) is given in pKa units.
, where the ion pair is held at the same distance in water and in the protein.
is evaluated by, , where is the gas-phase interaction within the ion pair and
As seen from the tables, the pKa of the Schiff base in the (+ −) base pair in bR is about 9 in the PDLD/S-LRA calculation and about 16 in the microscopic calculations, whereas the observed value is about 13.3 [88–90]. The overestimates of the pKa in the microscopic calculations are associated with the well-known problems of insufficient compensation of charge-charge interactions in proteins [76, 91]. This problem is likely to be more serious in QM/MM energy minimization studies, since they do not allow sufficient protein reorganization. Although the increase in the calculated Schiff base pKa is overestimated by the microscopic calculations, the error in the energy of the ion-pair (which determines the PT energy) should be significantly smaller.
We would like to reemphasize at this point that obtaining different results by different methods does not mean that our approach is less reliable than other approaches that used a single model. First, as stated above, even macroscopic approaches obtained very different results with different representations of the system [19]. As to the seemingly stable results of the QM/MM studies [18, 40], these studies have not considered drastically different protein structures and drastically different protein ionization states (see discussion on a related problem in [87]). In fact, the QM/MM community has very recently started to appreciate this issue [92].
III.3 What is the role of the chromophore twist in controlling the pKa changes?
An interesting proposal that has not been explored by consistent studies, until now, is the idea that the twist of the chromophore provides a major driving force for the PT step and for the overall pumping process [14, 23, 93]. Obviously, it is impossible to explore this process by standard continuum models, since such models do not consider the coupling between the chromophore internal configuration and its pKa. Using gas-phase calculations that evaluate the change in the chromophore pKa as a function of the torsional angle are also not so useful, as, even with the current structural information, it is not clear as to what the exact torsional angles in the proteins are. Even standard QM/MM studies are unlikely to provide a consistent tool for analyzing the above proposal, since the issue is not only whether the pKa can be changed by twisting the chromophore but also whether the change in twist during the internal protein relaxation leads to change in the PT energy. This issue cannot be resolved without careful sampling focused on the coupling between the chromophore structural deformation and the PT energy. In order to explore this challenging issue, we designed a special approach that separates the protein steric effect from its electrostatic counterpart. That is, we evaluated the pKa of the SBH+ and ΔGPT in the different protein configurations, while setting the protein chromophore electrostatic coupling to zero. We then performed extensive relaxation of the chromophore/protein complex allowing it to respond to the relaxation of the chromophore but imposing on the chromophore a Cartesian restraint that increases quadratically as a function of the difference between the chromophore coordinates and the corresponding X-ray values. Using this model, we performed a series of systematic simulations and the corresponding results are summarized in Table 5. The results for the large value of the constraints are clearly not realistic since the X-ray structure cannot be sufficiently accurate to define the exact torsional angles (a possible exception is the recent work of ref. [82]). The lower values of the constraint results in a situation where the chromophore structure is consistently restrained by the protein cavity of the given configuration and these values are probably more relevant to our analysis.
Table 5.
The effect of the chromophore structure on ΔpKa and on the corresponding PT energya
| System | Δ Δ GPT unrelaxed (K=30) | ΔΔ GPT (K=0.3) | Δ pKa (SBH+) b (K=0.3) |
|---|---|---|---|
| bR | – | – | – |
| K | 0 | 1 | − 1 |
| L | 2 | 0 | 1 |
| M1 | 10 | 0 | 2 |
| M2 | 5 | − 19 | |
| M2′ | 8 | − 10 | |
| M22 | − 2 | 7 | − 2 |
ΔΔGPT is the change in the proton transfer energy (relative to bR). The calculations are done after setting to zero the protein electrostatic effect and only considering the protein strain effect. The changes in ΔΔ GPT for the M2, M2′ and M22 states are due to the changes in the intramolecular ion pair energy.
The Δ pKa (SBH+) is calculated when Asp85 is uncharged, so that the change in the ion-pair distance (which does not reflect the chromophore deformation) will not be reflected in the results.
As seen from the table, the intrinsic structural changes in the K→M1 do not lead to a significant change in ΔGPT. Furthermore, the changes in the PT energy in the subsequent steps were found to be almost entirely due to the change in the donor-acceptor distance and not to the change in the chromophore pKa. Overall, our finding provides what is, at present, the most consistent study of the proposal that the chromophore twist leads to a pKa change that drives the PT process [23], and we found the corresponding contribution to be very small.
It is useful to point out at the conclusion of this section that our study is very different from other attempts to correlate assumed twist with pKa change. In particular, we allow the chromophore to relax in both the protonated and deprotonated forms (within the given protein structural constraints). The corresponding relaxation stabilizes the system by twists of single and double bonds that tend to minimize the conformational effects on the energy difference between the two ionization states (and the corresponding pKa changes).
Overall, we proved that the change in ΔGPT for the K → L step is not associated with the intrinsic effect of the chromophore twist but with the change in the protein-chromophore electrostatic interactions. The change in subsequent steps is due to the increase in the donor acceptor distance of the protein. These changes are induced by the chromophore strain as proposed in our earlier studies (e.g., [94]), but this is not due to the chromophore pKa change.
III.4 The charge separation energy and the protein structural relaxation
The present work seems to offer, for the first time, a relatively stable correlation between the K→M22 structural changes and the energetics of the primary PT in bR. That is, our early work has proposed that the light energy must be converted to charge-separation energy [1, 3]. Other works [2, 9, 35, 48] also implied that the light energy is probably converted to electrostatic energy but could not establish this point by a consistent energy based study. For example, Schobert et al. [43] have not included the protein in the calculations and Song et al. [19] have not considered the possible effect of the protein relaxation energy. More significantly, none of the previous works were able to obtain a clear relationship between the change in the protein configuration and the change in the PT energetics and to identify the origin of this change. As found here it is extremely hard to obtain a unique trend and this cannot be done by just taking the X-ray set and trying to use them with a limited relaxation. Apparently, it is crucial to let the protein and the chromophore fully relax during the simulated PT profile in order to capture the dependence of the barrier on the average donor acceptor distance, or more specifically, on the energy of the ion pair state. Now it is possible to conclude that the light energy that leads to the isomerization process is converted to an increase in the effective distance between the Schiff base and its counterion (see below), which in turn drives the PT process.
Establishing that the light energy is converted to charge-separation energy is not a trivial task. That is, simple energy minimization runs will give different energy distributions and distances, depending on the starting point of the simulations. Only extensive simulations with converging free energies can be used to examine the overall trend. Thus, our conclusions are based on examining the overall contributions to the PT process using the LRA approach, which allows one to look for additive energy contributions (it should be noted that this is not possible with FEP calculations). The resulting energy contributions for bR, K, L, M2 and M22, which are given in Table 6, indicate that the Coulombic charge-charge energy of the ion-pair state decreases and is not fully compensated for by the increase in the solvation energy. Thus, while charge separation in water would lead to a very small increase in energy, it leads to major energy storage in bR
We also give in Fig. 7 typical snapshots of the structures obtained from EVB mappings, when these have been performed for 90% of the overall PT step (a similar trend emerges at the beginning of the mappings). As seen from the figure, the distance increases on going from K to M22. The distances depicted are smaller than the X-ray distances, since our mapping process involves the work of bringing the donor and the acceptor together. However, the picture clearly shows the overall trends of a charge separation process.
Figure 7.
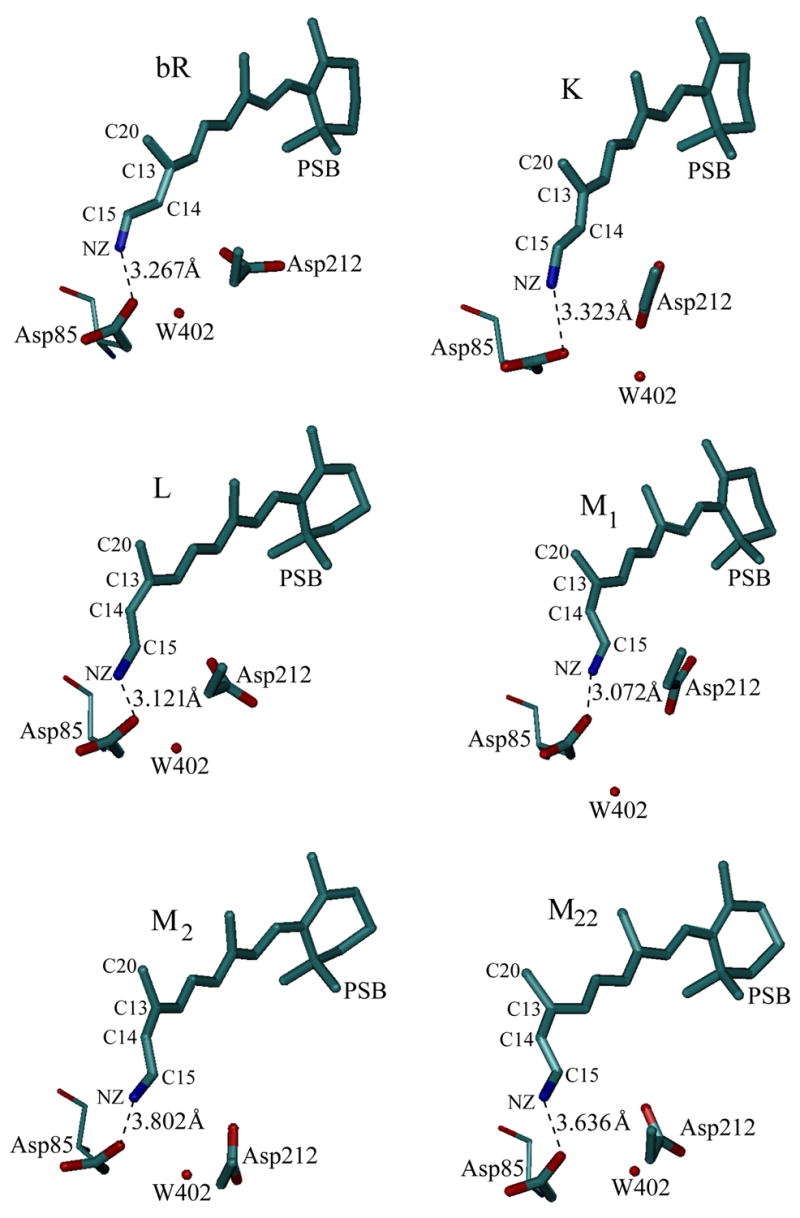
The structural changes during the K to M22 transition. As seen from the figure, the average donor-acceptor distance increases upon moving from L to M22.
The conversion of the charge separation energy to a change in the PT energy is very different from some alternative proposals. First, it is very different from the proposal that the chromophore twist during the PT process leads to a change in the Schiff base pKa (see Section III.3). Second, this process is very different from the idea that the directionality of the hydrogen bond between the Schiff base N–H and Asp85 is responsible for the pKa change and the PT process [93, 95]. That is, a gas-phase ab initio study of Scheiner and Hillenbrand [93] that considers (H2CHNH····NH3)+ as a minimal model for the SBH+ in the protein, concludes that the orientation of the hydrogen bond relative to the acceptor lone pair plays a major role in controlling the pKa and the PT energetics. Unfortunately, this influential study provided a physically incorrect picture of the control of pKa values by a protein, since it overlooked the enormous compensatory effects due to other polar interactions, which could be obtained by consistent pKa studies even at that time (e.g., [96]). Obviously, hydrogen bonds do contribute in a major way to pKa values in protein by solvating the ionized form [96, 97], and the same is true for bR (e.g., [98]). In other words, the overall solvation of the protonated Schiff base involves contributions from all polar elements in the system, viz., permanent dipoles (due to the protein polar groups and water molecules), induced dipoles and ionized residues (including Asp85). However, the change in pKa during the K→M22 process is not associated with the hydrogen bond orientations but with the overall change in the ion pair distance and its compensation by the reorientation of the protein polar groups. It should also be clarified at this point that our conclusions are based on very significant sampling that allows the hydrogen bonds to assume their optimal orientations, and on very extensive studies of the role of hydrogen bonds in proteins (e.g., [99]). We would also like to clarify that although the problems associated with conclusions drawn from gas-phase calculations of electrostatic effects in proteins are now widely appreciated, they still persist in some cases due to the simplicity of the corresponding models. Similar problems are associated with the overemphasizing of the role of a single water molecule (see below).
IV. Concluding Remarks
This work explored the energetics of the primary PT in bacteriorhodopsin by combining the QCFF/PI and the EVB method in a unified QM/MM framework. This approach allowed us to explore the free energy surface for the PT from the SBH+ to Asp85 in the combined landscape of the protein conformational change and the solute proton transfer reaction coordinate. Our study reproduced the observed activation barrier for three primary PTs and indicated that this transfer occurs at the L→M step. It was found that the PT occurs easily between the donor and acceptor without the need of transfer through intervening water molecules or other groups. The barrier appeared to be mainly sensitive to the energy difference between the ion pair and the neutral state.
In general, the PT occurs through a TS with a distance of 2.5 Å between the donor and the acceptor. However, when the protein stabilizes structures with larger separation, the TS may involve a longer distance of up to 2.9 Å. This issue has been analyzed very systematically in a recent paper that deals with the related problem of hydride transfer reactions [100]. At any rate, the possible assumption that the PT must occur through water molecules (since these molecules are observed in the X-ray structure) overlooks the fact that the water molecules can be easily moved away. In this respect, it is useful to comment here on the relationship between the present findings and the results of a recent instructive semi-empirical QM/MM study of the same process [18]. Although QM/MM studies are promising, they are not involved in full free energy calculations and are not calibrated by studies of the same system in solution (e.g., the barrier for PT between SBH+ and Asp− in solution was not reported). In fact, our extensive experience in evaluating free energies of proton transport (e.g., refs. [37, 74], and in exploring the convergence of QM/MM free energy calculations [57, 101], as well as studies of QM/MM energy minimization [87], indicated that when one is dealing with a PT process in condensed phase, it is essential to use very extensive sampling, and without doing so the results may be quite inaccurate. This conclusion was further supported by the present study. In fact, any assertion that the PT occurs through intervening water molecules must involve careful comparison of the free energy of transfer with and without the PT through water molecules. Such a comparison cannot be accomplished by energy minimization-type treatments, which do not consider the protein rearrangements in the different paths (see more discussion below). Overall, we believe that at present the QCFF/PI-EVB provides a quite robust and reliable approach in view of its calibrations on PT processes in solutions and proteins. Furthermore, the QCFF/PI has been shown to reproduce conformational and vibrational properties of retinal, SB, SBH+ and other conjugated molecules in a reliable way, and its coupling to the protein electrostatic potential, including the protein polarizable force field, has been extensively examined (e.g., [28, 73]). Here a key point of the calculation is the ability to combine consistently a complete treatment of the conformational relaxation of the chromophore and a very large protein sphere, as well as the ability to reproduce the observed pKa values of the protein and other groups. The QCFF/PI-EVB also allows us to explore the crucial effects of the protein reorganization energy, which is found to play a significant role in establishing the barrier for the PT process.
The present work placed major emphasis on the energetics of the primary PT in bacteriorhodopsin. This issue is important, since it can provide major clues about the nature of light induced processes in bioenergetics. However, a consistent analysis of the relevant energetics is far from simple. In addition to the convergence problems mentioned above (that present a challenge to QM/MM studies), we have to deal with the fact that classical MM or semimacroscopic approaches cannot capture the delocalization effects of the chromophore. This is another reason as to why we believe that the QCFF/PI–EVB free energy calculations provide the optimal strategy to explore problems that were not, until now, explored quantitatively. Thus, for example, it allows us to explore the proposal that the twist of the chromophore leads to a change of the Schiff base pKa and to demonstrate that the corresponding effect is quite small (see section III.3).
An example of the importance of proper treatment is the attempt to quantify the proposal that some of the initial light energy is stored in the early ground state intermediates as a strain in the chromophore [94, 102]. Gas-phase ab initio calculations of the type used by Schobert et al. [43] are not expected to provide proper estimates of the strain in the chromophore, since such studies do not include the effect of the protein. Even regular QM/MM energy minimization studies cannot capture such strain effects, as was demonstrated in our study of B12 enzymes [103]. At any rate, it is quite obvious that the relaxation of the chromophore after the initial surface crossing process generates a significant strain effect, as was concluded in the related case of rhodopsin (e.g., [94, 104]), and as found in simulations of bR [32]. We like to note, however, that the distribution of the strain energy in the K to M22 step cannot be assessed by brute force evaluation of the change of the protein internal energy. Thus, we look for a much more practical and reliable approach by using the LRA approach. This allows us to evaluate the overall change in the electrostatic energy of the chromophore/protein system and the change of the chromophore/protein strain energy. That is, the LRA treatment considers only the protein-chromophore electrostatic interactions, since the protein-protein interactions cancel each other in the Δε of Eq. 13 (where the protein structure is identical for ε1 and ε2). This allows us to produce the overall surface of Fig. 6, which describes the coupling of the PT energy and the protein self-energy.
It is important to clarify that the storage of strain energy cannot be explored by taking the X-Ray structure at its face value or by imposing a very strong constraint on the X-ray structure. Part of the problem is associated with the fact that the X-ray structure reflects limited resolution, including the use of non-perfect energy functions in the structure refinement. A more serious problem is due to the fact that the system must reflect the equilibrium structure of the protein/chromophore model. Thus, being at this minimum with a model that does not reproduce the exact protein structure will give more reliable strain effects than being at the exact X-ray structure but out of the minimum of the given force field.
With the above comments in mind, we view the availability of different X-ray structures (despite some controversy about their quantitative validity [18, 52]) more as a guide for the overall change in the protein structure, rather than as exact structural information. Having this guide is the reason we feel that the overall calculated trend of the charge separation effect is correct. Furthermore, the availability of the X-ray structural changes allows us to explore the effect of the protein reorganization. That is, one of the interesting findings of the present work is the estimate of the change in the protein internal energy (the protein reorganization energy) during the primary PT. Our use of Eq. 13 indicated that the reorganization energy in the bR to M22 step is ~20 kcal/mol. Thus, the overall decrease in the free energy of the system (in the transfer from the (SBH+ A−) state in bR to the (SB HA) state in M22) reflects a compensation of the negative PT energy and the positive reorganization energy of the bR → M22 step. In this way the initial strain energy of the chromophore is still stored in the protein reorganization energy, even at the M22 step. Our finding explains for the first time how the initial strain energy of the chromophore is used to drive the PT process and thus, provides the first glimpse of the energetics of the protein conformational change.
It might be useful to expand here the discussion of the interesting studies of Bondar et al. [18, 40], who attempted to explore the energetics of the primary PT by extensive search of the relevant path on a semiempirical QM/MM surface. Although these studies used a sophisticated search approach, they did not use free energy calculations, thus suffering from the general problems of QM/MM energy minimization approaches. Furthermore, as stated above, refs. [18, 40] evaluated energy barriers rather than activation free energies and most probably could not take into account consistently large structural reorganization of the protein. This problem leads to overemphasis on transfer through bridging water, since the “work function” (see [86]) of bringing the donor and acceptor together would be overestimated. Furthermore, the energy of the protein conformational changes cannot be assessed by an energy minimization procedure. One of the main problems with the approach of ref. [18] is probably the fact that it has not been calibrated or validated on PT reactions in water or in protein where the PT path is known, and also, it has not presented results obtained with significantly different starting protein structures.
Sometimes there is a tendency to assign a special role to internal water molecules in bR, in the overall cycle of bR, and even in the primary PT [17, 40]. Obviously, the involvement of water molecules as a part of the overall PT path is a valid and likely mechanism, although the energetics of such a path must be examined by considering the energetics of the protonated H3O+ sites rather than the orientation of the neutral water molecules (see [75] for a discussion of the overall issue). However, the energetics of the interaction between internal water molecules [17, 40] and the ion pair state does not present any special feature, since it is simply a part of the overall generalized solvation by the protein polar groups and bound water molecules [97, 105]. Looking at the contribution of the bound state (e.g., the assertion of Hayashi et al. [106] that a single water is responsible for the ionic state) as a special contribution is extremely problematic.
This point can be realized by trying to describe the solvation of ions in water by looking at the contributions of a single water molecule (as was indeed done during the early days of solvation studies by some leading groups (e.g., [107, 108])). In fact, in protein simulations, it is always recommended to insert water in all the available intraprotein space and around the protein, rather than to be preoccupied with the water molecules observed in the X-ray structure.
As shown in Fig. 6, the overall proton translocation occurs in the combined protein/chromophore/proton landscape. The initial PT changes the charge distribution of the systems from an ion pair to a neutral pair and this leads to a significant reorganization of the protein/solvent environment. Further relaxation of the chromophore and further response to the change in charge distribution drives the subsequent protein structural reorganization and the subsequent proton pumping. This overall process is a result of the conversion of light energy to torsional motion and to a relaxation process that involves both charge separation and some relaxation of torsional strain. Although the details of the relaxation process have not been fully quantified in this study, they clearly resemble the major points envisioned in our original work of 1979 [1]. Here it is important to recognize the following points: (a) The main changes in effective pKa are due to changes in environment and donor-acceptor distances, and not to the torsional distortion of the chromophore; (b) Although the initial bR → K transition did not involve a significant change in the relative energy of the ion pair and neutral pair, the subsequent transfer to K and M involved a significant change and thus corresponds to a significant change in electrostatic energy. Perhaps a refined picture (relative to the 1979 idea [1]) should consider an initial relaxation of the light energy to torsional strain, which is then released in a charge separation process. This is, in fact, the process suggested for rhodopsin in the first analysis that tried to estimate the energy storage in this system using a realistic yet simplified deformable cavity model [94].
The present approach establishes that the initial charge-separation process, which leads to the primary PT, has sufficient excess free energy to drive the subsequent PT process. Although the energetics of the subsequent events have been considered before [1, 20, 34], the activation barriers for the PT steps were not evaluated. Thus, we expect that a more detailed picture will emerge from future studies that will follow our general approach for modeling the energetics and kinetics of proton transport (PTR) in proteins (e.g., [74, 109, 110]). Such studies that can use the analysis of the present work in establishing the initial state can help in advancing our understanding of the proton pumping in bR.
Table 6.
LRA energy contributions to the PT process a
| Contribution | bR | K | L | M2 | M22 |
|---|---|---|---|---|---|
| ΔGQQ | − 73 | − 75 | − 76 | − 70 | − 69 |
| ΔGsol | − 34 | − 43 | − 42 | − 37 | − 39 |
| ΔGelec | − 107 | − 118 | − 118 | − 107 | − 108 |
Energies in kcal/mol. ΔGQQ and ΔGsol designate the LRA contributions from the gas-phase charge-charge ion pair interaction (between SBH+ and Asp−), and the generalized solvation of the ion pair by its proton environment.
Acknowledgments
We thank the High Performance Computing Center (HPCC) at the University of Southern California, Los Angeles, for computational facilities. This work was supported by the NIH grant GM40283. We are grateful to Dr. Janos Lanyi for stimulating discussions. SBS thanks the University of Colorado at Colorado Springs for computational facilities used to carry out a portion of this work.
Abbreviations
- PTR
Proton transport
- PT
Proton transfer
- SB
Schiff base
- EVB
Empirical valence bond
- QCFF/PI
quantum-mechanical consistent force field for pi-electron
- PDLD/S
protein dipoles – Langevin dipoles
- LRF
local reaction field
- FEP/US
free energy perturbation/umbrella sampling
- TS
transition state
- LRA
linear response approximation
- QM/MM
quantum mechanics-molecular mechanics
- SCAAS
surface constraint all atom solvent
- MD
molecular dynamics
- NQM
nuclear quantum mechanical
Footnotes
Publisher's Disclaimer: This is a PDF file of an unedited manuscript that has been accepted for publication. As a service to our customers we are providing this early version of the manuscript. The manuscript will undergo copyediting, typesetting, and review of the resulting proof before it is published in its final citable form. Please note that during the production process errors may be discovered which could affect the content, and all legal disclaimers that apply to the journal pertain.
References
- 1.Warshel A. Conversion of light energy to electrostatic energy in the proton pump of halobacterium halobium. Photochem Photobiol. 1979;30:285–290. doi: 10.1111/j.1751-1097.1979.tb07148.x. [DOI] [PubMed] [Google Scholar]
- 2.Lanyi JK. Bacteriorhodopsin. Annu Rev Physiol. 2004;66:665–688. doi: 10.1146/annurev.physiol.66.032102.150049. [DOI] [PubMed] [Google Scholar]
- 3.Warshel A. Electrostatic basis of structure-function correlation in proteins. Acc Chem Res. 1981;14:284–290. [Google Scholar]
- 4.Warshel A, Parson WW. Dynamics of biochemical and biophysical reactions: insight from computer simulations. Quart Rev Biophys. 2001;34:563–670. doi: 10.1017/s0033583501003730. [DOI] [PubMed] [Google Scholar]
- 5.Wikstrom MKF. Proton pump coupled to cytochrome-c oxidase in mitochondria. Nature. 1977;266:271–273. doi: 10.1038/266271a0. [DOI] [PubMed] [Google Scholar]
- 6.Michel H, Behr J, Harrenga A, Kannt A. Cytochrome c oxidase: structure and spectroscopy. Annu Rev Biophys Biomol Struct. 1998;27:329–56. doi: 10.1146/annurev.biophys.27.1.329. [DOI] [PubMed] [Google Scholar]
- 7.Mitchell P. Coupling of phosphorylation to electron and hydrogen transfer by a chemi-osmotic type of mechanism. Nature. 1961;191:144–148. doi: 10.1038/191144a0. [DOI] [PubMed] [Google Scholar]
- 8.Mathies R, Lin S, Ames J, Pollard W. From femtoseconds to biology: mechanism of bacteriorhodopsin’s light-driven proton pump. Annu Rev Biophys Biophys Chem. 1991;20:491–518. doi: 10.1146/annurev.bb.20.060191.002423. [DOI] [PubMed] [Google Scholar]
- 9.Subramaniam S, Henderson R. Molecular mechanism of vectorial proton translocation by bacteriorhodopsin. Nature. 2000;406:653–7. doi: 10.1038/35020614. [DOI] [PubMed] [Google Scholar]
- 10.Henderson R. Purple membrane from halobacterium-halobium. Annu Rev Biophys Bioeng. 1977;6:87–109. doi: 10.1146/annurev.bb.06.060177.000511. [DOI] [PubMed] [Google Scholar]
- 11.Oesterhelt D, Tittor J. 2 Pumps, one principle - Light-driven ion-transport In halobacteria. Trend Biochem Sci. 1989;14:57–61. doi: 10.1016/0968-0004(89)90044-3. [DOI] [PubMed] [Google Scholar]
- 12.Stoeckenius W, Bogomolni RA. Bacteriorhodopsin And Related Pigments Of Halobacteria. Annu Rev Biochem. 1982;51:587–616. doi: 10.1146/annurev.bi.51.070182.003103. [DOI] [PubMed] [Google Scholar]
- 13.Luecke H. Atomic resolution structures of bacteriorhodopsin photocycle intermediates: the role of discrete water molecules in the function of this light-driven ion pump. Biochim Biophys Acta. 2000;1460:133–156. doi: 10.1016/s0005-2728(00)00135-3. [DOI] [PubMed] [Google Scholar]
- 14.Herzfeld J, Lansing JC. Magnetic resonance studies of the bacteriorhodopsin pump cycle. Annu Rev Biophys Biomol Struct. 2002;31:73–95. doi: 10.1146/annurev.biophys.31.082901.134233. [DOI] [PubMed] [Google Scholar]
- 15.Neutze R, Pebay-Peyroula E, Edman K, Royant A, Navarro J, Landau EM. Bacteriorhodopsin: a high-resolution structural view of vectorial proton transport. Biochim Biophys Acta-Biomembranes. 2002;1565:144–167. doi: 10.1016/s0005-2736(02)00566-7. [DOI] [PubMed] [Google Scholar]
- 16.Subramaniam S, Lindahl I, Bullough P, Faruqi AR, Tittor J, Oesterhelt D, Brown L, Lanyi J, Henderson R. Protein conformational changes in the bacteriorhodopsin photocycle. J Mol Biol. 1999;287:145–161. doi: 10.1006/jmbi.1999.2589. [DOI] [PubMed] [Google Scholar]
- 17.Garczarek F, Gerwert K. Functional waters in intraprotein proton transfer monitored by FTIR difference spectroscopy. Nature. 2006;439:109–112. doi: 10.1038/nature04231. [DOI] [PubMed] [Google Scholar]
- 18.Bondar AN, Fischer S, Smith JC, Elstner M, Suhai S. Key role of electrostatic interactions in bacteriorhodopsin proton transfer. J Am Chem Soc. 2004;126:14668–14677. doi: 10.1021/ja047982i. [DOI] [PubMed] [Google Scholar]
- 19.Song YF, Mao JJ, Gunner MR. Calculation of proton transfers in bacteriorhodopsin bR and M intermediates. Biochemistry. 2003;42:9875–9888. doi: 10.1021/bi034482d. [DOI] [PubMed] [Google Scholar]
- 20.Ferreira AM, Bashford D. Model for proton transport coupled to protein conformational change: Application to proton pumping in the bacteriorhodopsin photocycle. J Am Chem Soc. 2006;128:16778–16790. doi: 10.1021/ja060742d. [DOI] [PubMed] [Google Scholar]
- 21.Royant A, Edman K, Ursby T, Pebay-Peyroula E, Landau EM, Neutze R. Helix deformation is coupled to vectorial proton transport in the photocycle of bacteriorhodopsin. Nature. 2000;406:645–648. doi: 10.1038/35020599. [DOI] [PubMed] [Google Scholar]
- 22.Warshel A. In: Methods in Enzymology. Packer L, editor. Academic Press Inc.; London: pp. 578–587. 1986. [Google Scholar]
- 23.Schulten K, Tavan P. A mechanism for the light driven proton pump of Halobacterium halobium. Nature. 1978;272:85–86. doi: 10.1038/272085a0. [DOI] [PubMed] [Google Scholar]
- 24.Gat Y, Sheves M. A mechanism for controlling the pKa of the retinal protonated Schiff-Base in retinal proteins - a study with model compounds. J Am Chem Soc. 1993;115:3772–3773. [Google Scholar]
- 25.Kalisky O, Ottolenghi M, Honig B, Korenstein R. Environmental-Effects on Formation and Photoreaction of the M-412 Photoproduct of Bacteriorhodopsin - Implications for the Mechanism of Proton Pumping. Biochemistry. 1981;20:649–655. doi: 10.1021/bi00506a031. [DOI] [PubMed] [Google Scholar]
- 26.Warshel A, Ottolenghi M. Kinetic and Spectroscopic Effects of Protein-Chromophore Electrostatic Interactions in Bacteriorhodopsin. Photochem Photobiol. 1979;30:291. doi: 10.1111/j.1751-1097.1979.tb07149.x. [DOI] [PubMed] [Google Scholar]
- 27.Birge RR. Nature of the primary photochemical events in rhodopsin and bacteriorhodopsin. Biochim Biophys Acta. 1990;1016:293–327. doi: 10.1016/0005-2728(90)90163-x. [DOI] [PubMed] [Google Scholar]
- 28.Warshel A, Chu ZT. Nature of the surface crossing process in bacteriorhodopsin: Computer simulations of the quantum dynamics of the primary photochemical event. J Phys Chem B. 2001;105:9857–9871. [Google Scholar]
- 29.Hayashi S, Tajkhorshid E, Pebay-Peyroula E, Royant A, Landau EM, Navarro J, Schulten K. Structural determinants of spectral tuning in retinal proteins-bacteriorhodopsin vs sensory rhodopsin II. J Phys Chem B. 2001;105:10124–10131. [Google Scholar]
- 30.Houjou H, Inoue Y, Sakurai M. Study of the opsin shift of bacteriorhodopsin: Insight from QM/MM calculations with electronic polarization effects of the protein environment. J Phys Chem B. 2001;105:867–879. [Google Scholar]
- 31.Sakurai M, Sakata K, Saito S, Nakajima S, Inoue Y. Decisive role of electronic polarization of the protein environment in determining the absorption maximum of halorhodopsin. J Am Chem Soc. 2003;125:3108–3112. doi: 10.1021/ja027342k. [DOI] [PubMed] [Google Scholar]
- 32.Warshel A, Chu ZT, Hwang JK. The dynamics of the primary event in rhodopsins revisited. Chem Phys. 1991;158:303–314. [Google Scholar]
- 33.Hayashi S, Tajkhorshid E, Schulten K. Molecular dynamics simulation of bacteriorhodopsin’s photoisomerization using ab initio forces for the excited chromophore. Biophys J. 2003;85:1440–1449. doi: 10.1016/S0006-3495(03)74576-7. [DOI] [PMC free article] [PubMed] [Google Scholar]
- 34.Spassov VZ, Luecke H, Gerwert K, Bashford D. pKa calculations suggest storage of an excess proton in a hydrogen-bonded water network in bacteriorhodopsin. J Mol Biol. 2001;312:203–219. doi: 10.1006/jmbi.2001.4902. [DOI] [PubMed] [Google Scholar]
- 35.Sampogna RV, Honig B. Environmental-Effects on the Protonation States of Active-Site Residues in Bacteriorhodopsin. Biophysical Journal. 1994;66:1341–1352. doi: 10.1016/S0006-3495(94)80925-7. [DOI] [PMC free article] [PubMed] [Google Scholar]
- 36.Sham YY, Muegge I, Warshel A. Simulating proton translocations in proteins: probing proton transfer pathways in the Rhodobacter sphaeroides reaction center. Proteins: Structure, Function, and Genetics. 1999;36:484–500. [PubMed] [Google Scholar]
- 37.Braun-Sand S, Strajbl M, Warshel A. Studies of Proton Translocations in Biological Systems: Simulating Proton Transport in Carbonic Anhydrase by EVB Based Models. Biophys J. 2004;87:2221–2239. doi: 10.1529/biophysj.104.043257. [DOI] [PMC free article] [PubMed] [Google Scholar]
- 38.Rousseau R, Kleinschmidt V, Schmitt UW, Marx D. Modeling protonated water networks in bacteriorhodopsin. Physical Chemistry Chemical Physics. 2004;6:1848–1859. [Google Scholar]
- 39.Mathias G, Marx D. Structures and spectral signatures of protonated water networks in bacteriorhodopsin. Proc Natl Acad Sci USA. 2007;104:6980–6985. doi: 10.1073/pnas.0609229104. [DOI] [PMC free article] [PubMed] [Google Scholar]
- 40.Bondar AN, Elstner M, Suhai S, Smith JC, Fischer S. Mechanism of primary proton transfer in bacteriorhodopsin. Structure. 2004;12:1281–1288. doi: 10.1016/j.str.2004.04.016. [DOI] [PubMed] [Google Scholar]
- 41.Takeda K, Matsui Y, Kamiya N, Adachi S, Okumura H, Kouyama T. Crystal structure of the M intermediate of bacteriorhodopsin: Allosteric structural changes mediated by sliding movement of a transmembrane helix. J Mol Biol. 2004;341:1023–1037. doi: 10.1016/j.jmb.2004.06.080. [DOI] [PubMed] [Google Scholar]
- 42.Luecke H, Schobert B, Richter HT, Cartailler JP, Lanyi JK. Structure of bacteriorhodopsin at 1.55 angstrom resolution. J Mol Biol. 1999;291:899–911. doi: 10.1006/jmbi.1999.3027. [DOI] [PubMed] [Google Scholar]
- 43.Schobert B, Cupp-Vickery J, Hornak V, Smith SO, Lanyi JK. Crystallographic structure of the K intermediate of bacteriorhodopsin: Conservation of free energy after photoisomerization of the retinal. J Mol Biol. 2002;321:715–726. doi: 10.1016/s0022-2836(02)00681-2. [DOI] [PubMed] [Google Scholar]
- 44.Lanyi JK, Schobert B. Mechanism of proton transport in bacteriorhodopsin from crystallographic structures of the K, L, M1, M2, and M2′ intermediates of the photocycle. J Mol Biol. 2003;328:439–450. doi: 10.1016/s0022-2836(03)00263-8. [DOI] [PubMed] [Google Scholar]
- 45.Schobert B, Brown LS, Lanyi JK. Crystallographic intermediates of structures of the M and N bacteriorhodopsin: Assembly of a hydrogen-bonded chain of water molecules between Asp-96 and the retinal Schiff base. J Mol Biol. 2003;330:553–570. doi: 10.1016/s0022-2836(03)00576-x. [DOI] [PubMed] [Google Scholar]
- 46.Sass HJ, Buldt G, Gessenich R, Hehn D, Neff D, Schlesinger R, Berendzen J, Ormos P. Structural alterations for proton translocation in the M state of wild-type bacteriorhodopsin. Nature. 2000;406:649–53. doi: 10.1038/35020607. [DOI] [PubMed] [Google Scholar]
- 47.Luecke H, Schobert B, Richter HT, Cartailler JP, Lanyi JK. Structural changes in bacteriorhodopsin during ion transport at 2 angstrom resolution. Science. 1999;286:255–260. doi: 10.1126/science.286.5438.255. [DOI] [PubMed] [Google Scholar]
- 48.Edman K, Nollert P, Royant A, Belrhali H, Pebay-Peyroula E, Hajdu J, Neutze R, Landau EM. High-resolution X-ray structure of an early intermediate in the bacteriorhodopsin photocycle. Nature. 1999;401:822–826. doi: 10.1038/44623. [DOI] [PubMed] [Google Scholar]
- 49.Pebay-Peyroula E, Rummel G, Rosenbusch JP, Landau EM. X-ray structure of bacteriorhodopsin at 2.5 Å from microcrystals grown in lipidic cubic phases. Science. 1997;277:1676. doi: 10.1126/science.277.5332.1676. [DOI] [PubMed] [Google Scholar]
- 50.Luecke H, Schobert B, Cartailler JP, Richter HT, Rosengarth A, Needleman R, Lanyi JK. Coupling photoisomerization of retinal to directional transport in bacteriorhodopsin. J Mol Biol. 2000;300:1237–1255. doi: 10.1006/jmbi.2000.3884. [DOI] [PubMed] [Google Scholar]
- 51.Henderson R, Baldwin JM, Ceska TA, Zemlin F, Beckman E, Downing KH. Model for the Structure of Bacteriorhodopsin Based on High-resolution Electron Cryo-microscopy. J Mol Biol. 1990;213:899–929. doi: 10.1016/S0022-2836(05)80271-2. [DOI] [PubMed] [Google Scholar]
- 52.Edmonds BW, Luecke H. Atomic resolution structures and the mechanism of ion pumping in bacteriorhodopsin. Frontiers in Bioscience. 2004;9:1556–1566. doi: 10.2741/1264. [DOI] [PubMed] [Google Scholar]
- 53.Okumura H, Murakami M, Kouyama T. Crystal structures of acid blue and alkaline purple forms of bacteriorhodopsin. J Mol Biol. 2005;351:481–495. doi: 10.1016/j.jmb.2005.06.026. [DOI] [PubMed] [Google Scholar]
- 54.Kouyama T, Nishikawa T, Tokuhisa T, Okumura H. Crystal Structure of the L Intermediate of Bacteriorhodopsin: Evidence for Vertical Translocation of a Water Molecule during the Proton Pumping Cycle. J Biol Chem. 2004;335:531–546. doi: 10.1016/j.jmb.2003.10.068. [DOI] [PubMed] [Google Scholar]
- 55.Shurki A, Warshel A. Structure/function correlations of proteins using MM, QM/MM, and related approaches: Methods, concepts, pitfalls, and current progress. Adv Protein Chem. 2003;66:249–313. doi: 10.1016/s0065-3233(03)66007-9. [DOI] [PubMed] [Google Scholar]
- 56.Štrajbl M, Hong G, Warshel A. Ab Initio QM/MM Simulation with Proper Sampling: “First Principle” Calculations of the Free Energy of the Autodissociation of Water in Aqueous Solution. J Phys Chem B. 2002;106:13333–13343. [Google Scholar]
- 57.Rosta E, Klahn M, Warshel A. Towards Accurate Ab Initio QM/MM Calculations of Free-Energy Profiles of Enzymatic Reactions. J Phys Chem B. 2006;110:2934–2941. doi: 10.1021/jp057109j. [DOI] [PubMed] [Google Scholar]
- 58.Warshel A. In: Semiempirical Methods of Electronic Structure Calculation. Segal GA, editor. Plenum Press; New York, NY: 1977. p. 133. [Google Scholar]
- 59.Warshel A. Computer Modeling of Chemical Reactions in Enzymes and Solutions. John Wiley & Sons; New York: 1991. [Google Scholar]
- 60.Warshel A. Calculations of chemical processes in solutions. J Phys Chem. 1979;83:1640–1650. [Google Scholar]
- 61.Warshel A, Lappicirella A. Calculations of ground- and excited-state potential surfaces for conjugated heteroatomic molecules. J Am Chem Soc. 1981;103:4664–4673. [Google Scholar]
- 62.Luzhkov V, Warshel A. Microscopic calculations of solvent effects on absorption spectra of conjugated molecules. J Am Chem Soc. 1991;113:4491–4499. [Google Scholar]
- 63.Hwang JK, King G, Creighton S, Warshel A. Simulation of free energy relationships and dynamics of SN2 reactions in aqueous solution. J Am Chem Soc. 1988;110:5297–5311. [Google Scholar]
- 64.Govindjee R, Balashov S, Ebrey T, Oesterhelt D, Steinberg G, Sheves M. Lowering The Intrinsic Pk(A) Of The Chromophores Schiff-Base Can Restore Its Light-Induced Deprotonation In The Inactive Tyr-57-]Asn Mutant Of Bacteriorhodopsin. J Biol Chem. 1994;269:14353–14354. [PubMed] [Google Scholar]
- 65.Sham YY, Chu ZT, Warshel A. Consistent calculations of pKa’s of ionizable residues in proteins: Semi-microscopic and microscopic approaches. J Phys Chem B. 1997;101:4458–4472. [Google Scholar]
- 66.Xiang Y, Warshel A. Quantifying Free Energy Profiles of Proton Transfer Reactions in Solution and Proteins by Using a Diabatic FDFT Mapping. J Phys Chem B. 2008;112:1007–1015. doi: 10.1021/jp076931f. [DOI] [PubMed] [Google Scholar]
- 67.Marcus RA. Chemical and electrochemical electron transfer theory. Annu Rev Phys Chem. 1964;15:155. [Google Scholar]
- 68.Lee FS, Chu ZT, Warshel A. Microscopic and semimicroscopic calculations of electrostatic energies in proteins by the POLARIS and ENZYMIX programs. J Comp Chem. 1993;14:161–185. [Google Scholar]
- 69.Sham YY, Chu ZT, Tao H, Warshel A. Examining methods for calculations of binding free energies: LRA, LIE, PDLD-LRA, and PDLD/S-LRA calculations of ligands binding to an HIV protease. Proteins: Struct Funct Genet. 2000;39:393–407. [PubMed] [Google Scholar]
- 70.King G, Warshel A. A surface constrained all-atom solvent model for effective simulations of polar solutions. J Chem Phys. 1989;91:3647–3661. [Google Scholar]
- 71.Lee FS, Warshel A. A local reaction field method for fast evaluation of long-range electrostatic interactions in molecular simulations. J Chem Phys. 1992;97:3100–3107. [Google Scholar]
- 72.Warshel A, Levitt M. QCFF/PI: A program for the consistent force field evaluation of equilibrium geometries and vibrational frequencies of molecules, QCPE 247. Quantum Chemistry Program Exchange, Indiana University; 1974. [Google Scholar]
- 73.Warshel A, Kato M, Pisliakov AV. Polarizable Force Fields: History, Test Cases and Prospects. J Chem Theory Comput. 2007;3:2034–2045. doi: 10.1021/ct700127w. [DOI] [PubMed] [Google Scholar]
- 74.Kato M, Pisliakov AV, Warshel A. The barrier for proton transport in aquaporins as a challenge for electrostatic models: The role of protein relaxation in mutational calculations. Proteins: Struct Funct Bioinf. 2006;64:829–844. doi: 10.1002/prot.21012. [DOI] [PubMed] [Google Scholar]
- 75.Warshel A, Sharma PK, Kato M, Parson WW. Modeling electrostatic effects in proteins. Biochim Biophys Acta. 2006;1764:1647–1676. doi: 10.1016/j.bbapap.2006.08.007. [DOI] [PubMed] [Google Scholar]
- 76.Schutz CN, Warshel A. What are the dielectric ‘constants’ of proteins and how to validate electrostatic models. Proteins: Struct Funct Genet. 2001;44:400–417. doi: 10.1002/prot.1106. [DOI] [PubMed] [Google Scholar]
- 77.Olsson MHM, Sharma PK, Warshel A. Simulating redox coupled proton transfer in cytochrome c oxidase: Looking for the proton bottleneck. FEBS Lett. 2005;579:2026–2034. doi: 10.1016/j.febslet.2005.02.051. [DOI] [PubMed] [Google Scholar]
- 78.Štrajbl M, Shurki A, Warshel A. Converting conformational changes to electrostatic energy in molecular motors: The energetics of ATP synthase. Proc Natl Acad Sci USA. 2003;100:14834–14839. doi: 10.1073/pnas.2436328100. [DOI] [PMC free article] [PubMed] [Google Scholar]
- 79.Muegge I, Qi PX, Wand AJ, Chu ZT, Warshel A. The reorganization energy of cytochrome c revisited. J Phys Chem B. 1997;101:825–836. [Google Scholar]
- 80.Polland HJ, Franz MA, Zinth W, Kaiser W, Kolling E, Oesterhelt D. Early picosecond events in the photocycle of bacteriorhodopsin. Biophysical Journal. 1986;49:651–662. doi: 10.1016/S0006-3495(86)83692-X. [DOI] [PMC free article] [PubMed] [Google Scholar]
- 81.Nishikawa T, Murakami M, Kouyama T. Crystal structure of the 13-cis isomer of bacteriorhodopsin in the dark-adapted state. J Biol Chem. 2005;352:319–328. doi: 10.1016/j.jmb.2005.07.021. [DOI] [PubMed] [Google Scholar]
- 82.Lanyi JK, Schobert B. Structural changes in the L photointermediate of bacteriorhodopsin. J Mol Biol. 2007;365:1379–1392. doi: 10.1016/j.jmb.2006.11.016. [DOI] [PMC free article] [PubMed] [Google Scholar]
- 83.Warshel A. Dynamics of enzymatic reactions. Proc Natl Acad Sci USA. 1984;81:444–448. doi: 10.1073/pnas.81.2.444. [DOI] [PMC free article] [PubMed] [Google Scholar]
- 84.Hwang JK, Warshel A. How important are quantum mechanical nuclear motions in enzyme catalysis? J Am Chem Soc. 1996;118:11745–11751. [Google Scholar]
- 85.Ludmann K, Gergely C, Varo G. Kinetic and thermodynamic study of the bacteriorhodopsin photocycle over a wide pH range. Biophys J. 1998;75:3110–3119. doi: 10.1016/S0006-3495(98)77752-5. [DOI] [PMC free article] [PubMed] [Google Scholar]
- 86.Liu H, Warshel A. The catalytic effect of dihydrofolate reductase and its mutants is determined by reorganization energies. Biochemistry. 2007;46:6011–6025. doi: 10.1021/bi700201w. [DOI] [PubMed] [Google Scholar]
- 87.Klahn M, Braun-Sand S, Rosta E, Warshel A. On possible pitfalls in ab initio quantum mechanics/molecular mechanics minimization approaches for studies of enzymatic reactions. J Phys Chem B. 2005;109:15645–15650. doi: 10.1021/jp0521757. [DOI] [PMC free article] [PubMed] [Google Scholar]
- 88.Gerwert K, Hess B, Soppa J, Oesterhelt D. Role of aspartate-96 in proton translocation by bacteriorhodopsin. Proc Natl Acad Sci USA. 1989;86:4943–4947. doi: 10.1073/pnas.86.13.4943. [DOI] [PMC free article] [PubMed] [Google Scholar]
- 89.Metz G, Siebert F, Engelhard M. Asp85 is the only internal aspartic-acid that gets protonated in the M intermediate and the purple-to-blue transition of bacteriorhodopsin -A solid-state 13C CP-MAS NMR investigation. FEBS Lett. 1992;303:237–241. doi: 10.1016/0014-5793(92)80528-o. [DOI] [PubMed] [Google Scholar]
- 90.Engelhard M, Gerwert K, Hess B, Kreutz W, Siebert F. Light-driven protonation changes of internal aspartic acids of bacteriorhodopsin - an investigation by static and time-resolved infrared difference spectroscopy using [4-C-13] Aspartic acid labeled purple membrane. Biochemistry. 1985;24:400–407. doi: 10.1021/bi00323a024. [DOI] [PubMed] [Google Scholar]
- 91.Johnson ET, Parson WW. Electrostatic Interactions in an Integral Membrane Protein. Biochemistry. 2002;41:6483–6494. doi: 10.1021/bi012131y. [DOI] [PubMed] [Google Scholar]
- 92.Riccardi D, Konig P, Guo H, Cui Q. Proton Transfer in Carbonic Anhydrase Is Controlled by Electrostatics Rather than the Orientation of the Acceptor. Biochemistry. 2008;47:2369–2378. doi: 10.1021/bi701950j. [DOI] [PubMed] [Google Scholar]
- 93.Scheiner S, Hillenbrand EA. Modification Of pK Values Caused By Change In H-Bond Geometry. Proc Natl Acad Sci USA. 1985;82:2741–2745. doi: 10.1073/pnas.82.9.2741. [DOI] [PMC free article] [PubMed] [Google Scholar]
- 94.Warshel A, Barboy N. Energy Storage and Reaction Pathways in the First Step of the Vision Process. J Am Chem Soc. 1982;104:1469. [Google Scholar]
- 95.Kolbe M, Besir H, Essen LO, Oesterhelt D. Structure of the light-driven chloride pump halorhodopsin at 1.8 Å resolution. Science. 2000;288:1390–1396. doi: 10.1126/science.288.5470.1390. [DOI] [PubMed] [Google Scholar]
- 96.Warshel A. Calculations of Enzymic Reactions: Calculations of pKa, Proton Transfer Reactions, and General Acid Catalysis Reactions in Enzymes. Biochemistry. 1981;20:3167–3177. doi: 10.1021/bi00514a028. [DOI] [PubMed] [Google Scholar]
- 97.Russell ST, Warshel A. Calculations of electrostatic energies in proteins; The energetics of ionized groups in bovine pancreatic trypsin inhibitor. J Mol Biol. 1985;185:389–404. doi: 10.1016/0022-2836(85)90411-5. [DOI] [PubMed] [Google Scholar]
- 98.Baasov T, Sheves M. Alteration of pKa of the bacteriorhodopsin protonated Schiff-Base - A study with model compounds. Biochemistry. 1986;25:5249–5258. [Google Scholar]
- 99.Warshel A, Sharma PK, Kato M, Xiang Y, Liu H, Olsson MHM. Electrostatic basis for enzyme catalysis. Chemical Reviews. 2006;106:3210–3235. doi: 10.1021/cr0503106. [DOI] [PubMed] [Google Scholar]
- 100.Liu HB, Warshel A. Origin of the temperature dependence of isotope effects in enzymatic reactions: The case of dihydrofolate reductase. J Phys Chem B. 2007;111:7852–7861. doi: 10.1021/jp070938f. [DOI] [PubMed] [Google Scholar]
- 101.Olsson MHM, Hong G, Warshel A. Frozen density functional free energy simulations of redox proteins: Computational studies of the reduction potential of plastocyanin and rusticyanin. J Am Chem Soc. 2003;125:5025–5039. doi: 10.1021/ja0212157. [DOI] [PubMed] [Google Scholar]
- 102.Warshel A. Bicycle-pedal model for the first step in the vision process. Nature. 1976;260:679–683. doi: 10.1038/260679a0. [DOI] [PubMed] [Google Scholar]
- 103.Sharma PK, Chu ZT, Olsson MHM, Warshel A. A new paradigm for electrostatic catalysis of radical reactions in vitamin B12 enzymes. Proc Natl Acad Sci USA. 2007;104:9661–9666. doi: 10.1073/pnas.0702238104. [DOI] [PMC free article] [PubMed] [Google Scholar]
- 104.Palings I, Vandenberg EMM, Lugtenburg J, Mathies RA. Complete assignment of the hydrogen out-of-plane wagging vibrations of bathorhodopsin - Chromophore structure and energy-storage in the primary photoproduct of vision. Biochemistry. 1989;28:1498–1507. doi: 10.1021/bi00430a012. [DOI] [PubMed] [Google Scholar]
- 105.Burykin A, Warshel A. On the origin of the electrostatic barrier for proton transport in aquaporin. FEBS Lett. 2004;570:41–46. doi: 10.1016/j.febslet.2004.06.020. [DOI] [PubMed] [Google Scholar]
- 106.Hayashi S, Ohmine I. Proton transfer in bacteriorhodopsin: Structure, excitation, IR spectra, and potential energy surface analyses by an ab initio QM/MM method. J Phys Chem B. 2000;104:10678–10691. [Google Scholar]
- 107.Pullman A, Pullman B. New paths in the molecular orbital approach to solvation in biological molecules. Quart Rev Biol. 1975;7:506–566. doi: 10.1017/s0033583500001529. [DOI] [PubMed] [Google Scholar]
- 108.Jorgensen WL. Ab initio Molecular Orbital Study of the Geometric Properties and Protonation of Alkyl Chloride. J Am Chem Soc. 1978;100:1057–1061. [Google Scholar]
- 109.Olsson MHM, Warshel A. Monte Carlo simulations of proton pumps; On the working principles of the biological valve that controls proton pumping in cytochrome c oxidase. Proc Natl Acad Sci USA. 2006;103:6500–6505. doi: 10.1073/pnas.0510860103. [DOI] [PMC free article] [PubMed] [Google Scholar]
- 110.Olsson MHM, Siegbahn PEM, Blomberg MRA, Warshel A. Exploring pathways and barriers for coupled ET/PT in cytochrome c oxidase: A general framework for examining energetics and mechanistic alternatives. Biochim Biophys Acta-Bioenergetics. 2007;1767:244–260. doi: 10.1016/j.bbabio.2007.01.015. [DOI] [PMC free article] [PubMed] [Google Scholar]
- 111.Schutz CN, Warshel A. The low barrier hydrogen bond (LBHB) proposal revisited: The case of the Asp.His pair in serine proteases. Proteins. 2004;55:711–723. doi: 10.1002/prot.20096. [DOI] [PubMed] [Google Scholar]