Abstract
Objective
Use the meta-analytic approach to examine the effects of aerobic exercise on lipids and lipoproteins in overweight and obese adults.
Data Sources
(1) Computerized literature searches, (2) cross-referencing from review and original articles, (3) hand searching, and (4) expert review of reference list.
Study Selection
(1) randomized controlled trials, (2) aerobic exercise ≥8 weeks, (3) adult humans ≥ 18 y of age, (4) all subjects overweight or obese (BMI ≥25 kg/m2), (5) studies published in journal, dissertation, or master's thesis format, (6) studies published in the English-language, (7) studies published between 1 January 1955 and 1 January 2003, (8) assessment of one or more of the following lipid and/or lipoprotein variables: total cholesterol (TC), high-density lipoprotein cholesterol (HDL), low-density lipoprotein cholesterol (LDL), and triglycerides (TG).
Data Abstraction
Dual-coding by the first two authors (inter-rater agreement = 0.96).
Results
In total, 13 studies representing 31 groups (17 exercise, 14 control), 613 subjects (348 exercise, 265 control), and up to 17 outcomes were available for pooling. Across all categories, random-effects modeling resulted in statistically significant improvements for TC (X̄±s.e.m., −3.4±1.7 mg/dl, 95% CI, −6.7 to −0.2 mg/dl) and TG (X̄±s.e.m., −16.1±7.3 mg/dl, 95% CI, −30.2 to −2.1 mg/dl) but not HDL (X̄±s.e.m., 1.6±0.8 mg/dl, 95% CI, −0.02 to 3.2 mg/dl) or LDL (X̄±s.e.m., −0.5±1.3 mg/dl, 95% CI, −3.0 to 2.0 mg/dl). Changes were equivalent to improvements of 2% (TC), 11% (TG), 3% (HDL), and 0.3% (LDL). After conducting sensitivity analyses (each study deleted from the model once), only decreases in TG remained statistically significant. Increases in HDL were associated with increases in maximum oxygen consumption (VO2max in ml/kg/min, r = 0.75, P = 0.002) and decreases in body weight (r = 0.77, P<0.001), while decreases in LDL were associated with decreases in body weight (r = 0.75, P = 0.009).
Conclusions
Aerobic exercise decreases TG in overweight and obese adults. However, a need exists for additional randomized controlled trials in various overweight and/or obese populations above and beyond those included in our analysis.
Keywords: exercise, overweight, lipids, cholesterol, meta-analysis
Introduction
The prevalence of overweight and obesity are major public health problems in the United States. Data from the 1999 and 2000 National Health and Nutrition Examination Survey (NHANES) indicate that the age-adjusted prevalence of overweight, defined as a body mass index (BMI) greater than or equal to 25 kg/m2, was 64.5% while the age-adjusted prevalence of obesity, defined as a BMI greater than or equal to 30 kg/m2, was 30.5%.1 Less than optimal lipid and lipoprotein levels, common in overweight and obese adults, increase one's risk for morbidity and mortality from cardiovascular and related diseases.2 One possible lifestyle modification that has been recommended for improving lipids and lipoproteins in adults is aerobic exercise, a low-cost, nonpharmacologic intervention that is available to the vast majority of the general population.2 However, previous randomized controlled trials that have examined the effects of aerobic exercise on lipids and lipoproteins in overweight and obese adults have led to less than overwhelming results.3–16 Using a vote-counting approach,17 statistically significant improvements have been reported for 12% of total cholesterol (TC) outcomes, 25% of high-density lipoprotein cholesterol (HDL) outcomes, 0% of low-density lipoprotein cholesterol (LDL) outcomes, and 35% of triglyceride (TG) outcomes.3–16 While these results are not overwhelming, it is important to point out that such an approach relies on the vote-counting approach, which has been shown to be less valid than the meta-analytic approach.17 Unfortunately, while previous meta-analytic reviews dealing with the effects of aerobic exercise in adults have been conducted,18–24 none have specifically focused on overweight and obese adults. Thus, given (1) the prevalence of overweight and obesity in adults; (2) the prevalence of less than optimal lipid and lipoprotein levels in overweight and obese adults; (3) the less than overwhelming results of previous studies dealing with the effects of aerobic exercise on lipids and lipoproteins in overweight and obese adults; and (4) the absence of any meta-analytic work that has specifically focused on the effects of aerobic exercise on lipids and lipoproteins in overweight and obese adults, the purpose of this study was to use the meta-analytic approach to examine the effects of aerobic exercise on lipids and lipoproteins in overweight and obese adults.
Methods
Data sources
The search for pertinent studies was conducted via (1) computerized literature searches (MEDLINE, EMBASE, Sport-Discus, Current Contents, Dissertation Abstracts International); (2) cross-referencing from review articles as well as original trials; (3) hand searching selected journals; and (4) expert review of our reference list (Dr William Haskell, personal communication, 7 May 2003). Key words used in our computerized literature searches included cholesterol, overweight, obesity, physical activity, fitness, lipids, lipoproteins, adults, humans, and cardiovascular disease.
Study selection
The selection of studies was conducted by the first two authors, independent of each other. Disagreements were resolved by consensus. The inclusion criteria for this study were as follows: (1) randomized controlled trials with a comparative non-exercise group; (2) prescribed aerobic exercise of at least 8 weeks as an intervention; (3) adult humans aged 18 y and older; (4) all subjects overweight and/or obese, defined as a BMI greater than or equal to 25 kg/m2; (5) studies published in journal, dissertation, or master's thesis format; (6) studies published in the English-language; (7) studies published between 1 January 1955 and 1 January 2003; and (8) assessment of one or more of the following lipid and/or lipoprotein variables in the fasting state: TC, HDL, LDL, and TG. Exclusion criteria for this study were as follows: (1) any human clinical trials in which the subjects' BMI were less than 25 kg/m2; (2) observational studies; (3) review articles; (4) case reports; (5) comments; (6) letters; (7) animal studies; (8) foreign-language articles; (9) presentations from conference meetings; (10) training studies that did not have a comparative and/or randomized control group; (11) training studies which were limited to exercise and/or control groups that also received a diet intervention; and (12) resistance training (weight training) studies. Multiple publication bias (data on the same variable in the same subjects appearing in more than one source) was addressed by examining each potentially eligible study and only including data from the one study that provided the greatest amount of information for our meta-analysis. We did not include foreign-language articles because they were beyond the scope of this investigation.
Data abstraction
A coding form that could hold more than 200 items per study was used for this investigation. The first two authors then reviewed every data point for accuracy. Discrepancies were resolved by consensus. If consensus could not be reached, the third author acted as an arbitrator until consensus was reached. The major categories of variables that were coded included (1) study characteristics (source, study quality, percent dropout, etc); (2) subject characteristics (gender, age, height, weight, etc); (3) lipid assessment characteristics (time of day, number of hours fasted, etc); (4) training program characteristics (length, frequency, intensity, duration, mode, total minutes of training, compliance); (5) primary outcomes (TC, HDL, LDL, TG); and (6) secondary outcomes (body weight, BMI, percent body fat, and maximum oxygen consumption, expressed in ml/kg/min. All studies were coded by the first two authors, independent of each other. Cohen's kappa for inter-rater agreement between the two coders prior to correcting discrepant items was 0.96.
Statistical analysis
Primary and secondary outcomes
The primary outcomes in this study were baseline to final changes in TC, HDL, LDL, and TG in milligrams per deciliter (mg/dl). We used mg/dl vs millimoles because this is the metric most commonly used to report lipid and lipoprotein values in the clinical setting in the United States. Net changes in lipids and lipoproteins were calculated as the difference (exercise minus control) of the changes (initial minus final) in the mean values from each study. Pooled treatment effects were calculated by assigning weights equal to the inverse of the variance for net changes in all lipid and lipoprotein outcomes. In all 95% confidence intervals (CI) were used to establish the statistical significance of our estimates. If the 95% CI did not include zero (0), we considered our results to be statistically significant. A random-effects model was used for all analyses.25 Statistical heterogeneity of outcomes was examined using the Q statistic.26 However, since this test tends to suffer from low power,27 we also examined the consistency of our overall results using a recently developed statistic (I2) that is an extension of the traditional method for examining heterogeneity (Q).27 Briefly, I2 is calculated as 100% × (Q−df)/Q, where Q is the heterogeneity statistic and df, the degrees of freedom. Negative values of I2 are considered to be equal to zero (0) so that all values occur between 0 and 100%. A value of 0% is indicative of no observed heterogeneity, while larger values are indicative of greater heterogeneity. Values of 25.0, 50.0, and 75.0% may be considered to be indicative of low, moderate, and high degrees of heterogeneity. Secondary outcomes (changes in body weight, BMI, percent body fat, and VO2max in ml/kg/min) were analyzed using the same general procedures as for primary outcomes.
Publication bias, that is, the tendency for authors to submit, and editors to publish, studies that yield statistically significant results, was assessed using regression analysis to detect funnel plot asymmetry.28 Study quality was assessed using a quality index developed by Jadad et al.29 This assessment is a three-item questionnaire designed to assess bias, specifically, randomization, blinding, and withdrawals/dropouts. The minimum number of points possible is 0 and the maximum 5, with the higher number representing greater study quality. All questions are designed to elicit a yes (1 point) or no (0 points) response. The questionnaire has been shown to be both valid (face validity) and reliable (researcher inter-rater agreement, r = 0.77, 95% CI 0.60–0.96). We chose this index over others30 because of its reported validity and reliability.29 However, since there is currently no ‘gold standard’ for assessing the quality of a clinical trial, all such methods need to be interpreted with caution.31
In order to examine the effects of each study on the overall results, analyses were conducted with each study deleted from the model once. All analyses of this type were conducted separately for each primary outcome, for example, TC, HDL, LDL, and TG. In addition, we conducted separate analyses with studies in which all women were premenopausal deleted from the model as well as for those studies in which all women were postmenopausal deleted. Furthermore, analyses were conducted with studies that met one or more of the following criteria deleted from the model: (1) changes in diet that could effect lipids and lipoproteins; (2) use of drugs, including hormone replacement therapy, that could effect lipids and lipoproteins; and (3) cigarette smoking. Finally, we performed cumulative meta-analysis, ranked by year, in order to see at what point in time, if any, that results had stabilized. Cumulative meta-analysis is a procedure in which studies are added one at a time in a specific order (for example, year), with a summary of results as each study is added.31
Subgroup analyses
A priori subgroup analyses for changes in TC, HDL, LDL, and TG were accomplished using random effects ANOVA models (method of moments approach).32 Data were analyzed separately for each lipid and lipoprotein variable when partitioned according to gender (male vs female), whether all subjects were diabetic (yes vs no), and whether exercise was supervised or unsupervised. We did not conduct any type of subgroup analysis according to race/ethnicity because a lack of data was provided regarding such.
Meta-regression
In order to examine the relationship between changes in lipids and lipoproteins (TC, HDL, LDL, and TG) and selected continuous variables, simple, weighted, generalized least-squares meta-regression (random effects, method of moments approach) was performed a priori and separately for each lipid and lipoprotein outcome. Meta-regression is analogous to simple and multiple regression for conventional data sets. Variables that were examined included study quality, year of publication, percent dropout, initial lipid and lipoprotein levels, age, height, initial as well as changes in body weight, BMI (kg/m2), percent body fat, and VO2max in ml/kg/min, number of hours fasted prior to lipid assessment, number of hours that exercise was avoided prior to lipid assessment, length, frequency, intensity and duration of training, total minutes of training (length × frequency × duration) and compliance, defined as the percentage of exercise sessions attended.
Descriptive statistics are reported as mean±standard deviation (X̄±s.d.) while primary and secondary outcomes are reported as mean±standard error (X̄±s.e.m.). The two-tailed alpha level for statistical significance was set at P≤0.05.
Results
Study characteristics
Studies included
A total of 14 studies met our inclusion criteria.3–16 However, we were unable to include one study because of the inability to retrieve necessary data for the calculation of our lipid and lipoprotein outcomes.14 Thus, our percent loss that met our inclusion criteria was approximately 7%, leaving us with a total of 13 studies to include in our analysis.3–13,15,16 A general description of the studies is shown in Table 1.
Table 1.
Characteristics of included studies
| Study | Subjects | Aerobic exercise intervention | Lipids assessed | Assessment methods |
|---|---|---|---|---|
| Campbell3 | 40 college-aged males, assigned to either an exercise (n = 24) or control (n = 16) group | 10 weeks of running, 3 days/week, 30 min/session | TC | Morning after an overnight fast |
| Gillett et al4 | 82 sedentary females, 49–59 y of age, assigned to either an exercise (n = 59) or control (n = 23) group | 16 weeks of low-impact dance exercise, 3.2 days/week, 28.5 min/session, 60–80% of MHRR | TC, HDL | Morning after a 12-h overnight fast |
| Hagan et al5 | 48 sedentary males and females (mean age = 36.6 y) assigned to either an exercise (n = 24) or control (n = 24) group | 12 weeks of walking and/or running, 5 days/week, 30 min/session | TC, HDL, LDL, TG | Morning after a 14-h overnight fast |
| Hinkleman and Nieman6 | 36 sedentary women, 25–45 y of age, 18 exercise (age = 36.0±6.8 y) and 18 control (age = 32.4±6.4 y) | 15 weeks of walking, 5 days/week, 45 min/session, 62% of VO2max | TC, LDL, TG | Morning after a 12-h overnight fast and avoiding exercise for more than 36 h |
| Hopewell7 | 11 sedentary women, assigned to either an exercise (n = 5) or control (n = 6) group | 24 weeks of walking, 3 days/week, 50 min/session, 68% of VO2max | TC, HDL, LDL, TG | Morning after a 12-h overnight fast and avoiding exercise for at least 24 h |
| Kaplan et al8 | 33 sedentary men and women (mean age = 54 y) assigned to an exercise (n = 18) or control (n = 15) group | 10 weekly walking sessions over a 10-week period, 40–60 min/session, 60–70% of VO2max | TC, HDL, LDL, TG | Morning after a 12-h overnight fast |
| Keller and Trevino9 | 35 sedentary women, 18–45 y of age, assigned to either 3 × week exercise (n = 12), 5 × week exercise (n = 11), or control (n = 12) group | 24 weeks of walking 3 or 5 days/week, 30 min/session, 50% of MHRR | TC, HDL, LDL, TG | Morning after a 7–11 h overnight fast and after avoiding exercise |
| Kraus et al10 | 84 men and women, assigned to either low amount-moderate intensity exercise (n = 19, age = 54.3±10.6 y), low amount-high intensity exercise (n = 17, age = 51.8±6.6 y), high amount-high intensity exercise (n = 22, age = 53.0±5.6 y) or control (n = 26, age = 50.5±7.5 y) group | 24 weeks of cycling, walking/running, elliptical training, 3.4 days/week, 51.76 min/session, 40–55% of VO2max (low amount-moderate intensity exercise), 3 days/week, 39 min/session, 65–80% of VO2max (low amount-high intensity exercise), or 3.8 days/week, 45.79 min/session, 65–80% of VO2max (high amount-high intensity exercise) | TC, HDL, LDL, TG | Morning after an overnight fast |
| Leon et al11 | 16 sedentary men, 22–44 y of age, assigned to an exercise period and a control period | 12 weeks of walking and stairclimbing, 5 days/week, 52 min/session, 40 to 90% of VO2max | TC, LDL, HDL, TG | Morning after an overnight fast |
| Ligtenberg et al12 | 51 men and women assigned to either an exercise (n = 25) or control (n = 26) group | 26 weeks of walking/running, cycling, swimming, rowing, 3 days/week, 50 min/session, 60–80% of VO2max | TC, HDL, LDL, TG | Morning after a 12-h overnight fast and within 72 h of the last exercise session |
| Nieman et al13 | 43 sedentary women assigned to either an exercise (n = 21) or control (n = 22) group | 12 weeks of walking, 5 days/week, 25–45 min/session, 60–80% of MHR | TC, HDL, LDL, TG | NA |
| Verity and Ismail15 | 10 sedentary women, 50–70 y of age, assigned to either an exercise (n = 5, age = 61.20±9.17 y) or control (n = 5, age = 57.20±8.27 y) group | 16 weeks of walking, 3 days/week, 60–90 min/session, 65–80% of MHRR | TC, HDL | Morning after a 10–12 h overnight fast |
| Wood et al16 | 89 sedentary men, 30–59 y of age, assigned to an exercise (n = 47, age = 44.1±7.8 y) or control (n = 42, age = 45.2±7.2 y) group | 52 weeks of walking and jogging, 3–5 days per week, 25–50 min/session, 60–80% of MHR. Subjects were also encouraged to increase their general activity by such things as walking, cycling, stair climbing, and recreational activities | TC, HDL, LDL, TG | Morning after a 12–16 h overnight fast and avoiding exercise |
Description of studies limited to those subjects and variables that met our inclusion criteria; Number of subjects limited to those in which pre and post assessment of lipids took place; Data reported as mean±s.d.; MHRR, maximum heart rate reserve; VO2max, maximum oxygen consumption; MHR, maximal heart rate; lipid variables listed limited to those that met our inclusion criteria, including availability; TC, total cholesterol; HDL, high-density lipoprotein cholesterol; LDL, low-density lipoprotein cholesterol; TG, triglycerides; NA, not available.
Country of origin
In total, 12 of the 13 studies (92%) were conducted in the United States3–11,13,15,16 while one was conducted in the Netherlands.12
Study design
All of the studies appeared to use an analysis-by-protocol approach in the analysis of their data. A total of 31 groups (17 exercise, 14 control) representing 613 subjects (348 exercise, 265 control) and up to 17 outcomes were available for pooling.
The percentage of subjects that were not available for follow-up assessment ranged from 0 to 67% for the exercise groups (X̄±s.d., 21.7±20.4%) and 0 to 40% for the control groups (X̄±s.d., 19.0±13.8%) Median study quality was 2 out of a possible high of 5.
Subject characteristics
Gender
Baseline characteristics of the subjects are shown in Table 2. Six studies included only females,4,6,7,9,13,15 three included only males,3,11,16 while the remaining four included both males and females.5,8,10,12 Of the 613 subjects, 345 were females and 268 were males. Three studies reported that all female subjects were premenopausal6,7,9 while two reported that all female subjects were postmenopausal.12,15
Table 2.
Baseline characteristics of the subjects
| Variable | N | Exercise X̄±s.d. | Range | N | Control X̄±s.d. | Range |
|---|---|---|---|---|---|---|
| Age (y) | 16 | 44.6±11.3 | 30.5–63.0 | 13 | 43.2±11.2 | 30.5–61.0 |
| Height (cm) | 7 | 172.3±6.2 | 164.4–180.9 | 5 | 169.8±8.6 | 158.3–178.2 |
| Body weight (kg) | 14 | 85.0±6.9 | 71.4–95.8 | 11 | 84.2±7.3 | 68.4–95.4 |
| BMI (kg/m2) | 14 | 29.9±2.7 | 26.0–36.2 | 11 | 30.1±3.0 | 25.3–34.0 |
| Body fat (%) | 8 | 33.8±6.7 | 24.6–43.1 | 8 | 33.7±7.0 | 23.6–43.4 |
| VO2max (ml/kg/min) | 13 | 27.8±5.6 | 17.3–35.6 | 10 | 27.4±6.8 | 17.8–38.2 |
| TC (mg/dl) | 17 | 202.3±16.8 | 180.0–241.0 | 14 | 207.3±19.9 | 188.0–264.0 |
| HDL (mg/dl) | 16 | 44.7±6.8 | 35.0–56.6 | 13 | 43.2±7.3 | 31.2–54.8 |
| LDL (mg/dl) | 14 | 126.3±12.4 | 106.0–148.1 | 11 | 131.6±10.2 | 119.0–152.0 |
| TG (mg/dl) | 14 | 145.3±46.0 | 71.8–239.0 | 11 | 137.7±37.1 | 98.0–219.3 |
N, number of groups reporting data; X̄±s.d., mean±standard deviation; Range represents the means for each group from each study; BMI, body mass index; VO2max, maximum oxygen consumption; TC, total cholesterol; HDL, high-density lipoprotein cholesterol; LDL, low-density lipoprotein cholesterol; TG, triglycerides.
Race
One study each reported that all subjects were either Hispanic9 or White.11
Medications
Three studies reported that none of the subjects were taking any type of medication(s) that could affect lipids and lipoproteins7,15,16 while another three studies reported that some or all of the subjects were taking some type of medication that could affect lipids and lipoproteins.6,9,12
Smoking/alcohol
Six studies reported that none of the subjects were cigarette smokers4–7,13,15,16 while another two reported that some of the subjects smoked cigarettes.11,12 Two studies reported that some of the subjects consumed alcohol.6,11
Comorbidities
Three studies reported that all subjects were diabetic8,12,15 while one reported that all subjects were hyperlipidemic.10 None of the studies reported that all subjects had some type of cardiovascular disease.
Diet/physical activity
Reported changes in diet were limited to two studies.6,16 In addition, none of the studies reported that all subjects had been physically active prior to taking part in the study.
Lipid assessment characteristics
Three studies reported the assessment of lipids and lipoproteins in the supine position5,11,16 while another reported assessment in the sitting position.6 Prior to the assessment of lipids and lipoproteins, subjects fasted from 8.5 to 14.0 h (X̄±s.d., 12.0±1.4 h). The number of hours that exercise was avoided prior to the assessment of lipids ranged from 24 to 72 h (X̄±s.d., 40.0±21.9 h).
Training program characteristics
A description of the training program characteristics is shown in Table 3. As can be seen, compliance, defined as the percentage of exercise sessions attended, was reported for only 46% of the exercise groups. Six of the 13 studies (46%) used walking as the primary training modality6–9,13,15 while one each used either jogging3 or aerobic dance.4 The five remaining studies used a combination of one or more of the following activities as the exercise intervention: walking, jogging, stationary cycling, stair climbing, swimming.5,10–12,16 Nine of 13 studies (approximately 69%) had subjects perform supervised exercise,3–8,10–13,15,16 one had subjects perform unsupervised exercise,9 while three other studies had subjects perform a combination of both supervised and unsupervised exercise.12,13,16
Table 3.
Training program characteristics
| Variable | N | X̄±s.d. | Range |
|---|---|---|---|
| Length (weeks) | 17 | 19.8±10.2 | 10.0–52.0 |
| Frequency (times/week) | 16 | 3.9±1.0 | 3.0–5.0 |
| Intensity (%VO2max) | 14 | 63.9±10.8 | 46.7–78.5 |
| Duration (min/session) | 17 | 41.5±13.5 | 17.0–75.0 |
| Compliance (%) | 8 | 87.1±10.5 | 66.1–100 |
N, number of groups reporting data; X̄±s.d., mean±standard deviation; compliance, percentage of exercise sessions attended.
Primary outcomes
Total cholesterol
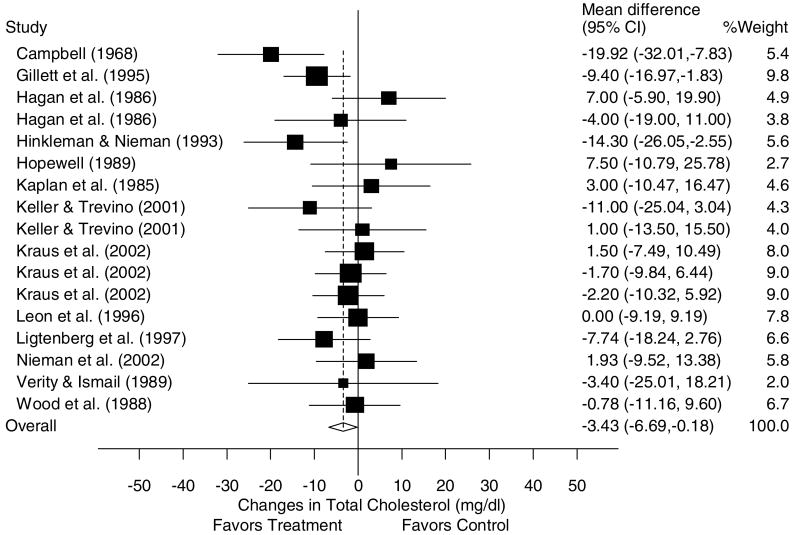
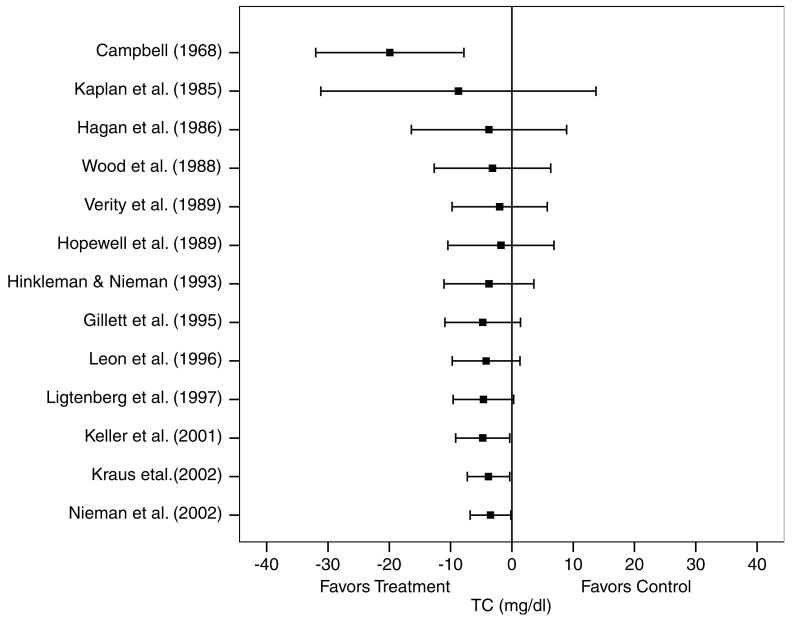
A description of the results for TC is shown in Table 4 and Figure 1. Across all categories, there was a statistically significant exercise minus control reduction of approximately 2% (X̄±s.e.m., −3.4±1.7 mg/dl, 95% CI, −6.7 to −0.2 mg/dl). No statistically significant publication bias was observed (P = 0.59). Cumulative meta-analysis, ranked by year, revealed that decreases in TC have been in the direction of benefit and statistically significant since 2001 (Figure 2). With each study deleted from the model once, changes in TC ranged from a statistically significant reduction of X̄±s.e.m., −4.0±−1.8 mg/dl, 95% CI, −7.5 to −0.6 mg/dl) to a nonsignificant reduction of −2.9±1.8 mg/dl, 95% CI, −6.3 to 0.6 mg/dl). With those studies in which changes in diet, cigarette smoking, and/or drugs that could affect lipid and lipoproteins deleted from the model, changes in TC were nonsignificant (X̄±s.e.m., −2.4±2.4 mg/dl, 95% CI, −7.1 to 2.3 mg/dl). Results also remained nonsignificant when studies limited to premenopausal and postmenopausal women were deleted from the model (premenopausal, X̄±s.e.m., −3.0±1.8 mg/dl, 95% CI, −6.6 to 0.5 mg/dl; postmenopausal, X̄±s.e.m., −3.2±1.8 mg, 95% CI, −6.7 to 0.3 mg/dl). No statistically significant differences or relationships were observed for TC when previously described subgroup and regression analyses were performed (P>0.05 for all).
Table 4.
Primary and secondary outcomes
| Variable | N | X̄±s.e.m. | 95% CI | Q | P | I2 |
|---|---|---|---|---|---|---|
| Primary outcomes (mg/dl) | ||||||
| TC | 17 | −3.4±1.7 | −6.7 to −0.2* | 22.8 | 0.12 | 29.7 |
| HDL | 15 | 1.6±0.8 | −0.02 to 3.2 | 46.4 | <0.001** | 69.8 |
| LDL | 14 | −0.5±1.3 | −3.0 to 2.0 | 12.9 | 0.46 | 0.0 |
| TG | 14 | −16.1±7.3 | −30.2 to −2.1* | 58.7 | <0.001** | 77.9 |
| Secondary outcomes | ||||||
| Body weight (kg) | 14 | −1.6±0.4 | −2.3 to −0.9* | 25.0 | 0.02** | 48.1 |
| BMI (kg/m2) | 5 | −1.1±0.3 | −1.8 to −0.5* | 6.1 | 0.19 | 34.2 |
| Body fat (%) | 5 | −0.1±0.3 | −0.8 to 0.6 | 4.2 | 0.38 | 4.2 |
| VO2max (ml/kg−1/min−1) | 10 | 3.5±0.6 | 2.3 to 4.7* | 55.2 | <0.001** | 83.7 |
N, number of groups reporting data in which a treatment effect could be calculated; X̄±s.e.m., mean±standard error of the mean; CI, confidence interval; Q, heterogeneity value; P, significance value for Q; I2, percentage (%) of inconsistency for study results, calculated from Q statistic; TC, total cholesterol; HDL, high-density lipoprotein cholesterol; LDL, low-density lipoprotein cholesterol; TG, triglycerides; BMI, body mass index; VO2max, maximum oxygen consumption.
Significantly different from zero (0);
statistically significant at P<0.05.
Figure 1.
Forest plot for changes in TC and 95% CI for each outcome as well as the overall weighted mean difference and 95% CI. The size of the black boxes for each outcome represents the weight given to that outcome. The overall mean difference is shown by the middle of the diamond while the left and right extremes of the diamond represent the corresponding 95% CI. The vertical dashed line represents the overall mean.
Figure 2.
Cumulative meta-analysis, ranked by year, for changes in TC. Each horizontal line and black square represent the summary of results as studies from the previous years are combined with the listed study. The black squares represent the point estimates while the lines represent the lower (left) and upper (right) 95% CI. Estimates are based on 17 outcomes from 13 studies.
High-density lipoprotein cholesterol
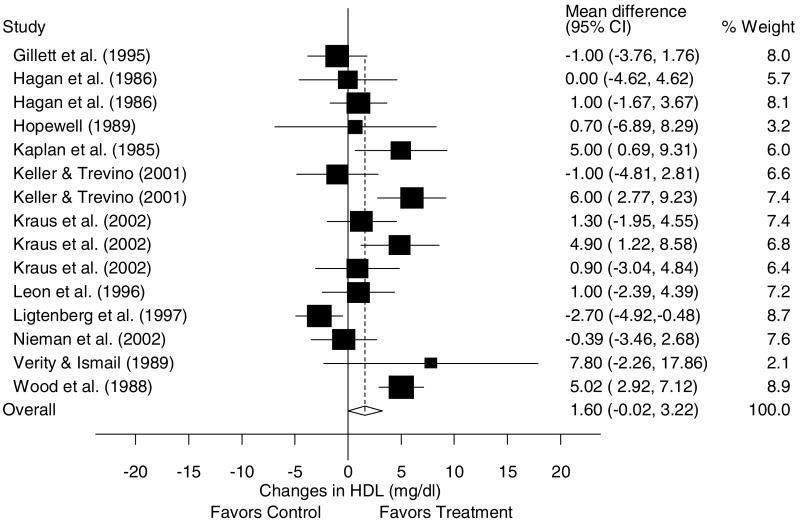
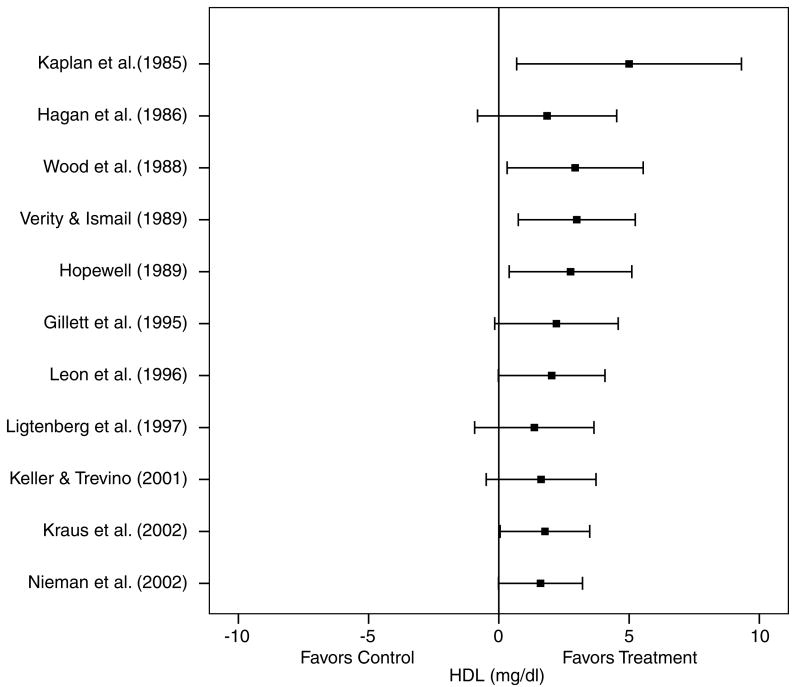
A description of the results for HDL is shown in Table 4 and Figure 3. Across all categories, there was a statistically nonsignificant exercise minus control increase of approximately 3% (X̄±s.e.m., 1.6±0.8 mg/dl, 95% CI, −0.02 to 3.2 mg/dl). No statistically significant publication bias was observed (P = 0.60). Cumulative meta-analysis, ranked by year, revealed that increases in HDL have been in the direction of benefit but generally statistically nonsignificant since 1995 (Figure 4). With each study deleted from the model once, changes in HDL ranged from a statistically significant increase of 2.0±−0.7 mg/dl, 95% CI, 0.5–3.5 mg/dl to a nonsignificant increase of 1.4±1.0 mg/dl, 95% CI, −0.5 to 3.4. With those studies in which changes in diet, cigarette smoking, and/or drugs that could affect lipids and lipoproteins deleted from the model, changes in HDL remained nonsignificant (X̄±s.e.m., 1.2±0.7 mg/dl, 95% CI, −0.2 to 2.6 mg/dl). Results also remained nonsignificant when studies that were limited to premenopausal women were deleted from the model (X̄±s.e.m., 1.4±0.9 mg/dl, 95% CI, −0.3 to 3.2 mg/dl). However, a small but statistically significant increase in HDL was found when studies limited to postmenopausal women were deleted from the model (X̄±s.e.m., 1.9±0.8 mg/dl, 95% CI, 0.4–3.4 mg/dl). Increases in HDL were associated with increases in VO2max in ml/kg//min (r = 0.75, P = 0.002) and decreases in body weight (r = 0.77, P<0.001). No other statistically significant differences or relationships were observed for HDL when previously described subgroup and regression analyses were performed (P>0.05 for all).
Figure 3.
Forest plot for changes in HDL and 95% CI for each outcome as well as the overall weighted mean difference and 95% CI. The size of the black boxes for each outcome represents the weight given to that outcome. The overall mean difference is shown by the middle of the diamond while the left and right extremes of the diamond represent the corresponding 95% CI. The vertical dashed line represents the overall mean.
Figure 4.
Cumulative meta-analysis, ranked by year, for changes in HDL. Each horizontal line and black square represent the summary of results as studies from the previous years are combined with the listed study. The black squares represent the point estimates while the lines represent the lower (left) and upper (right) 95% CI. Estimates are based on 15 outcomes from 11 studies.
Low-density lipoprotein cholesterol
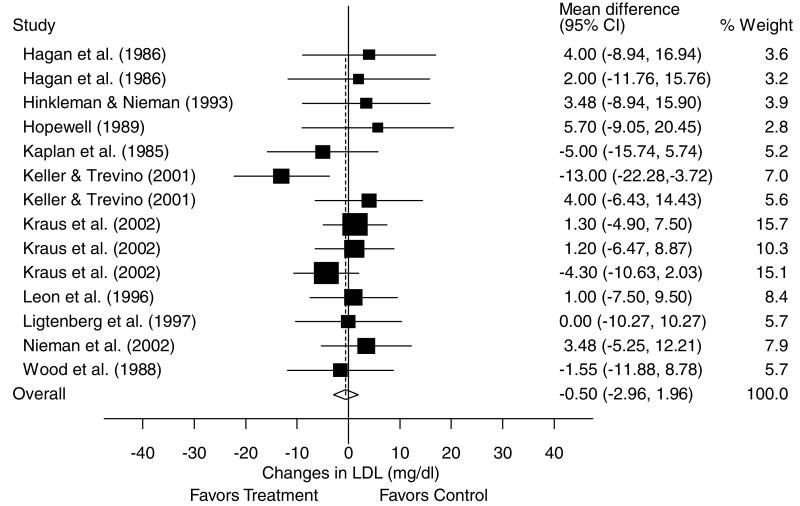
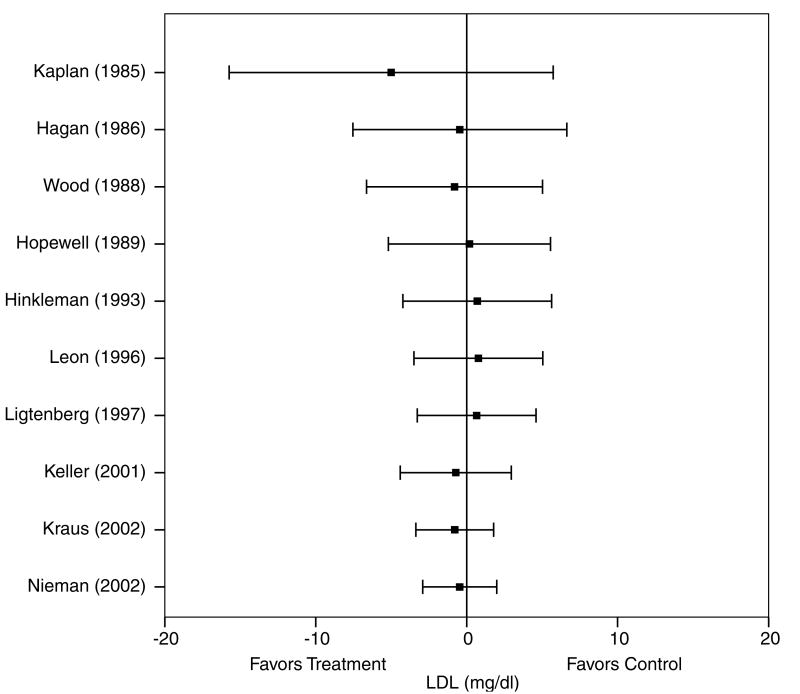
A description of the results for LDL is shown in Table 4 and Figure 5. Across all categories, there was a statistically nonsignificant exercise minus control reduction of approximately 0.3% (X̄±s.e.m., −0.5±1.3 mg/dl, 95% CI, −3.0 to 2.0 mg/dl). No statistically significant publication bias was observed (P = 0.41). Cumulative meta-analysis, ranked by year, revealed that decreases in LDL have been in the direction of benefit but statistically nonsignificant since 2001 (Figure 6). With each study deleted from the model once, reductions in LDL were nonsignificant throughout the range of both high (−0.8±1.3 mg/dl, 95% CI, −3.4 to 1.8 mg/dl) and low (−0.2±1.7 mg/dl, 95% CI, −3.6 to 3.2 mg/dl) values. With those studies in which changes in diet, cigarette smoking, and/or drugs that could affect lipids and lipoproteins deleted from the model, changes in LDL remained nonsignificant (X̄±s.e.m., 0.1±1.6 mg/dl, 95% CI, −2.9 to 3.2 mg/dl). Results also remained nonsignificant when studies limited to premenopausal and postmenopausal women were deleted from the model (premenopausal, X̄±s.e.m., −0.1±1.4 mg/dl, 95% CI, −2.9 to 2.6 mg/dl; postmenopausal, X̄±s.e.m., −0.5±1.4 mg, 95% CI, −3.1 to 2.2 mg/dl). Greater decreases in LDL were associated with decreases in body weight (r = 0.75, P = 0.009). No other statistically significant differences or relationships were observed for LDL when previously described subgroup and regression analyses were performed (P>0.05 for all).
Figure 5.
Forest plot for changes in LDL and 95% CI for each outcome as well as the overall weighted mean difference and 95% CI. The size of the black boxes for each outcome represents the weight given to that outcome. The overall mean difference is shown by the middle of the diamond while the left and right extremes of the diamond represent the corresponding 95% CI. The vertical dashed line represents the overall mean.
Figure 6.
Cumulative meta-analysis, ranked by year, for changes in LDL. Each horizontal line and black square represent the summary of results as studies from the previous years are combined with the listed study. The black squares represent the point estimates while the lines represent the lower (left) and upper (right) 95% CI. Estimates are based on 14 outcomes from 10 studies.
Triglycerides
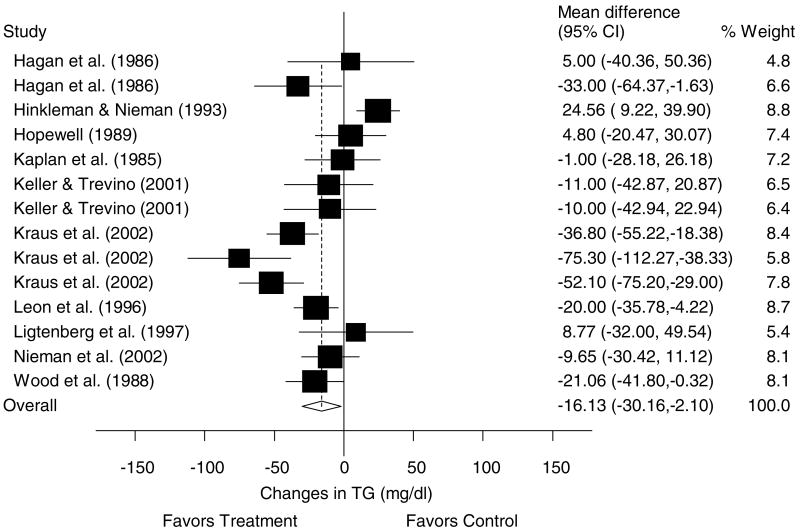
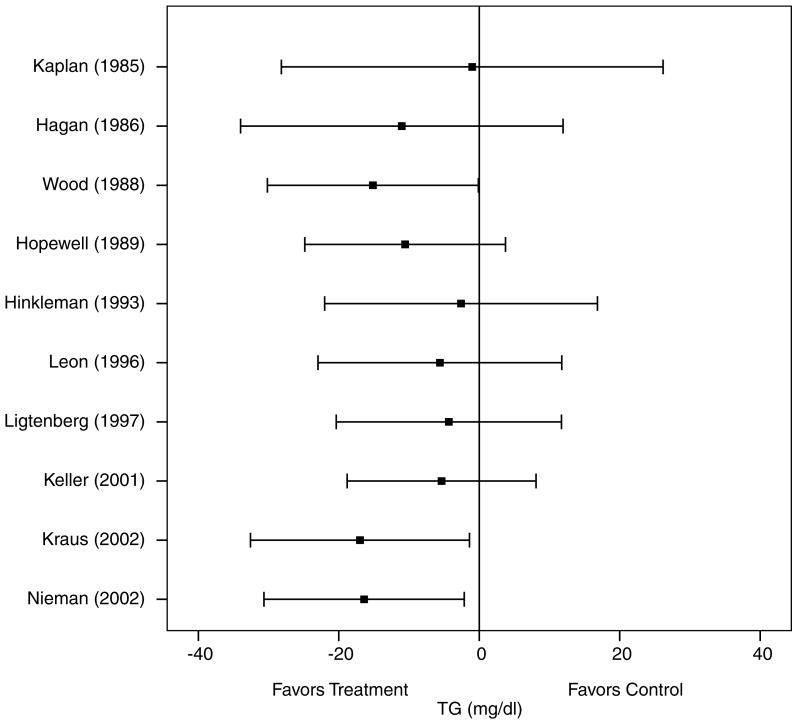
A description of the results for TG is shown in Table 4 and Figure 7. Across all categories, there was a statistically significant exercise minus control reduction of approximately 11% (X̄±s.e.m., −16.1±7.3 mg/dl, 95% CI, −30.2 to −2.1 mg/dl). No statistically significant publication bias was observed (P = 0.49). Cumulative meta-analysis, ranked by year, revealed that decreases in TG have been in the direction of benefit and statistically significant since 2002 (Figure 8). With each study deleted from the model once, reductions in TG were statistically significant throughout the range of both high (−20.7±6.0 mg/dl, 95% CI, −32.5 to −8.9 mg/dl) and low (−5.7±6.1 mg/dl, 95% CI, −17.8 to −6.2 mg/dl) values. With those studies in which changes in diet, cigarette smoking, and/or drugs that could affect lipid and lipoproteins deleted from the model, changes in TG remained statistically significant (X̄±s.e.m., −25.3±9.5 mg/dl, 95% CI, −44.0 to −6.5 mg/dl). Results also remained statistically significant when studies limited to premenopausal and postmenopausal women were deleted from the model (premenopausal, X̄±s.e.m., −24.9±6.9 mg/dl, 95% CI, −38.5 to −11.4 mg/dl; postmenopausal, X̄±s.e.m., −17.9±7.6 mg, 95% CI, −32.7 to −3.1 mg/dl). No other statistically significant differences or relationships were observed for TG when previously described subgroup and regression analyses were performed (P>0.05 for all).
Figure 7.
Forest plot for changes in TG and 95% CI for each outcome as well as the overall weighted mean difference and 95% CI. The size of the black boxes for each outcome represents the weight given to that outcome. The overall mean difference is shown by the middle of the diamond while the left and right extremes of the diamond represent the corresponding 95% CI. The vertical dashed line represents the overall mean.
Figure 8.
Cumulative meta-analysis, ranked by year, for changes in TG. Each horizontal line and black square represent the summary of results as studies from the previous years are combined with the listed study. The black squares represent the point estimates while the lines represent the lower (left) and upper (right) 95% CI. Estimates are based on 14 outcomes from 10 studies.
Secondary outcomes
Changes in secondary outcomes are shown in Table 4. As can be seen, statistically significant reductions of approximately 2% were found for both body weight and BMI while the approximate 2% decrease in percent fat was not statistically significant. A statistically significant increase of about 12% was observed for VO2max in ml/kg/min.
Discussion
The purpose of this study was to use the meta-analytic approach to examine the effects of aerobic exercise on lipids and lipoproteins in overweight and obese adults. While changes in the direction of benefit were observed for all lipid and lipoprotein outcomes (TC, HDL, LDL, TG) only decreases in TG remained statistically significant across all analyses. These findings are in contrast to our previous meta-analytic work in which we found statistically significant reductions in LDL as a result of walking programs that included adults regardless of initial BMI category (normal weight, overweight, obese).20 For TC, overall reductions equivalent to approximately 2% were found but were no longer statistically significant when each study was deleted from the model once. Based on this latter finding, we are not comfortable in concluding that aerobic exercise consistently decreases TC in overweight and obese adults.
For HDL, nonsignificant increases of approximately 3% were observed across all studies. While not indicative of cause-and-effect, greater decreases in bodyweight and increases in VO2max in ml/kg/min were associated with greater increases in HDL in our across-study analysis. This latter finding is interesting since higher levels of training intensity are associated with greater increases in VO2max in ml/kg/min,33 but no relationship between training intensity and increases in HDL were observed. One possible explanation may be the interaction between genetics and training intensity in relation to increasing VO2max in ml/kg/min. In addition, it is unknown whether the increases in HDL were a direct result of the aerobic exercise program itself and/or decreases in body weight that occurred as a result of the aerobic exercise program. Furthermore, it is important to note that our results were based on study vs individual patient estimates. Consequently, this could lead to an increased risk for ecological fallacy and/or sample selection effects across studies.
While nonsignificant decreases of less than 1% were observed for LDL, currently the primary target of therapy,2 a statistically significant relationship was observed between decreases in LDL and decreases in bodyweight. However, similar to changes in HDL, it is unknown whether the decreases in LDL were a direct result of the aerobic exercise program itself or the decreases in body weight that occurred as a result of the aerobic exercise program.
For TG, statistically significant decreases of approximately 11% were observed across all analyses and were independent of changes in body composition. Despite the fact that the lowering of LDL is currently the primary target of therapy, the lowering of TG may also be important.2 The former notwithstanding, we are not aware of any consensus that supports a reduction in cardiovascular risk with the reductions in TG observed in our study.
While aerobic exercise should almost always be recommended because of the numerous other benefits that can be derived from such,34 additional lifestyle (for example, diet) and/or pharmacologic (for example, statins) interventions may be necessary for improving lipids and lipoproteins to a level sufficient for reducing cardiovascular risk. However, it is important to point out that recent research has found that the benefits of aerobic exercise may not be derived so much from the improvement of lipid and lipoprotein levels, but rather from changes in the physical structure of protein particles that carry cholesterol through the bloodstream.10 Kraus et al10, in their 24-week study, examined 111 sedentary, overweight, men and women who were randomly assigned to one of three intervention groups (walking 12 miles per week, jogging 12 miles per week, jogging 20 miles per week) or a control group. The authors found that aerobic exercise increased the large, less dense protein particles that are less likely to contribute to blocked arteries even if the subjects TC did not change. While the effects of walking and jogging 12 miles per week were similar, jogging 20 miles per week resulted in greater changes.10
Since the vast majority of studies in this investigation adhered to the American College of Sports Medicine Guidelines for aerobic exercise,33 adherence to such should generally bring about the changes observed in our study. Briefly, this includes any activity using large muscle groups (walking, jogging, cycling, etc) performed three to five times per week at an intensity of 40–85% of maximum oxygen uptake reserve for 20–60 continuous minutes.33 Lower intensity activities such as walking vs hard running may be preferable because of increased adherence and a lower risk for injury.33
In addition to reaching some general conclusions about a body of research that is based on a quantitative approach, it is the meta-analyst's responsibility to provide suggestions for future research and to try and point out weaknesses in the included data, which can ultimately effect the interpretation and generalizability of results. With the following in mind, we offer the following observations. First, since all but one study was conducted in the United States,12 it may be interesting to conduct randomized controlled trials that examine the effects of aerobic exercise in overweight and obese adults in other countries. Second, since all of the studies appeared to use an analysis-by-protocol vs intention-to-treat approach in the analysis of their data, it would seem plausible to suggest that future studies provide, and editors publish, both types of analyses in order to examine both the efficacy (does the treatment work?) and effectiveness (does the treatment work in the real world?) of aerobic exercise on lipids and lipoproteins in overweight and obese adults. Third, since the effects of aerobic exercise on lipids and lipoproteins might vary according to race/ethnicity, future studies should report, and editors should publish, complete information on the race and ethnicity of their subjects. Fourth, complete information should also be reported on any medications that subjects are taking, which might affect lipids and lipoproteins, including hormone replacement therapy and oral contraceptives. Fifth, complete information should be reported on cigarette smoking and alcohol consumption since both may have a deleterious affect on lipids and lipoproteins.2 Finally, since only one study reported that all subjects were hyperlipidemic10 and none reported that all subjects had cardiovascular disease, it would seem reasonable to suggest that future studies include these types of populations in their randomized controlled trials since they may have the most to gain from an aerobic exercise program.
Despite the fact that we found no statistically significant effect of factors such as training program and lipid assessment characteristics on any of our lipid and lipoprotein outcomes, it is still possible that differences in these factors between studies may have biased our results. In addition, while we found no statistically significant effect of things such as diet and lipid lowering medications on lipid and lipoprotein outcomes, it may be that potential residual confounding of these factors could have impacted our lipid and lipoprotein outcomes, including TG.
In conclusion, based on the characteristics of subjects included in our studies, our results suggest that aerobic exercise decreases TG in overweight and obese adults. However, a need exists for additional randomized controlled trials in various overweight and/or obese populations above and beyond those included in our analysis.
Acknowledgments
We thank William Haskell, PhD, Stanford University, for reviewing our reference list and providing suggestions for the coding of studies. This study was supported by a grant from the National Institutes of Health-National Heart, Lung and Blood Institute, Award #R01-HL069802 (GA Kelley, Principal Investigator).
References
- 1.Flegal KM, Carroll MD, Ogden CL, Johnson CL. Prevalence and trends in obesity among US adults, 1999–2000. JAMA. 2002;288:1723–1727. doi: 10.1001/jama.288.14.1723. [DOI] [PubMed] [Google Scholar]
- 2.Expert Panel on Detection, Evaluation, and Treatment of High Blood Cholesterol in Adults. Executive summary of the third report of the National Cholesterol Education Program (NCEP) Expert Panel on Detection, Evaluation, and Treatment of High Blood Cholesterol in Adults (Adult Treatment Panel III) JAMA. 2001;285:2486–2497. doi: 10.1001/jama.285.19.2486. [DOI] [PubMed] [Google Scholar]
- 3.Campbell DE. Effect of controlled running on serum cholesterol of young adult males of varying morphological constitutions. Res Q. 1968;39:47–53. [PubMed] [Google Scholar]
- 4.Gillett PA, Caserta MS, White AT, Martinson L. Responses of 49- to 59-year old sedentary, overweight women to four months of exercise conditioning and/or fitness education. Activities Adaptation Aging. 1995;19:13–32. [Google Scholar]
- 5.Hagan RD, Upton SJ, Wong L, Whittam J. The effects of aerobic conditioning and/or caloric restriction in overweight men and women. Med Sci Sports Exerc. 1986;18:87–94. [PubMed] [Google Scholar]
- 6.Hinkleman LL, Nieman DC. The effects of a walking program on body composition and serum lipids and lipoproteins in overweight women. J Sports Med Phys Fitness. 1993;33:49–58. [PubMed] [Google Scholar]
- 7.Hopewell R. The effect of fiber and exercise on weight loss and blood lipids in moderately overweight women. West Virginia University; Morgantown, West Virginia: 1989. [Google Scholar]
- 8.Kaplan RM, Wilson DK, Hartwell SL, Merino KL, Wallace JP. Prospective evaluation of HDL cholesterol changes after diet and physical conditioning programs for patients with type II diabetes mellitus. Diabetes Care. 1985;8:343–348. doi: 10.2337/diacare.8.4.343. [DOI] [PubMed] [Google Scholar]
- 9.Keller C, Trevino RP. Effects of two frequencies of walking on cardiovascular risk factor reduction in Mexican American women. Res Nurs Health. 2001;24:390–401. doi: 10.1002/nur.1039. [DOI] [PubMed] [Google Scholar]
- 10.Kraus WE, Houmard JA, Duscha BD, Knetzger KJ, Wharton MB, McCartney JS, Bales CW, Henes S, Samsa GP, Otvos JD, Kulkarni KR, Slentz CA. Effects of the amount and intensity of exercise on plasma lipoproteins. N Engl J Med. 2002;347:1483–1492. doi: 10.1056/NEJMoa020194. [DOI] [PubMed] [Google Scholar]
- 11.Leon AS, Casal D, Jacobs D. Effects of 2,000 kcal per week of walking and stair climbing on physical fitness and risk factors for coronary heart disease. J Cardiopulm Rehabil. 1996;16:183–192. doi: 10.1097/00008483-199605000-00006. [DOI] [PubMed] [Google Scholar]
- 12.Ligtenberg PC, Hoekstra JB, Bol E, Zonderland ML, Erkelens DW. Effects of physical training on metabolic control in elderly type 2 diabetes mellitus patients. Clin Sci (London) 1997;93:127–135. doi: 10.1042/cs0930127. [DOI] [PubMed] [Google Scholar]
- 13.Nieman DC, Brock DW, Butterworth D, Utter AC, Nieman CC. Reducing diet and/or exercise training decreases the lipid and lipoprotein risk factors of moderately obese women. J Am Coll Nutr. 2002;21:344–350. doi: 10.1080/07315724.2002.10719233. [DOI] [PubMed] [Google Scholar]
- 14.Sopko G, Leon AS, Jacobs DR, Foster N, Moy J, Kuba K, Anderson JT, Casal D, McNally C, Frantz I. The effects of exercise and weight loss on plasma lipids in young obese men. Metabolism. 1985;34:227–236. doi: 10.1016/0026-0495(85)90005-8. [DOI] [PubMed] [Google Scholar]
- 15.Verity LS, Ismail AH. Effects of exercise on cardiovascular disease risk in women with NIDDM. Diabetes Res Clin Pract. 1989;6:27–35. doi: 10.1016/0168-8227(89)90054-5. [DOI] [PubMed] [Google Scholar]
- 16.Wood PD, Stefanick ML, Dreon DM, Frey-Hewitt B, Garay SG, Williams PT, Superko HR, Fortmann SP, Albers JJ, Vranizan KM, Ellsworth NM, Terry RB, Haskell WL. Changes in plasma lipids and lipoproteins in overweight men during weight loss through dieting as compared with exercise. N Engl J Med. 1988;319:1173–1179. doi: 10.1056/NEJM198811033191801. [DOI] [PubMed] [Google Scholar]
- 17.Hedges LV, Olkin I. Vote-counting methods in research synthesis. Psychol Bull. 1980;88:359–369. [Google Scholar]
- 18.Durstine JL, Grandjean PW, Davis PG, Ferguson MA, Alderson NL, DuBose KD. Blood lipid and lipoprotein adaptations to exercise: a quantitative analysis. Sports Med. 2001;31:1033–1062. doi: 10.2165/00007256-200131150-00002. [DOI] [PubMed] [Google Scholar]
- 19.Halbert JA, Silagy CA, Finucane P, Withers RT, Hamdorf PA. Exercise training and blood lipids in hyperlipidemic and normolipidemic adults: a meta-analysis of randomized, controlled trials. Eur J Clin Nutr. 1999;53:514–522. doi: 10.1038/sj.ejcn.1600784. [DOI] [PubMed] [Google Scholar]
- 20.Kelley GA, Kelley KS, Tran ZV. Walking, lipids, and lipoproteins: a meta-analysis of randomized controlled trials. Prev Med. 2004;38:651–661. doi: 10.1016/j.ypmed.2003.12.012. [DOI] [PubMed] [Google Scholar]
- 21.Leon AS, Sanchez OA. Response of blood lipids to exercise training alone or combined with dietary intervention. Med Sci Sports Exerc. 2001;33:S502–S515. doi: 10.1097/00005768-200106001-00021. [DOI] [PubMed] [Google Scholar]
- 22.Lokey EA, Tran ZV. Effects of exercise training on serum lipid and lipoprotein concentration in women: a meta-analysis. Int J Sports Med. 1989;10:424–429. doi: 10.1055/s-2007-1024937. [DOI] [PubMed] [Google Scholar]
- 23.Tran ZV, Weltman A. Differential effects of exercise on serum lipid and lipoprotein levels seen with changes in body weight: a meta-analysis. JAMA. 1985;254:919–924. [PubMed] [Google Scholar]
- 24.Tran ZV, Weltman AW, Glass GV, Mood DF. The effects of exercise on blood lipids and lipoproteins: a meta-analysis of studies. Med Sci Sports Exerc. 1983;15:393–402. [PubMed] [Google Scholar]
- 25.Dersimonian R, Laird N. Meta-analysis in clinical trials. Control Clin Trials. 1986;7:177–188. doi: 10.1016/0197-2456(86)90046-2. [DOI] [PubMed] [Google Scholar]
- 26.Cochran WG. The combination of estimates from different experiments. Biometrics. 1954;10:101–129. [Google Scholar]
- 27.Higgins JPT, Thompson SG, Deeks JJ, Altman DG. Measuring inconsistency in meta-analyses. Br Med J. 2003;327:557–560. doi: 10.1136/bmj.327.7414.557. [DOI] [PMC free article] [PubMed] [Google Scholar]
- 28.Egger M, Davey Smith G, Schneider M, Minder C. Bias in meta-analysis detected by a simple graphical test. Br Med J. 1997;315:629–634. doi: 10.1136/bmj.315.7109.629. [DOI] [PMC free article] [PubMed] [Google Scholar]
- 29.Jadad AR, Moore RA, Carroll D, Jenkinson C, Reynolds DJM, Gavaghan DJ, McQuay HJ. Assessing the quality of reports of randomized clinical trials: Is blinding necessary? Control Clin Trials. 1996;17:1–12. doi: 10.1016/0197-2456(95)00134-4. [DOI] [PubMed] [Google Scholar]
- 30.West S, King V, Carey T, Lohr K, McKoy N, Sutton S, Lux L. Systems to rate the strength of scientific evidence, Evidence Report/Technology Assessment No 47 AHRQ (Publication No 02-E016) Agency of Healthcare Research and Quality; Rockville, MD: 2002. [Prepared by Research Triangle Institute-University of North Carolina Evidenced-Based Practice Center under Contract No. 290-97-0011] [PMC free article] [PubMed] [Google Scholar]
- 31.Alderson P, Green S, Higgins JPT. Cochrane Reviewers' Handbook 4.2.1. 2004 [updated December 2003] http://www.cochrane.org/resources/handbook/hbook.htm.
- 32.Lipsey MW, Wilson DB. Practical meta-analysis. Sage; Thousand Oaks, CA: 2001. [Google Scholar]
- 33.American College of Sports Medicine. The recommended quantity and quality of exercise for developing and maintaining cardiorespiratory and muscular fitness, and flexibility in healthy adults. Med Sci Sports Exerc. 1998;30:975–991. doi: 10.1097/00005768-199806000-00032. [DOI] [PubMed] [Google Scholar]
- 34.Booth FW, Chakravarthy MV, Gordon SE, Spangenburg EE. Waging war on physical inactivity: using modern molecular ammunition against an ancient enemy. J Appl Physiol. 2002;93:3–30. doi: 10.1152/japplphysiol.00073.2002. [DOI] [PubMed] [Google Scholar]


