Abstract
For glioblastomas, COX-2 expression is linked to poor survival. COX-2 effects are mediated by the receptors EP2 and EP4, whose regulation is poorly understood. The expression of EP4, and activation or inhibition of EP4 activity in human glioblastoma T98G cells, was found to correlate with growth on soft agar. Chemoprevention drugs, troglitazone (TGZ) and some COX inhibitors, significantly suppressed EP4 expression in T98G cells in a dose dependant manner. Specificity protein 1 (Sp-1) binding sites, located within region −197 to −160 of the human EP4 promoter, are important for the transcription initiation of the human EP4 gene and are responsible for the EP4 suppression by TGZ. Mutation in the Sp-1 sites altered the promoter activity of luciferase constructs and TGZ effects on the promoter. The inhibitory effect of TGZ on EP4 expression was reversed by PD98059, a MEK-1/Erk inhibitor. Immunoprecipitation-Western blot analysis detected Sp-1 phosphorylation that was dependent on TGZ-induced Erks activation. ChIP assay confirmed that Sp-1 phosphorylation decreases its binding to DNA and as a result, leads to the suppression of EP4 expression. Thus, we propose that the expression of EP4 is regulated by Sp-1, but phosphorylation of Sp-1 induced by TGZ suppresses this expression. This represents a new and unique mechanism for the regulation of the EP4 receptor expression.
Keywords: Sp-1 phosphorylation, PPAR, Prostaglandin EP4 receptor, Glioblastoma, Erks activation
Introduction
Glioblastomas are the most common primary malignant tumors arising from the CNS, and are one of the most lethal, treatment-resistant human malignant tumors. Despite advancements in cancer therapies including surgery, radiation therapy, and chemotherapy, the median survival time is 12 to 15 months for patients newly diagnosed with glioblastoma [1]. Thus, there is an urgent need for new approaches for the treatment of glioblastomas. The overexpression of cyclooxygenase-2 (COX-2) is observed in several human cancers and increased COX-2 expression is associated with a poor prognosis in colon [2], breast [3], ovarian [4], and pancreatic cancers [5]. COX-2 overexpression results in the overproduction of PGE2, promoting tumor growth by binding to G protein-coupled receptors designated EP1, EP2, EP3 and EP4. The EP receptor signaling pathways control cell proliferation, invasion, apoptosis, and angiogenesis. EP2 and EP4 receptor activation is linked to increased β-catenin/T-cell factor transcriptional activity via phosphorylation of glycogen synthase kinase 3 (GSK-3) and hence it’s inhibition [6]. Deletion of the EP2 and EP4 receptors in mice causes a reduction of tumor growth in colorectal [7] and breast [8] cancers. EP2 and/or EP4 expression is up-regulated compared with normal tissues in colorectal [7] and breast [9] cancers. EP4 mRNA expression is up-regulated in human astrocytoma cells [10]. Raza et al. reported that the EP4 expression in 15 surgically resected glioblastoma tissues is up-regulated compared to the expression in tissues from 5 anaplastic astrocytomas [11]. Shono and his colleagues reported that high COX-2 expression is associated with clinically more aggressive gliomas and is a strong predictor of a poor survival [12]. Thus COX-2, via the activation of EP2 and EP4, is a potential modulator of glioblastoma progression.
COX-2 inhibitors may be useful in preventing the development and progression of glioblastomas, but the recently discovered toxic side effects appears to eliminate their clinical usefulness. However, EP2 and EP4 receptors are possible targets for new drug development and antagonists, or drugs that inhibit or suppress EP2/EP4 expression, should influence cancer development. The regulation of EP2 and EP4 has not been extensively investigated. PPAR γ ligands inhibit the expression of EP2 while PPAR β ligands increase the expression of EP4 in human lung tumor cells [13, 14]. In addition to inhibition of COX-1/-2, many COX inhibitors alter gene expression [15, 16], and these changes in expression appear to contribute to the prevention of tumors by these drugs. Drugs like sulindac sulfide and indomethacin, as well as other chemopreventive drugs, increase the expression of the tumor suppression gene, nonsteroidal anti-inflammatory drug-activated gene-1 (NAG-1) [17–19]. This increase in NAG-1 is mediated by altered expression of the transcription factor early growth response gene 1 (Egr-1), which may be a tumor suppressor altering the expression of a number of genes. The PPARγ ligand, TGZ, also increases NAG-1 via Egr-1 expression by a mechanism independent of PPARγ activation [20]. The mouse EP4 promoter contains many transcription sites including C/EBP, Sp1, and AP-2, and these site are linked to responses to different stimuli [16]. Sp-1 sites frequently overlap with Egr-1 binding sites and interplay between Egr-1 and Sp-1 exists, but a functional Egr-1/Sp-1 site has not been characterized in the human EP4 promoter. In this report we have investigated if drug induced changes in the expression of Egr-1/Sp-1 alters the expression of EP2 or EP4 in human glioblastomas.
Materials and Methods
Cell Lines and Reagents
Human glioblastoma cell lines (A172, T98G, U87MG, U138MG, and U373MG) and human astrocytoma cell lines (SW1783 and SW1088) were purchased from American Type Culture Collection (Manassas, VA). Human glioblastoma cell lines were grown in Eagle’s minimal essential medium (EMEM) with 1mM MEM Sodium Pyruvate Solution (Gibco, Grand Island, NY), 2mM L-Glutamine (Gibco), 10 µg/ml gentamicin (Gibco), and 10% fetal bovine serum (FBS). Human astrocytoma cell lines were grown in Leibovit’s L-15 Media with 10 µg/ml gentamicin and 10% FBS. TGZ, Ciglitazone, Rosiglitazone, MCC-555, Pioglitazone, the PPARα agonist Wy14643, EP4 agonist PGE1-OH, and anti-EP2, anti-EP4, and anti-PPARγ antibodies were purchased from Cayman Chemical Co., Inc. (Ann Arbor, MI). The MEK-1/Erk Inhibitor PD98059 and the p38 inhibitor SB203580 were purchased from EMD Biosciences (San Diego, CA) and the PI3-kinase Inhibitor Wortmannin, anti-phospho-Erk MAPK (Thr202/Tyr204), and anti-Egr-1 antibodies were purchased from Cell Signaling Technology (Beverly, MA). Anti-Sp-1 (sc-59), anti-Sp-3 (sc-644), anti-Erk 1 (sc-93), anti-Erk 2 (sc-154), anti-phosphothreonine (sc-5267), and anti-actin (sc-1615) antibodies were purchased from Santa Cruz Biotechnology (Santa Cruz, CA). EP 4 antagonist AH23848 was purchased from Sigma-Aldrich (St. Louis, MO). All chemicals were dissolved in 0.1% Me2SO and stocked at appropriate concentrations according to manufacturer’s information.
Colony formation in Soft agar assay
T98G cells were resuspended at 2 × 10³ cells in 1 ml of 0.35% agar solution containing MEM, 10% FBS, 1mM MEM Sodium Pyruvate Solution, 2mM L-Glutamine, and the final concentration of TGZ (20µM), EP4 agonist (PGE1-OH) (10µM) or EP4 antagonist (AH23848) (30µM), then layered on top of a 0.7% agar layer in 6-well plates. For EP4 knock-down or overexpression, T98G cells were transfected with 100 nM of EP4 siRNA (M-005714-00, Dharmacon) or 3 µg of EP4 cDNA that was sub-cloned into pcDNA3.1 from UMR cDNA Resource Center (Rolla, MO). The effect of EP4 knock-down or overexpression was confirmed by Western blot analysis and real-time RT-PCR (data not shown). After 24h transfection, the cells were trypsinized and resuspended in 0.35% agar solution. Plates were incubated for 2 weeks at 37 °C in a 5% CO2 humidified atmosphere. Cell colonies were visualized following an overnight stain with 0.5 ml of p-iodonitrotetrazolium violet (Sigma-Aldrich) and examined microscopically. These were represented as mean colony number examined in 10 randomly chosen microscope fields.
Western Blot Analysis
Total cell lysates were isolated in RIPA buffer [1X PBS, 1% Triton X-100, 0.5% sodium deoxycholate, 0.1% SDS, 1 mM Na3 VO4, 1 mM NaF, 1 µM Okadaic acid, 10 mM β-glycerolphosphate, and Complete Mini protease inhibitor cocktail tablets from Roche (Indianapolis, IN). Quantitation of protein was performed by BCA assay (Pierce, Rockfold, IL) and 50 µg of total proteins were separated by SDS-PAGE 4–12% Bis-Tris gel (Invitrogen, Carlsbad, CA) and transferred onto a nitrocellulose membrane (Invitrogen). The blots were blocked for 1 h with 5% skim milk in Tris-buffered saline containing 0.05% Tween-20 (TBS-T) (Sigma-Aldrich) and probed overnight at 4 °C with 5% skim milk in TBS-T with each primary antibody. After washing with TBS-T, the blots were incubated with the appropriate horseradish peroxidase-conjugated secondary antibody for 1h at room temperature with 5% skim milk in TBS-T and washed several times in TBS-T. Proteins were detected by the enhanced chemilluminescence system (Amersham Biosciences, Piscataway, NJ).
Immunoprecipitation
1 mg of nuclear extracts was prepared with Nuclear Extract kit (Active Motif, Carlsbad, CA) according to the manufacturer’s protocol. The nuclear extract was precleaned with 60 µl of Protein A/G PLUS-Agarose (sc2003, Santa Cruz) by incubating for 1h at 4 °C. After pelleting agarose beads, the supernatant was transferred to a new tube and immunoprecipitated with 5 µg of anti-Sp-1 antibody overnight at 4 °C. For a negative control, normal rabbit IgG (sc-2027, Santa Cruz) was added to the sample instead of anti-Sp-1 antibody. Immunocomplex was collected by adding 40 µl of agarose beads and incubating for 3h at 4 °C. After removal of the supernatant and washing the beads four times with RIPA buffer, the beads were resuspended in 30 µl of 1X LDS buffer and boiled for 5 min at 100 °C. The samples were separated by SDS-PAGE 4–12% Bis-Tris gel and transferred onto a nitrocellulose membrane. The immunoprecipitated proteins were analyzed by immunoblotting using anti-phosphothreonine (p-Thr) antibody diluted 1:50.
Real-time RT-PCR
Real-time RT-PCR assays were performed using an ABI Prism 7700 (Applied Biosystems, Foster City, CA). Real time RT-PCR fluorescence detection was performed in 96-well plates with Quantitect SYBR Green buffer (Qiagen). The sequences of PCR primers (Invitrogen) used by real-time RT-PCR were designed according to published data [10] and are as follows: Human EP2 5’-CGAGACGCGACAGTGGCTTCC-3’ (sense), 5’-CGAGACGCGGCGCTGGTAGA-3’ (antisense), Human EP4 5’-TCGCGCAAGGAGCAGAAGGACAC-3’ (sense), 5’-GACGGTGGCGAGAATGAGGAAGGA -3’ (antisense), Human actin 5’-GCCGATCCACAGGGAGTA-3’ (sense), 5’-CCTGGCACCCAGCACAAT-3’ (antisense). The experiments were performed in duplicate three times with individual time-matched vehicle-treated controls for each gene tested. Amplified product size was routinely checked by gel electrophoresis on a 1% agarose gel in the presence of 0.1 µg/ml ethidium bromide then visualized under UV light to confirm that only one product was formed.
Constructions of Plasmid
Human EP4 promoter luciferase constructs were generated by PCR using human genomic DNA (Promega, Madison WI). At first, the EP4 promoter region of −1236 to −42 was generated using the primers 5’-GCAGATGGGAAGAGGTTTTT-3’ (sense) and 5’-TTCTCCTCCTCCAAGTTTCC-3’ (antisense). The primer designs were determined based on the previously published sequence of the 5’-flanking region upstream of the transcription initiation site for human EP4 [21]. To construct the intact EP4 promoter region (pEP4-1, −1238 to +1), which contains Nhe I (upstream) and Hind III (downstream) restriction sites, PCR was subsequently carried out using the incomplete EP4 constructs (−1236 to −42) as a template and the primers were designed as follows: 5’-GGGCTAGCCTGCAGATGGGAAGAGGTTTTTCCAGGAATTTAAA-3’ (sense), 5’-GGAAGCTTTGGAGCTCGCGTGCTGCGGCCTTTCCACCCTCTGTACAAACTTTTCTCCTCCT-3’ (antisense). PCR products and the pGL3-basic vector (Promega) were digested with Nhe I and Hind III restriction enzymes (New England Biolabs, Beverly, MA) and then purified with QIAquick® PCR purification kit (Qiagen). Purified products were ligated using DNA Ligation kit Ver.2.1 (TaKaRa, Shiga, Japan) and sequenced-verified. Another EP4 promoter deletion constructs were generated using the primers of following sequences: pEP4-2 (−238 to +1): 5’-GGGGCTAGCCTCCGAGGGCGTGAAA-3’ (sense), pEP4-3 (−197 to +1): 5’-GGGGCTAGCGCCCAGCCCCGCCCCA-3’ (sense), pEP4-4 (−160 to +1): 5’-GGGGCTAGCAGTCTTCCCTGCGGC-3’ (sense). The sequence of antisense primer for all EP4 deletion constructs is as follows: 5’-GGAAGCTTTGGAGCTCGCGTGCTGCGGCCTTTC-3’. The pEP4-3 constructs incorporated point mutations in Sp-1 or AP-2α binding sites were created using QuikChange® II site-directed mutagenesis kit (Stratagene, La Jolla, CA) according to the manufacturer’s protocol. Each Sp-1 or AP-2α binding site was point-mutated to the two TT base pairs (indicated by underline) in pEP4-3 constructs and primer designs were as follows: mut. Sp-1A pEP4-3: 5’-GCGCCCAGCCCTTCCCCAGCCCAGAC-3’, mut. Sp-1B pEP4-3: 5’-CAGCCCAGACACTTCCCCCCGCCAG-3’, mut. AP-2 pEP4-3: 5’-CAGCCCAGACACCGCCCCTTGCCAG-3’. Each construct was sequenced-verified to confirm the incorporation of the appropriate mutation. The PPARγ wild type plasmid was a kind gift from Dr. Cary E. Clay (Department of Cancer Biology, Wake Forest University Baptist Medical Center, Medical Center Boulevard, Winston Salem, North Carolina, 27157 USA). The Sp-1-dependent reporter plasmid containing 6 Sp-1 binding sites (pGAGC6) and the control plasmid (pGAM) were kindly provided by Professor Jeffrey E. Kudlow (Division of Endocrinology, Diabetes and Metabolism, The University of Alabama at Birmingham, Birmingham, Alabama, 35294 USA). The Sp-1 expression plasmid was reported previously by our laboratory [22]. The mThr453/mThr739 Sp-1 expression plasmid, which has two mutations of residues Thr453 and Thr739, was produced using QuikChange® XL site-directed mutagenesis kit (Stratagene) and the sequences of PCR primers were described previously [23].
Luciferase Reporter Assay
T98G cells were seeded in 6-well plates at 2 × 10⁵ cells/ well in EMEM and grown to 50–60% confluence. The plasmid mixtures, containing 2 µg of EP4 promoter luciferase construct and 0.05 µg of pRL-null (Promega), were transfected using FuGENE 6 Transfection Reagent (Roche) according to the manufacturer’s protocol. The co-transfection experiment was carried out using plasmid mixtures containing 1 µg of pEP4-3 luciferase construct, 1 µg of expression plasmid (Sp-1 or mutant Sp-1), and 0.05 µg of pRL-null. The pcDNA3.1 empty vector (Invitrogen) was used as a negative control for the expression plasmid. After 24h transfection, the cells were treated with indicated concentrations of PPARγ ligands (reported in the figure legends), 10 µM Wy14643, or Control (0.1% Me2SO) for an additional 24h. For PD98059 treatment study, the cells were pretreated with 20 µM PD98059 for 1h prior to the additional 24h treatment of 20 µM TGZ. Finally, the cells were harvested in 1 × luciferase lysis buffer (Promega) and luciferase activity was measured and normalized with the values of pRL-null luciferase activity using a dual luciferase assay kit (Promega).
Short Interfering RNA (siRNA) Transfection
The Sp-1 siRNA (M-026959-00), Sp-3 siRNA (M-023096-01), and control siRNA (D-001206-08-05) were purchased from Dharmacon (Lafayette, CO). T98G cells were grown to 70–80% confluence in antibiotic-free EMEM medium and transfected with each siRNA at 100nM using Lipofectamine™ 2000 reagent (Invitrogen) and Opti-MEM® I medium (Gibco) according to the manufacturer’s instructions. After incubating for 5h, the cells were washed and changed to the complete media and recovered overnight. After confirming the knock-down of target genes by Western blot analysis, the cells were subsequently treated for 48h and the effect of EP4 expression by Sp-1 or Sp-3 knock-down was investigated with Western blot analysis.
Chromatin immunoprecipitation (ChIP) assay
ChIP assay was performed using the ChIP assay kit (Upstate Biotechnology, Lake Placid, NY) according to the manufacturer’s protocol. Briefly, T98G cells (3 × 10⁷) were treated with the indicated conditions for 24h and then fixed with 1% formaldehyde for 10 min at 37 °C. The fixed cells were scraped into conical tubes, pelleted, and lysed in SDS lysis buffer containing 1 mM phenylmethylsulfonyl fluoride, 1 µg/ml aprotinin, and 1 µg/ml pepstatin A. DNA was sheared to fragments of 200–800 bp by sonication 10 times for 20 s at a 50% constant maximum power. The sonicated cell supernatant was diluted 10 fold in the ChIP dilution buffer and 1% of the diluted cell supernatant was kept as a positive control (Input). The chromatin was precleared with salmon sperm DNA/protein A-agarose slurry for 1 h at 4 °C. The precleared supernatant was incubated with antibodies against Sp-1 (sc-59X, Santa Cruz), Sp-3 (sc-644X), or normal rabbit IgG overnight at 4 °C. The immunocomplexes were eluted with elution buffer (1% SDS, 0.1 M NaHCO3, 10 mM DTT). 5M NaCl was added into eluted samples to reverse histone-DNA crosslinks and the samples were heated overnight at 65 °C. Purified DNA samples were used as a template for PCR amplification. The region between −238 and −103 of the human EP4 promoter was amplified using the following primers: 5’-CTCCGAGGGCGTGAAAAC-3’ (sense), 5’-CATTGGCCGGATTGGAAG-3’ (antisense). The 136 bp products were resolved on a 2% agarose gel and visualized under UV light.
Statistical Analysis
All statistical differences between experimental groups were evaluated by the two-tailed unpaired Student’s t test.
Results
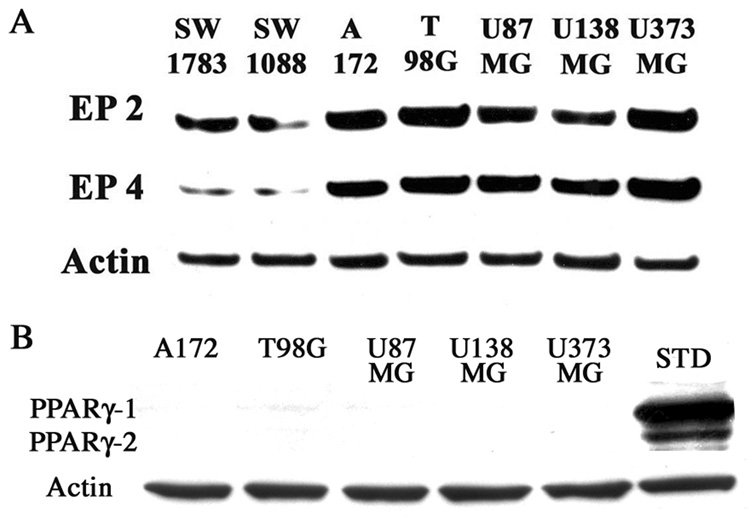
In order to select a suitable cell line for this investigation, we first examined the expression levels of EP2 and EP4 in 5 glioblastoma cell lines (A172, T98G, U87MG, U138MG, and U373MG) and 2 lower grade glioma cell lines (SW1783 and SW1088) with Western blotting analysis. EP2 and EP4 expression were observed in all cells, but the expressions in the glioblastoma cells were higher relative to the lower grade glioma cells (Fig. 1A). This finding suggests that EP2 and EP4 expression might correlate with tumor malignancy in human glioma cells. The expression of PPARγ-1/2 was also examined by Western blotting analysis and was undetectable in all glioblastoma cell lines (Fig 1B). These cells express COX-1 and COX-2 after treatment with cytokines [24] and T98G cells were selected for further experiments because of the high expression of EP2 and EP4 proteins.
Figure 1.
EP2 and EP4 expression in glioblastoma cells are increased relative to low grade glioma cells. 2 low grade glioma cell lines (SW1783 and SW1088) and 5 glioblastoma cell lines (A172, T98G, U87MG, U138MG and U373MG) were grown to 80–90% confluency in the appropriate media. Total protein (50 µg) was subjected to Western blot analysis. The anti-Actin antibody was used for a loading control. STD represents PPARγ standard that was made by transfection of 5 µg PPARγ wild type expression plasmid into T98G cells.
Suppression of the EP2/EP4 expression
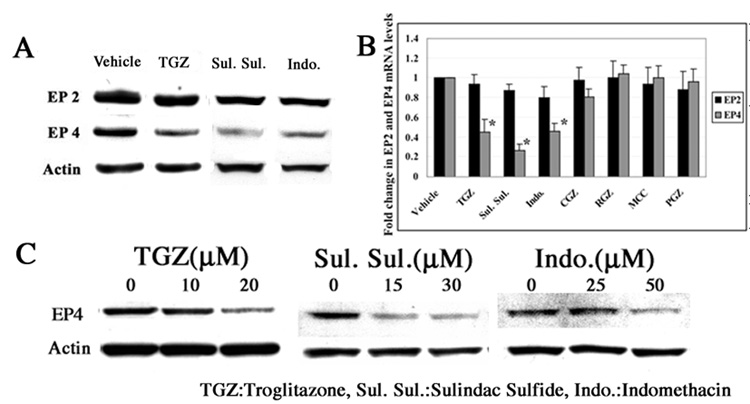
In order to determine if anti-cancer drugs that increase or alter Egr-1/Sp-1 expression would likewise alter the expression of either EP2 or EP4, T98G cells were treated with sulindac sulfide (30 µM), indomethacin (50 µM), TGZ (20 µM), and vehicle (0.1% Me2SO) for 48h. As shown in Fig. 2A, sulindac sulfide, indomethacin, and TGZ significantly suppressed the expression of EP4, and had only a modest inhibitory effect on EP2 expression. Other PPARγ ligands Rosiglitazone, MCC-555, Pioglitazone, (10 µM each), and Ciglitazone (30 µM) had no effect on either EP2 or EP4 expression as determined with real time RT-PCR analysis (Fig. 2B). Thus the suppression of EP4 by TGZ is independent of PPARγ and is in agreement with the absence of PPARγ expression in these cells. The inhibition of EP4 expression by these drugs was concentration-dependent (Fig. 2C). Prostaglandins activate EP4 receptors and activation of EP4 will increase Egr-1 expression [25]. Thus, inhibition of prostaglandin formation by sulindac sulfide and indomethacin could add further complexity to the study with T98G cells because they express COX-1/2 [26]. Thus, we decided to focus on TGZ as it does not alter prostaglandin formation, as a tool to investigate Egr-1/Sp1 and EP4 suppression.
Figure 2.
TGZ, sulindac sulfide, and indomethacin suppress EP4 expression dose-dependently in T98G cells. T98G cells were treated with Vehicle (0.1% Me2SO), 20 µM TGZ, 30 µM sulindac sulfide or 50 µM indomethacin for 48h. EP2 and EP4 expression were measured by Western blot analysis (A). For real-time RT-PCR analysis, T98G cells were treated with additional 4 PPARγligands (30 µM CGZ, 10 µM RGZ, 10 µM MCC, and 10 µM PGZ)(B). T98G cells were treated with these 3 drugs in different concentrations as indicated (C). The bar graphs represent mean ± S.D. of EP2 or EP4/Actin of three experiments, each done in duplicate. *P<0.01, significant compared with Vehicle. CGZ: Ciglitazone, RGZ: Rosiglitazone, MCC: MCC-555, PGZ: Pioglitazone.
EP4 expression and soft agar growth
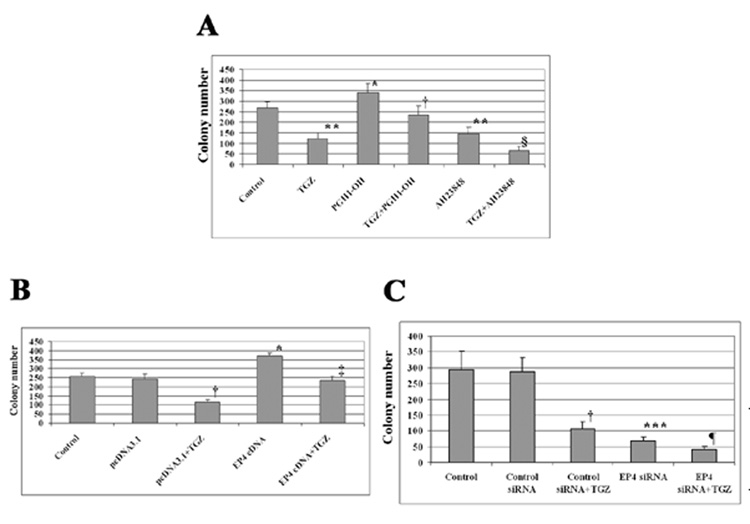
The growth of cells in soft agar is an estimate of tumorigencity and is frequently used to examine the effects of drugs and changes in gene expression on tumorigencity. Cells were treated with TGZ, PGE1-OH (EP4 agonist), or AH23848 (EP4 antagonist), and the number of colonies was measured after 2 weeks. Incubation of the cells with TGZ inhibited colony growth by ~ 50%. The EP4 agonist increased the colony number; however, the increase was blocked by co-treatment of TGZ. AH23848 (EP4 antagonist) inhibited the soft agar growth of T98G cells and was further inhibited by co-treatment of TGZ (Fig. 3A). We next transiently transfected EP4 cDNA or siRNA into T98G cells, then treated the cells with and without TGZ. As shown in Fig. 3B, the EP4 overexpression increased colony number, but co-incubation with TGZ reduced the increase. In contrast, EP4 siRNA inhibited the expression of EP4 and decreased cell growth (Fig. 3C). These findings are in agreement with the results from treatment with the EP4 agonist or antagonist. Thus an increase in EP4 expression or activation of the receptor increases colony growth, while the decrease in EP4 expression or inhibition of receptor activity reduces colony number. The data suggest that EP4 expression is an important component in the TGZ inhibition of colony growth on soft agar and indicates the importance of EP4 in tumorigenesis.
Figure 3.
Alteration of EP4 expression affects soft agar growth. T98G cells were treated with 10 µM PGE1-OH (EP4 agonist) or 30 µM AH23848 (EP4 antagonist) or co-treated with 20 µM TGZ (A). *P<0.01, **P<0.005, significant compared with Control; †P <0.005, significant compared with PGE1-OH; §P<0.005, significant compared with AH23848. T98G cells were transiently transfected with EP4 cDNA or siRNA, then treated with 20 µM TGZ (B and C). The bar graphs represent mean ± S.D of colony number of different two experiments, each done in triplicate. *P<0.01, ***P<0.001, significant compared with Control; †P<0.005, significant compared with pcDNA3.1 or Control siRNA; ‡P<0.005, significant compared with EP4 cDNA; ¶P<0.01, significant compared with EP4 siRNA.
MEK-1/Erk pathway is involved in the EP4 suppression by TGZ
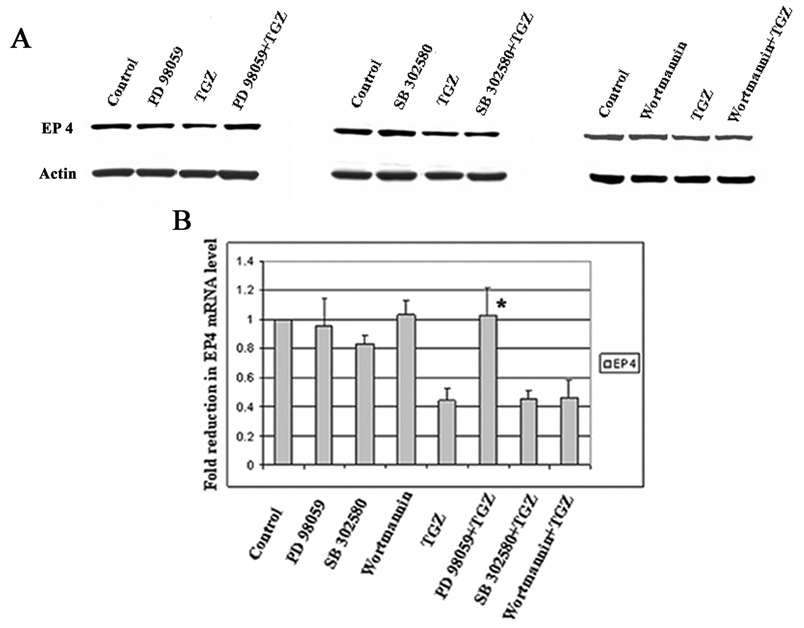
Various MAPK pathways mediate TGZ effects in several tumor cell lines [27, 28]. This laboratory previously reported data confirming the requirement for Erk in TGZ mediated increase of NAG-1 by the Egr-1 transcription pathway [20]. To determine which MAPK pathways are involved in the suppression of EP4 expression by TGZ, T98G cells were pretreated for 1h with or without MEK-1/Erk inhibitor PD98059 (20 µM), p38 MAPK inhibitor SB203580 (10 µM), and PI3-kinase inhibitor Wortmannin (100 nM), and subsequently co-treated with TGZ or vehicle as indicated. Only the MEK-1/Erk inhibitor reversed the TGZ-induced EP4 suppression (Fig. 4A). This finding was consistent with real-time RT-PCR analysis of mRNA levels (Fig. 4B). Thus, the MEK-1/Erk pathway is involved in the suppression of EP4 expression by TGZ.
Figure 4.
MEK-1/Erk pathway is involved in EP4 suppression by TGZ treatment. T98G cells were pretreated with or without 20 µM PD 98059 (MEK-1/Erk inhibitor), 10 µM SB 203580 (p38 MAPK inhibitor) or 100 nM Wortmannin (PI3-K inhibitor) prior to the addition of TGZ (20 µM) for 48h. EP4 expression was measured with Western blot analysis (A) and real-time RT-PCR (B). The bar graphs represent mean ± S.D. of EP4/Actin of three experiments, each in duplicate. *P<0.01, significant compared with TGZ.
Time dependent expression of Egr-1/Sp-1 and EP4
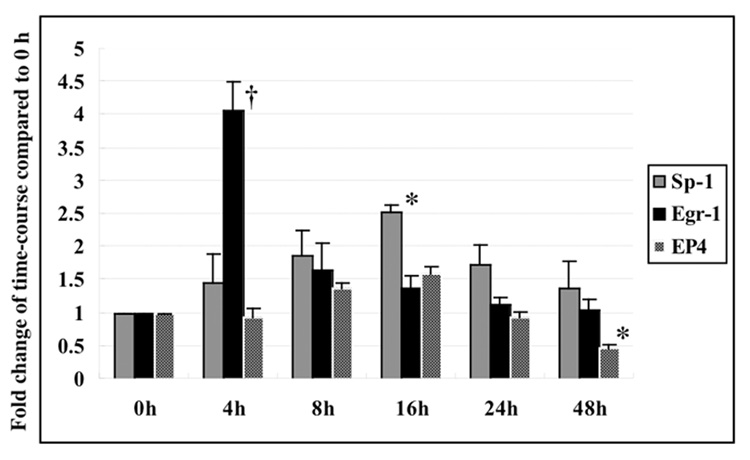
In previous experiments, we observed a rapid increase followed by a decrease in Egr-1 expression in response to TGZ treatment of HCT-116 human colorectal cells [29]. Sp-1 expression was not measured in these experiments. The time course for the expression of Egr-1, Sp-1, and EP4 in response to TGZ treatment was examined in more detail in the glioblastoma cells. A rapid increase in Egr-1 expression, peaking at 3–4 hrs, followed by a rapid decline was observed after treatment with TGZ in T98G cells. The expression of Sp-1 also increased, but was slower than Egr-1,, peaked at 16hrs, and then slowly declined over 48hrs of treatment. For EP4, a slight increase in expression (1.5-fold) was observed at 8 to 16 hrs and was followed by a decline of expression to approximately 50% of the zero time control at 48hrs. Total Sp-1 expression increased about 2.5-fold after 16 h of TGZ treatment (Fig. 5). These data point to Sp1, and not Egr-1, as an important transcription factor regulating EP4.
Figure 5.
Time course for expression of Sp-1, Egr-1 and EP4 in T98G cells. T98G cells were treated with 20 µM TGZ at different time points as indicated. The expression change of Sp-1, Egr-1 and EP4 was measured with Western blot analysis. The bar graphs represent the fold change of mean ± S.D. of Egr-1, Sp-1 or EP4/Actin compared to 0 h of three experiments, each done in duplicate. *P<0.01, †P<0.005, significant compared to 0h.
TGZ suppresses EP4 promoter activity
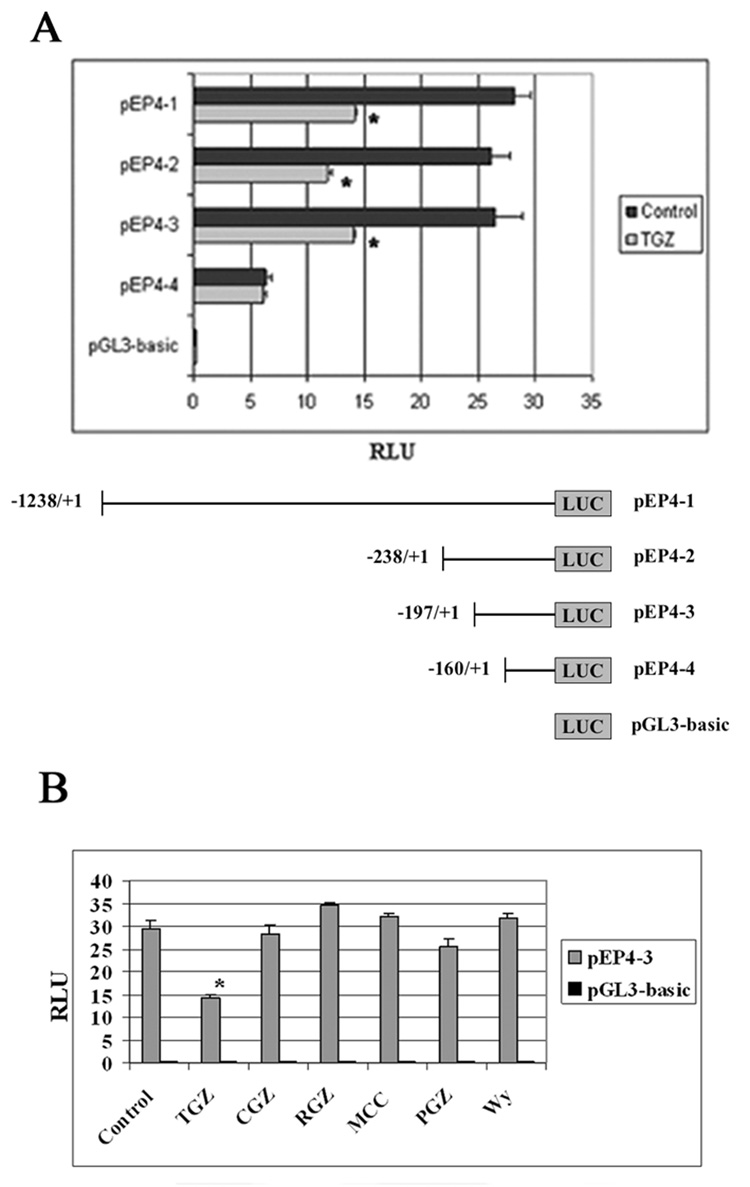
To examine the cis-acting elements in the EP4 promoter, which are responsible for EP4 suppression, T98G cells were transfected with a 1.2 kb EP4 promoter (pEP4-1), deletion constructs (pEP4-2 to 4), or pGL3-basic empty vector and then treated with TGZ for 24h. As shown in Fig. 6A, TGZ suppressed the EP4 luciferase activities of pEP4-1 to-3 constructs transfected cells. Deletion of an additional 37 nucleotides from −197 to −160 (pEP4-4) abolished TGZ-induced suppression. Furthermore, 4 additional PPARγ ligands (Ciglitazone, Rosiglitazone, MCC-555, and Pioglitazone) and one PPARα ligand (Wy14643) did not suppress luciferase activity (Fig. 6B), suggesting that the suppression is unique to TGZ. These data suggest that the TGZ response element is located in the region between −197 and −160 of the EP4 promoter.
Figure 6.
TGZ suppresses human EP4 promoter activity. Each human EP4 promoter construct (pEP4-1), other deletion constructs (pEP4-2 to 4) or pGL3-basic vector was transfected into T98G cells for 24h. The cells were treated with Control (0.1% Me2SO) or TGZ (20 µM) for 24h (A). The pEP4-3 or pGL3 was transfected into T98G cells for 24h. The transfected cells were treated with 5 PPARγ ligands (20 µM TGZ, 30 µM CGZ, 10 µM RGZ, 10 µM MCC, or 10 µM PGZ) or one PPARα ligand (10 µM Wy14643) for 24h (B). Luciferase activity was measured by a dual luciferase assay system. The bar graphs represent mean ± S.D. of RLU of three experiments. *P<0.01, significant compared with RLU of Control.
Sp-1 binding site is responsible for EP4 suppression
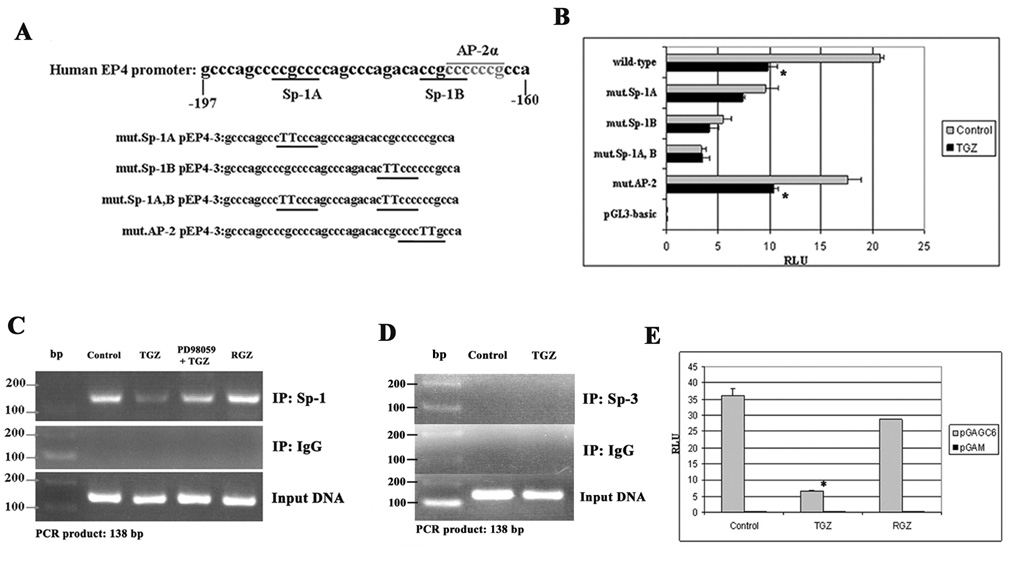
There are two Sp-1 binding sites (Sp-1 A and Sp-1 B) and an AP-2α binding site overlapping with Sp-1B site [21] (Fig. 7A) in the region between −197 and −160 of the human EP4 promoter. To determine if the Sp-1 or AP-2α binding sites are responsible for the EP4 suppression by TGZ, we generated point mutations in the Sp-1 and AP-2α binding sites of pEP4-3 constructs (Fig. 7A). The point mutations in the AP-2α binding site did not alter the suppression of EP4 luciferase activity by TGZ. In contrast, the luciferase activity of the mutant Sp-1A, B constructs was not suppressed by TGZ relative to the wild-type construct, indicating that these two Sp-1 binding sites are responsible for the transcription initiation of the EP4 gene (Fig. 7B). To confirm the binding of Sp-1 to DNA at the responsible Sp-1 binding sites, we performed a ChIP assay with primers that amplify the identified TGZ response element containing the two Sp-1 binding sites in the human EP4 promoter. As shown in Fig. 7C, Sp-1 bound to the DNA and treatment with TGZ markedly decreased DNA binding of Sp-1 relative to the control. Incubation with RGZ that does not inhibit EP4 expression also did not alter the binding of Sp-1 to DNA. The inhibitory effect of TGZ on Sp-1 binding was reversed by pretreatment with PD98059 as an Erk kinase inhibitor. This finding further supports the involvement of MEK-1/Erk pathway in the inhibition of EP4 expression by TGZ. The ChIP assay with anti-IgG failed to produce PCR products. Sp-3, a member of the Sp families, is reported to inhibit Sp-1 mediated transcription, but immunoprecipitation with an antibody for Sp-3 and the use of specific primers for Sp-3 failed to produce PCR products (Fig. 7D). To further confirm this finding, a Sp-1-dependent reporter plasmid (pGAGC6) containing 6 Sp-1 binding sites was transfected into T98G cells and the cells were treated with TGZ or RGZ (a PPARγ ligand). Only the TGZ treatment markedly suppressed the luciferase activity of pGAGC6 transfected cells (Fig. 7E). Taken together, these data indicate that the Sp-1 binding sites in the promoter play a critical role in EP4 suppression.
Figure 7.
Sp-1 binding site is responsible for EP4 suppression in T98G cells. Two Sp-1 binding sites (Sp-1A and Sp-1B) are located in the region between −197 and −160 of the human EP4 promoter. The AP-2α binding site overlaps with the Sp-1B site. Each Sp-1 or AP-2α binding site was point-mutated to TT base pairs in pEP4-3 constructs (A). The wild pEP4-3, each mutant pEP4-3, or pGL3 was transfected into T98G cells for 24h. After 24h treatment, luciferase activity was measured (B). The bar graphs represent mean ± S.D. of RLU of three experiments. *P<0.01, significant compared with each RLU of Control. T98G cells were plated in 10-cm plates at 3 × 10⁷ cells/plate and grown to 60–70% confluency. The cells were pretreated with or without PD98059 before addition of TGZ (20 µM), RGZ (10 µM) or Control, then fixed with 1% formaldehyde. 3 µl of each purified sample was used as a template for PCR amplification (C and D). 1 µg of pGAGC6 plasmid, which contains 6 Sp-1 binding sites or pGAM control plasmid and 0.05 µg of pRL-null were co-transfected into T98G cells and the cells were incubated for 24h, followed by treatment with TGZ, RGZ or Control for 24h (E). The bar graphs represent mean ± S.D. of RLU of three experiments. *P<0.01, significant differences as compared with RLU of Control.
Sp-1 is essential for the expression of EP4 in T98G cells
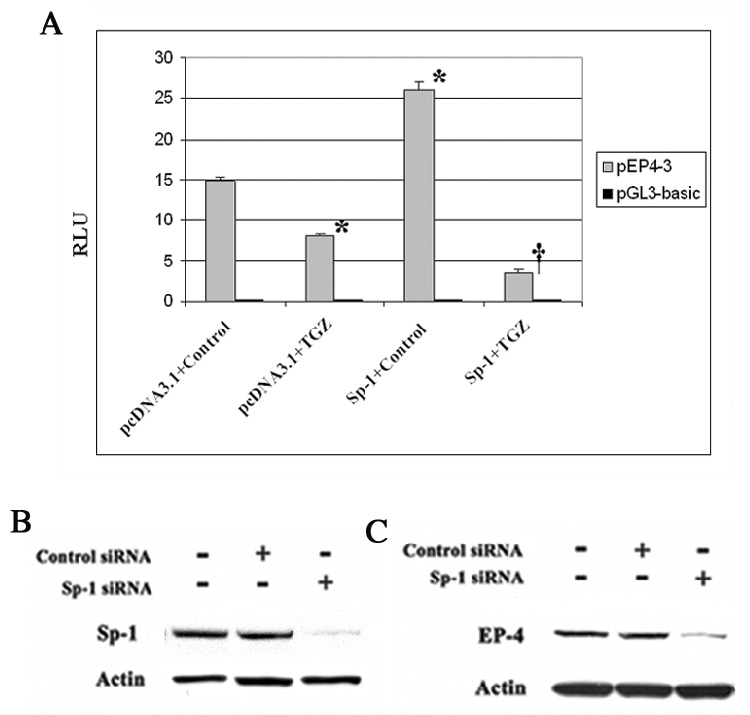
As shown in Fig. 8A, the co-transfection of pEP4-3 and Sp-1 expression plasmid increased EP4 luciferase activity, but the co-transfection of pEP4-3 and Sp-1 followed by TGZ treatment markedly suppressed the activity relative to the cells transfected with the pcDNA3.1 vector. Sp-1 siRNA transfected into T98G cells and inhibition of Sp-1 expression was first confirmed by Western blot analysis (Fig. 8B). As shown in Fig. 8C, the transfection of Sp-1 siRNA dramatically suppressed EP4 expression relative to the transfection of control siRNA. To determine if the response was specific for Sp-1, cells were transfected with Sp-3 siRNA. Sp-3 siRNA transfection did not affect EP4 suppression (data not shown). These findings indicate that the transcription factor, Sp-1 is essential for the expression of EP4 in T98G cells.
Figure 8.
Sp-1 is essential for the expression of EP4 in T98G cells. The pEP4-3 or pGL3 and Sp-1 expression plasmids or pcDNA3.1 were co-transfected into T98G cells for 24h. After 24h treatment with TGZ or Control, luciferase activity was measured (A). *; P<0.01, significant compared with pcDNA3.1+Control; †; P<0.005, significant compared with Sp-1+TGZ. Sp-1 or Control siRNA was transfected into T98G cells and the knock-down of Sp-1 was confirmed by Western blot analysis (B). After transfection of Sp-1 or Control siRNA, EP4 protein was measured with Western blot analysis (C).
Sp-1 phosphorylation and the inhibitory effect of TGZ
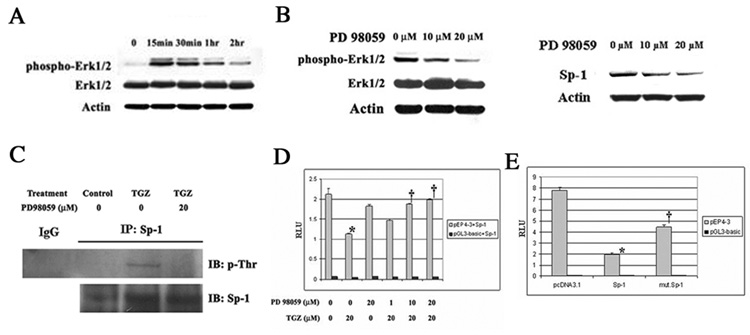
As shown in Fig. 4, MEK-1/Erk inhibitor PD98059 prevented the EP4 suppression by TGZ. We first confirmed the phosphorylation of Erk 1/2 proteins by TGZ treatment of T98G cells. TGZ dramatically induced Erk1/2 phosphorylation observed as early as 15 minutes after treatment which then declined (Fig 9A). These findings suggest that the activated Erks may alter Sp-1 expression and alter its phosphorylation Phosphorylated Erks and total Sp-1 proteins were measured after 1 h pretreatment of different concentrations of PD98059 followed by treatment with TGZ. The phosphorylation of Erk 1/2 and Sp-1 protein expression induced by TGZ were blocked by PD98059 in a concentration dependent manner (Fig. 9B). Erks can phosphorylate two specific threonine-residues (Thr453, Thr739) and other sites in Sp-1 [30]. After TGZ treatment of the cells, phosphorylated threonine-residues in Sp-1 were analyzed by immunoprecipitation with antibodies for Sp-1 followed by Western blot analysis with p-Thr and Sp-1. Phosphorylated Sp-1 was detected and pretreatment with PD98059 inhibited the formation of phosphorylated Sp-1 (Fig. 9C). Thus TGZ induced the phosphorylation of Sp-1 dependent on Erks activation and appears to play a key role in the inhibition of EP4 expression by TGZ. The addition of different concentrations of PD98059 reversed the inhibition of the EP4 reporter activity by TGZ (Fig. 9D). To further confirm the importance of Sp1 phosphorylation, we co-transfected pEP4-3, the mThr453/mThr739 Sp-1 expression plasmid, which has two mutations of residues Thr453 and Thr739 , or wild Sp-1 expression plasmid into T98G cells, and subsequently treated the cells with TGZ. EP4 promoter activity was suppressed by Sp-1 overexpression, while the transient transfection of mutated Sp-1 expression plasmid was not as effective (Fig. 9E). The Sp-1 protein and mutant Sp-1 expression protein were equally expressed (data not shown). Thus threonine phosphorylation of Sp-1 is involved in the EP4 suppression by TGZ, but other sites of phosphorylation may also be involved. These findings point to a critical role for the phosphorylation of Sp-1 in the suppression of EP4 expression by TGZ.
Figure 9.
Sp-1 is induced by TGZ via MEK-1/Erk pathway. T98G cells were treated with TGZ at indicated time points. Total or phospho-Erk1/2 expression was measured by Western blot analysis (A). T98G cells were pretreated with different amounts of PD98059 for 1h prior to the addition of TGZ for 15 min (p-Erks) or 16h (Sp-1). Sp-1 or phospho-Erk1/2 expression was measured by Western blot analysis (B). T98G cells were pretreated with or without 20 µM PD98059 for 1h, then co-treated with TGZ or Control for 16h. The immunoprecipitated proteins were subjected to Western blot analysis with anti-phosphothreonine or anti-Sp-1 antibody (C). The pEP4-3 or pGL3 and Sp-1 plasmid were co-transfected into T98G cells. After 24h incubation, the cells were pretreated with or without PD98059 at different concentrations for 1h, and then co-treated with TGZ for 24h (D). *P<0.01, significant compared with Control; †P<0.01, significant compared with TGZ treatment. The bar graphs represent mean ± S.D. of RLU of three experiments. The pEP4-3 or pGL3 and pcDNA3.1, wild Sp-1 or mThr453/mThr739 Sp-1 expression plasmid were co-transfected into T98G cells for 24h, then treated with TGZ for 24h (E). The bar graphs represent mean ± S.D. of RLU of three experiments. *P<0.001, significant compared with pcDNA3.1; †P<0.01, significant compared with Sp-1.
Discussion
PGE2, by binding its receptors, plays a predominant role in promoting tumor progression. Several reports, including knock-out studies, reveal EP4 to be important in tumor progression mediated by PGE2 [31, 32]. In glioblastomas, high COX-2 expression is associated with more aggressive gliomas and is a strong predictor of poor survival [12]. With the glioblastomas cells examined in this study, the expression of EP4 appears to correlate with the grade of the tumor (Fig. 1A). The growth of T98G cells on soft agar, a measure of tumorigenicity, is either increased or decreased by a corresponding change in the expression levels of EP4 in these cells. Drugs like TGZ appear to suppress growth on soft agar, in part, by reducing EP4 expression. How EP4 activation increases tumor growth is not clear, but EP4 inhibits glycogen synthase kinase-3 (GSK-3) via the PI3/Akt pathway, hence increasing the transcriptional activity of β-catenin [6]. PGE2 stimulates colon cancer growth via β-catenin [33]. EP4 activation also induces Erk signaling via PI3-kinase [25], which is involved in tumor cell proliferation by PGE2 [34]. Thus, the suppression of EP4 expression reduces critical oncogenic pathways and suppresses tumor growth.
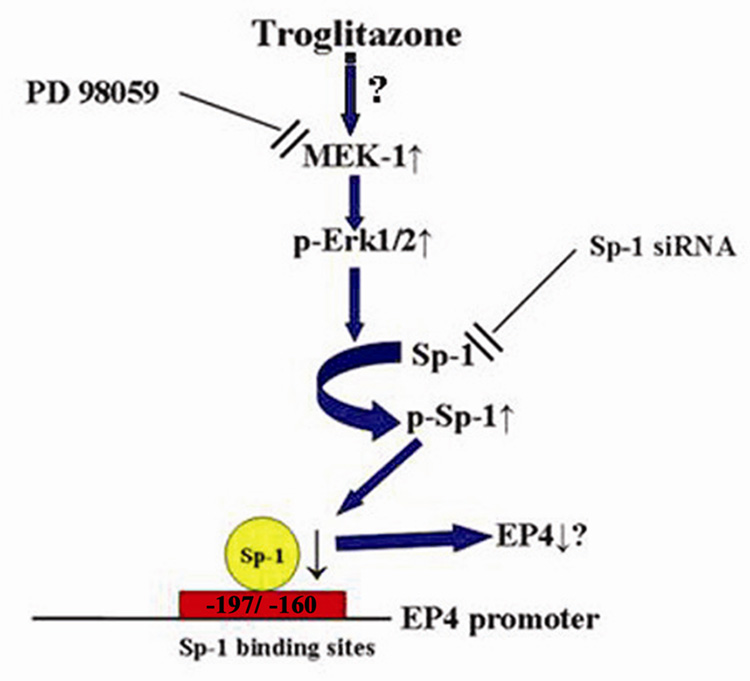
In this report, we present evidence supporting the hypothesis that TGZ suppresses EP4 expression by increasing the phosphorylation of the transcription factor Sp-1 (Fig. 10). Chien et al. reported that a GC rich/ Sp-1 binding site is important in transcription initiation of the rat EP4 gene [35]. The human EP4 promoter region contains 2 Sp-1 sites and mutation of these sites in luciferase promoter studies confirmed that Sp-1 sites are important in regulation of EP4 expression. In addition, the ChIP assay confirmed that the Sp-1 sites are important for TGZ suppression of EP4 expression. Sp-1 siRNA decreases the expression of Sp-1 and results in a decrease in the expression levels of EP4. Sugawara et al. showed that TGZ suppresses TP gene transcription via an interaction of Sp-1/DNA complex in rat vascular smooth muscle cells, which express PPARγ [36]. They proposed that the activation of PPARγ decreased the binding of Sp-1 to DNA, and led to a decrease in the expression of TP. However, we could not detect the expression of PPARγ by Western blot analysis in T98G cells. In addition, there is no obvious PPRE in human EP4 promoter region [21] supporting the conclusion that TGZ-induced EP4 suppression is not dependent on the PPARγ pathway. Thus EP4 suppression by TGZ is independent of PPARγ and the mechanisms are different from the observations of Sugawara.
Figure 10.
TGZ induces EP4 suppression via Sp-1 phosphorylation. TGZ activates MEK-1/Erk pathway and induces phosphorylation of Erks, which causes the threonine phosphorylation of Sp-1. Sp-1 phosphorylation decreases the DNA binding of Sp-1 binding sites located in the region between −197 and −160 of the human EP4 promoter, leading to the suppression of EP4 expression
We also investigated the involvement of Sp-3 in EP4 suppression by TGZ, because Sp-3 is known to bind to GC rich sites and inhibit Sp-1 induced transcription. Sp-3 protein expression was not changed by TGZ treatment (data not shown). Additionally, the ChIP assay revealed that Sp-3 did not bind to the TGZ response element (Fig. 7D) and that transfection of Sp-3 siRNA had no affect on EP4 suppression (data not shown). These data indicate that Sp-3 is not involved in TGZ-induced EP4 suppression.
Erks activation plays a role in the suppression of EP4 and the Erk kinase inhibitor prevents TGZ-induced suppression of EP4 expression. Sp-1 protein is phosphorylated by several kinases including Erk. Five phosphorylation sites (Ser59, Ser131, Thr453, Thr579 and Thr739) have been identified in Sp-1 [23, 30, 37] and threonine phosphorylation at Thr453 and Thr739 occurs in response to Erks activation [30]. Phosphorylation of Sp-1 decreases DNA binding activity and transcription activation of target genes. In this study, we detected phosphorylated threonine residues in Sp-1 activated by TGZ-induced Erks (Fig. 9C). In addition, EP4 suppression by TGZ was partially restored by the transient transfection of mThr453/mThr739 Sp-1 expression plasmid (Fig. 9E). The ChIP assay experiment revealed that TGZ decreases DNA binding activity of responsible Sp-1 binding sites in human EP4 promoter (Fig. 7C). Fischer et al. reported that inhibition of the Ras-MEK-Erk cascade by galectin-1 increased Sp-1 transactivation and DNA binding due to reduced threonine phosphorylation of Sp-1 [38]. Taken together, these data suggest that phosphorylation of Sp-1 is critical and results in the decrease in Sp-1 DNA binding, and hence suppression of transcription activation of target genes like EP4 is observed.
Sp-1 is a member of a family of zinc finger transcription factors and binds to the GC-rich sequences and can overlap with Egr-1 sites. Sp-1 plays important roles in a wide range of cellular processes including cell cycle regulation, hormonal activation, apoptosis, and angiogenesis [39]. Egr-1, a transcription factor, is also involved in cell growth and differentiation. Egr-1 has been proposed as a tumor suppressor and regulates the expression of the NAG-1/MIC/GDF15 protein, which is reported to suppress intestinal tumor formation [40]. In our previous publication, we observed that TGZ induced Egr-1 via Erks activation [20]. We confirmed the induction of Egr-1 by TGZ in T98G cells, but Egr-1 overexpression did not cause a further reduction of pEP4-3 luciferase activities (data not shown), even though Egr-1 might overlap with Sp-1 binding sites. Drugs like TGZ appear to increase the expression of Sp-1 and Egr-1 and alter the phosphorylation of these proteins via Erk kinases [19, 41]. As a consequence of these actions, NAG-1 is initially induced and is followed by a suppression of EP4 expression. Both of these events act to modulate tumor progression. Thus the inhibition of tumor growth by TGZ is very complex and involves a number of signal transduction pathways. Stimulation of Sp-1 phoshorylation and the subsequent suppression of EP4 expression is a novel mechanism to explain the anti-tumorigenic property of TGZ and may provide a new rationale for the development of drugs for the prevention or treatment of cancer. Because the side effects of specific COX-2 inhibitors appear to preclude their use as cancer prevention drugs, a new approach is to target down stream of COX-2. Suppression of EP4 expression is a likely candidate based on our findings.
Acknowledgements
We thank Drs. Karen Adelman, Robert Langenbach, and Paul Wade of the National Institute of Environmental Health Sciences for their helpful comments and suggestions. This investigation was supported in part by the Intramural Research Program, NIH, NIEHS.
Footnotes
Publisher's Disclaimer: This is a PDF file of an unedited manuscript that has been accepted for publication. As a service to our customers we are providing this early version of the manuscript. The manuscript will undergo copyediting, typesetting, and review of the resulting proof before it is published in its final citable form. Please note that during the production process errors may be discovered which could affect the content, and all legal disclaimers that apply to the journal pertain.
References
- 1.Henson JW. Treatment of glioblastoma multiforme: a new standard. Arch. Neurol. 2006;63:337–341. doi: 10.1001/archneur.63.3.337. [DOI] [PubMed] [Google Scholar]
- 2.Sheehan KM, Sheahan K, O’Donoghue DP, MacSweeney F, Conroy RM, Fitzgerald DJ, Murray FE. The relationship between cyclooxygenase-2 expression and colorectal cancer. JAMA. 1999;282:1254–1257. doi: 10.1001/jama.282.13.1254. [DOI] [PubMed] [Google Scholar]
- 3.Ristimäki A, Sivula A, Lundin J, Lundin M, Salminen T, Haglund C, Joensuu H, Isola F. Prognostic significance of elevated cyclooxygenase-2 expression in breast cancer. Cancer Res. 2002;62:632–635. [PubMed] [Google Scholar]
- 4.Erkinheimo TL, Lassus H, Finne P, van Rees BP, Leminen A, Ylikorkala O, Haglund C, Butzow R, Ristimäki A. Elevated cyclooxygenase-2 expression is associated with altered expression of p53 and SMAD4, amplification of HER-2/neu, and poor outcome in serous ovarian carcinoma. Clin. Cancer Res. 2004;10:538–545. doi: 10.1158/1078-0432.ccr-0132-03. [DOI] [PubMed] [Google Scholar]
- 5.Tucker ON, Dannenberg AJ, Yang EK, Zhang F, Teng L, Daly JM, Soslow RA, Masferrer JL, Woerner BM, Koki AT, Fahey TJ., 3rd Cyclooxygenase-2 expression is up-regulated in human pancreatic cancer. Cancer Res. 1999;59:987–990. [PubMed] [Google Scholar]
- 6.Fujino H, West KA, Regan JW. Phosphorylation of glycogen synthase kinase-3 and stimulation of T-cell factor signaling following activation of EP2 and EP4 prostanoid receptors by prostaglandin E2. J. Biol. Chem. 2002;277:2614–2619. doi: 10.1074/jbc.M109440200. [DOI] [PubMed] [Google Scholar]
- 7.Sonoshita M, Takaku K, Sasaki N, Sugimoto Y, Ushikubi F, Narumiya S, Oshima M, Taketo MM. Acceleration of intestinal polyposis through prostaglandin receptor EP2 in Apc(Delta 716) knockout mice. Nat. Med. 2001;7:1048–1051. doi: 10.1038/nm0901-1048. [DOI] [PubMed] [Google Scholar]
- 8.Chang SH, Ai Y, Breyer RM, Lane TF, Hla T. The prostaglandin E2 receptor EP2 is required for cyclooxygenase 2-mediated mammary hyperplasia. Cancer Res. 2005;65:4496–4499. doi: 10.1158/0008-5472.CAN-05-0129. [DOI] [PubMed] [Google Scholar]
- 9.Chang SH, Liu CH, Conway R, Han DK, Nithipatikom K, Trifan OC, Lane TF, Hla T. Role of prostaglandin E2-dependent angiogenic switch in cyclooxygenase 2-induced breast cancer progression. Proc. Natl. Acad. Sci. USA. 2004;101:591–596. doi: 10.1073/pnas.2535911100. [DOI] [PMC free article] [PubMed] [Google Scholar]
- 10.Fiebich BL, Schleicher S, Spleiss O, Czygan M, Hull M. Mechanisms of prostaglandin E2-induced interleukin-6 release in astrocytes: possible involvement of EP4-like receptors, p38 mitogen-activated protein kinase and protein kinase C. J. Neurochem. 2001;79:950–958. doi: 10.1046/j.1471-4159.2001.00652.x. [DOI] [PubMed] [Google Scholar]
- 11.Raza SM, Fuller GN, Rhee CH, Huang S, Hess K, Zhang W, Sawaya R. Identification of Necrosis-Associated Genes in Glioblastoma by cDNA Microarray Analysis. Clin. Cancer Res. 2004;10:212–221. doi: 10.1158/1078-0432.ccr-0155-3. [DOI] [PubMed] [Google Scholar]
- 12.Shono T, Tofilon PJ, Bruner JM, Owolabi O, Lang FF. Cyclooxygenase-2 expression in human gliomas: prognostic significance and molecular correlations. Cancer Res. 2001;61:4375–4381. [PubMed] [Google Scholar]
- 13.Han S, Roman J. Suppression of prostaglandin E2 receptor subtype EP2 by PPARgamma ligands inhibits human lung carcinoma cell growth. Biochem. Biophys. Res. Commun. 2004;314:1093–1099. doi: 10.1016/j.bbrc.2004.01.007. [DOI] [PubMed] [Google Scholar]
- 14.Han S, Ritzenthaler JD, Wingerd B, Roman J. Activation of peroxisome proliferator-activated receptor beta/delta (PPARbeta/delta) increases the expression of prostaglandin E2 receptor subtype EP4. The roles of phosphatidylinositol 3-kinase and CCAAT/enhancer-binding protein beta. J. Biol. Chem. 2005;280:33240–33249. doi: 10.1074/jbc.M507617200. [DOI] [PubMed] [Google Scholar]
- 15.Bottone FG, Jr, Martinez JM, Alston-Mills B, Eling TE. Gene modulation by Cox-1 and Cox-2 specific inhibitors in human colorectal carcinoma cancer cells. Carcinogenesis. 2004;25:349–357. doi: 10.1093/carcin/bgh016. [DOI] [PubMed] [Google Scholar]
- 16.Baek SJ, Eling TE. Changes in gene expression contributes to cancer prevention by COX inhibitors. Prog. Lipid Res. 2006;45:1–16. doi: 10.1016/j.plipres.2005.10.001. [DOI] [PubMed] [Google Scholar]
- 17.Lee SH, Yamaguchi K, Kim JS, Eling TE, Safe S, Park Y, Baek SJ. Conjugated linoleic acid stimulates an anti-tumorigenic protein NAG-1 in an isomer specific manner. Carcinogenesis. 2006;27:972–981. doi: 10.1093/carcin/bgi268. [DOI] [PubMed] [Google Scholar]
- 18.Kim JS, Baek SJ, Sali T, Eling TE. The conventional nonsteroidal anti-inflammatory drug sulindac sulfide arrests ovarian cancer cell growth via the expression of NAG-1/MIC-1/GDF-15. Mol. Cancer Ther. 2005;4:487–493. doi: 10.1158/1535-7163.MCT-04-0201. [DOI] [PubMed] [Google Scholar]
- 19.Baek SJ, Kim JS, Moore SM, Lee SH, Martinez JM, Eling TE. Cyclooxygenase inhibitors induce the expression of the tumor suppressor gene EGR-1, which results in the up-regulation of NAG-1, an antitumorigenic protein. Mol. Pharmacol. 2005;67:356–364. doi: 10.1124/mol.104.005108. [DOI] [PubMed] [Google Scholar]
- 20.Baek SJ, Kim JS, Nixon JB, DiAugustine RP, Eling TE. Expression of NAG-1, a transforming growth factor-beta superfamily member, by troglitazone requires the early growth response gene EGR-1. J. Biol. Chem. 2004;279:6883–6892. doi: 10.1074/jbc.M305295200. [DOI] [PubMed] [Google Scholar]
- 21.Foord SM, Marks B, Stolz M, Bufflier E, Fraser NJ, Lee MG. The structure of the prostaglandin EP4 receptor gene and related pseudogenes. Genomics. 1996;35:182–188. doi: 10.1006/geno.1996.0337. [DOI] [PubMed] [Google Scholar]
- 22.Baek SJ, Horowitz JM, Eling TE. Molecular cloning and characterization of human nonsteroidal anti-inflammatory drug-activated gene promoter. Basal transcription is mediated by Sp1 and Sp3. J. Biol. Chem. 2001;276:33384–33392. doi: 10.1074/jbc.M101814200. [DOI] [PubMed] [Google Scholar]
- 23.Bonello MR, Khachigian LM. Fibroblast growth factor-2 represses platelet-derived growth factor receptor-alpha (PDGFR-alpha) transcription via ERK1/2-dependent Sp1 phosphorylation and an atypical cis-acting element in the proximal PDGFR-alpha promoter. J. Biol. Chem. 2004;279:2377–2382. doi: 10.1074/jbc.M308254200. [DOI] [PubMed] [Google Scholar]
- 24.Taniura S, Kamitani H, Watanabe T, Eling TE. Transcriptional regulation of Cycloocygenase-1 by histone deacetylase inhibitors in normal astrocyte cells. J. Biol. Chem. 2002;277:16823–16830. doi: 10.1074/jbc.M200527200. [DOI] [PubMed] [Google Scholar]
- 25.Fujino H, Xu W, Regan JW. Prostaglandin E2 induced functional expression of early growth response factor-1 by EP4, but not EP2, prostanoid receptors via the phosphatidylinositol 3-kinase and extracellular signal-regulated kinases. J. Biol. Chem. 2003;278:12151–12156. doi: 10.1074/jbc.M212665200. [DOI] [PubMed] [Google Scholar]
- 26.Amin R, Kamitani H, Sultana H, Taniura S, Islam A, Sho A, Ishibashi M, Eling TE, Watanabe T. Aspirin and indomethacin exhibit antiproliferative effects and induce apoptosis in T98G human glioblastoma cells. Neurol Res. 2003;25:370–376. doi: 10.1179/016164103101201706. [DOI] [PubMed] [Google Scholar]
- 27.Motomura W, Tanno S, Takahashi N, Nagamine M, Fukuda M, Kohgo Y, Okumura T. Involvement of MEK-ERK signaling pathway in the inhibition of cell growth by troglitazone in human pancreatic cancer cells. Biochem. Biophys. Res. Commun. 2005;332:89–94. doi: 10.1016/j.bbrc.2005.04.095. [DOI] [PubMed] [Google Scholar]
- 28.Yin F, Bruemmer D, Blaschke F, Hsueh WA, Law RE, Herle AJ. Signaling pathways involved in induction of GADD45 gene expression and apoptosis by troglitazone in human MCF-7 breast carcinoma cells. Oncogene. 2004;23:4614–4623. doi: 10.1038/sj.onc.1207598. [DOI] [PubMed] [Google Scholar]
- 29.Baek SJ, Wilson LC, Hsi LC, Eling TE. Troglitazone, a peroxisome proliferator-activated receptor gamma (PPAR gamma) ligand, selectively induces the early growth response-1 gene independently of PPAR gamma. A novel mechanism for its anti-tumorigenic activity. J. Biol. Chem. 2003;278:5845–5853. doi: 10.1074/jbc.M208394200. [DOI] [PubMed] [Google Scholar]
- 30.Milanini-Mongiat J, Pouyssegur J, Pages G. Identification of two Sp1 phosphorylation sites for p42/p44 mitogen-activated protein kinases: their implication in vascular endothelial growth factor gene transcription. J. Biol. Chem. 2002;277:20631–20639. doi: 10.1074/jbc.M201753200. [DOI] [PubMed] [Google Scholar]
- 31.Mutoh M, Watanabe K, Kitamura T, Shoji Y, Takahashi M, Kawamori T, Tani K, Kobayashi M, Maruyama T, Kobayashi K, Ohuchida S, Sugimoto Y, Narumiya S, Sugimura T, Wakabayashi K. Involvement of prostaglandin E receptor subtype EP(4) in colon carcinogenesis. Cancer Res. 2002;62:28–32. [PubMed] [Google Scholar]
- 32.Chell SD, Witherden IR, Dobson RR, Moorghen M, Herman AA, Qualtrough D, Williams AC, Paraskeva C. Increased EP4 receptor expression in colorectal cancer progression promotes cell growth and anchorage independence. Cancer Res. 2006;66:3106–3113. doi: 10.1158/0008-5472.CAN-05-3702. [DOI] [PubMed] [Google Scholar]
- 33.Castellone MD, Teramoto H, Williams BO, Druey KM, Gutkind JS. Prostaglandin E2 promotes colon cancer cell growth through a Gs-axin-beta-catenin signaling axis. Science. 2005;310:1504–1510. doi: 10.1126/science.1116221. [DOI] [PubMed] [Google Scholar]
- 34.Wang D, Buchanan FG, Wang H, Dey SK, DuBois RN. Prostaglandin E2 enhances intestinal adenoma growth via activation of the Ras-mitogen-activated protein kinase cascade. Cancer Res. 2005;65:1822–1829. doi: 10.1158/0008-5472.CAN-04-3671. [DOI] [PubMed] [Google Scholar]
- 35.Chien EK, MacGregor C. Expression and regulation of the rat prostaglandin E2 receptor type 4 (EP4) in pregnant cervical tissue. Am. J. Obstet. Gynecol. 2003;189:1501–1510. doi: 10.1067/s0002-9378(03)00764-6. [DOI] [PubMed] [Google Scholar]
- 36.Sugawara A, Uruno A, Kudo M, Ikeda Y, Sato K, Taniyama Y, Ito S, Takeuchi K. Transcription suppression of thromboxane receptor gene by peroxisome proliferator-activated receptor-gamma via an interaction with Sp1 in vascular smooth muscle cells. J. Biol. Chem. 2002;277:9676–9683. doi: 10.1074/jbc.M104560200. [DOI] [PubMed] [Google Scholar]
- 37.Chu S, Ferro TJ. Sp1: regulation of gene expression by phosphorylation. Gene. 2005;348:1–11. doi: 10.1016/j.gene.2005.01.013. [DOI] [PubMed] [Google Scholar]
- 38.Fischer C, Sanchez-Ruderisch H, Welzel M, Wiedenmann B, Sakai T, André S, Gabius HJ, Khachigian L, Detjen KM, Rosewicz S. Galectin-1 interacts with the {alpha}5{beta}1 fibronectin receptor to restrict carcinoma cell growth via induction of p21 and p27. J. Biol. Chem. 2005;280:37266–37277. doi: 10.1074/jbc.M411580200. [DOI] [PubMed] [Google Scholar]
- 39.Karlseder J, Rotheneder H, Wintersberger E. Interaction of Sp1 with the growth- and cell cycle-regulated transcription factor E2F. Mol. Cell Biol. 1996;16:1659–1667. doi: 10.1128/mcb.16.4.1659. [DOI] [PMC free article] [PubMed] [Google Scholar]
- 40.Baek SJ, Okazaki R, Lee SH, Martinez J, Kim JS, Yamaguchi K, Mishina Y, Martin DW, Shoieb A, McEntee MF, Eling TE. Nonsteroidal anti-inflammatory drug activated gene-1 overexpression in transgenic mice suppresses intestinal neoplasia. Gastroenterology. 2006;131:1553–1560. doi: 10.1053/j.gastro.2006.09.015. [DOI] [PubMed] [Google Scholar]
- 41.Bae MA, Song BJ. Critical role of c-Jun N-terminal protein kinase activation in troglitazone-induced apoptosis of human HepG2 hepatoma cells. Mol. Pharmacol. 2003;63:401–408. doi: 10.1124/mol.63.2.401. [DOI] [PubMed] [Google Scholar]


