Abstract
This study assessed the tissue distribution of anidulafungin in rats. Anidulafungin rapidly distributed into tissues, achieving peak concentrations within 30 min, and maintained levels above MICs for common pathogens over 72 h. In tissues susceptible to fungal infection (liver, lung, spleen, kidney), exposure was 9- to 12-fold higher than in plasma.
Anidulafungin, a new echinocandin, has broad-spectrum antifungal activity in vitro (E. M. Johnson, B. P. Goldstein, K. G. Davey, and M. A. Fraser. Presented at the 14th European Congress of Clinical Microbiology and Infectious Diseases, Prague, Czech Republic, 2004; 11, 20). It has also demonstrated clinical efficacy (7, 12, 17) and is approved for treatment of esophageal candidiasis, candidemia, and other forms of Candida infections in the United States and Europe. It has been suggested that echinocandin concentrations in infected tissues are an important determinant for pharmacodynamic activity (8). Therefore, we assessed the tissue distribution and pharmacokinetics of anidulafungin in rats in two separate studies. Plasma and tissue levels of anidulafungin in clinically relevant tissues were evaluated by high-performance liquid chromatography (HPLC) with UV detection in study 1 and by quantitative whole-body autoradiography in study 2.
Study 1.
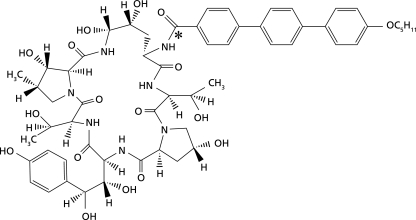
Male F344 rats (n = 30) aged 10 to 11 weeks and weighing 223.6 to 243.8 g received a single intravenous dose of [14C]anidulafungin, 5 mg/kg of body weight, over approximately 5 min. The structure of anidulafungin and the position of the radiolabel are indicated in Fig. 1. Blood, cerebrospinal fluid (CSF), and tissue (kidney, liver, lung, muscle [quadriceps], spleen, and skin) samples were collected predose and at 0.083, 0.5, 1, 2, 4, 8, 24, 48, and 72 h postdose (n = 3 rats per time point). Concentrations of the parent drug (i.e., anidulafungin) in these samples were determined by HPLC; the lower and upper limits of quantitation were 20 and 5,120 ng/ml for plasma and 220 and 56,320 ng/g for tissue, respectively. In addition, total radioactivity (representing the parent drug as well as metabolites) was assayed using liquid scintillation counting. Pharmacokinetic parameters (peak concentration [Cmax], time to achieve peak concentration [tmax], area under the curve from 0 to infinity [AUC0-∞], AUC from 0 to 24 h [AUC0-24], terminal half-life [t1/2], volume of distribution [V], and total body clearance [CLT]) were determined by noncompartmental methods. Since three rats per time point were sampled, the pharmacokinetic parameters were derived based on a composite mean concentration-time profile.
FIG. 1.
Molecular structure of [14C]anidulafungin, in which the position of the 14C radiolabel is indicated by an asterisk.
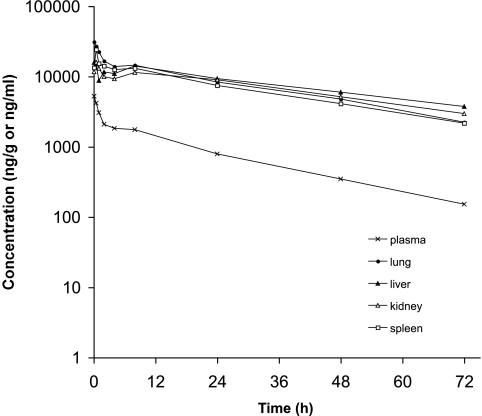
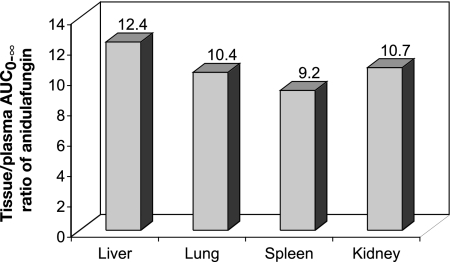
After [14C]anidulafungin was administered intravenously, the Cmax value of anidulafungin in plasma was observed at 5 min postdose (Table 1). Subsequently, anidulafungin levels in plasma exhibited an initial rapid decline, followed by a slower decline (Fig. 2). In the plasma, the AUC0-24 accounted for more than 90% of the AUC0-∞, and anidulafungin had a t1/2 value of 18.5 h (Table 1). In tissues, on the other hand, after an initial decrease in concentration of the parent drug, a slight flattening of the concentration-time curve was observed in some tissues at approximately 8 h postdose; a similar flattening was not detected in the plasma (Fig. 2). Peak concentrations of anidulafungin in lung and liver were obtained at 5 min postdose and in other tissues at 30 min postdose (Table 1). Notably, peak tissue concentrations, except those in skin and muscle, were severalfold higher than in plasma. Among the tissues examined, liver, lung, kidney, and spleen had high exposures to anidulafungin. Based on the ratio of AUC0-∞ values for the parent drug, levels of anidulafungin were about 9- to 12-fold higher in the liver, lung, kidney, and spleen than in the plasma (Fig. 3 and Table 1). The tissue/plasma ratios of anidulafungin AUC in skin and muscle, on the other hand, were less than unity (Table 1). Elimination of the parent drug from tissues appeared to be slower than from plasma, based on t1/2 values (Table 1).
TABLE 1.
Study 1: pharmacokinetic parameters of anidulafungina
| Tissue | Cmax (μg/g or μg/ml) | tmax (h) | AUC0-24 (μg·h/g or μg·h/ml) | AUC0-∞ (μg·h/g or μg·h/ml) | t1/2 (h) |
|---|---|---|---|---|---|
| Plasma | 5.25 | 0.083 | 57.73 | 61.64 | 18.5 |
| Liver | 15.86 | 0.083 | 586.44 | 767.22 | 33.9 |
| Lung | 31.11 | 0.083 | 557.77 | 638.21 | 24.4 |
| Kidney | 16.09 | 0.5 | 517.32 | 658.93 | 32.3 |
| Spleen | 24.20 | 0.5 | 490.36 | 567.95 | 25.2 |
| Skin | 4.02 | 0.5 | 102.72 | 124.11 | 28.2 |
| Muscle (quadriceps) | 3.84 | 0.5 | 54.33 | 57.35 | 17.1 |
Parameters of anidulafungin were determined following a single intravenous bolus dose of 5 mg/kg of [14C]anidulafungin in male F344 rats. Parameters were derived based on a composite, mean concentration-time profile with n = 3 rats per sampling time.
FIG. 2.
Study 1. Mean (n = 3) concentration-versus-time profile for anidulafungin (parent drug) in plasma (ng/ml) and in key tissues (ng/g) following a single intravenous bolus dose of 5 mg/kg [14C]anidulafungin in male F344 rats.
FIG. 3.
Study 1. Tissue/plasma ratio of AUC0-∞ of anidulafungin (parent drug) following a single intravenous bolus dose of 5 mg/kg [14C]anidulafungin in male F344 rats.
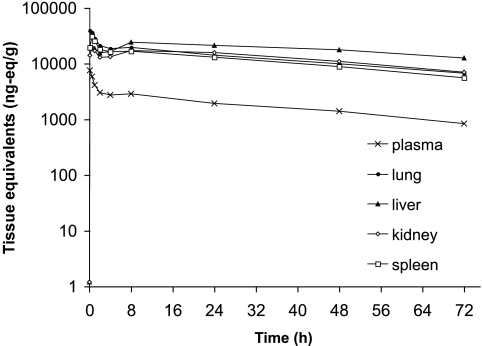
The concentration-time profiles for drug-derived radioactivity in plasma and tissues were similar to that of anidulafungin. However, drug-derived radioactivity levels were approximately two to threefold higher than the parent drug in both the plasma and the tissues (Fig. 4). Initially, most of the radioactivity was associated with anidulafungin, but beyond 24 h, less than 50% of the total radioactivity was associated with unchanged drug. Peak levels of drug-derived radioactivity in plasma and lung were achieved at 5 min and in kidney and spleen at 30 min (Table 2). A secondary peak for total radioactivity was seen in the kidney and to a lesser extent in the lung and the spleen. Drug-derived radioactivity appeared to be eliminated from plasma and tissues at rates that were slower than that of the parent drug, based on t1/2 values (Table 2). This was also supported by comparing the CLT of drug-derived radioactivity with that of the parent drug (0.5 versus 1.4 ml/min/kg, respectively). The V value for anidulafungin was considerably greater than that for radioactivity (2.2 versus 0.2 liter/kg, respectively). CSF had minimal (0.5%) radioactivity relative to that of whole blood (Table 2).
FIG. 4.
Study 1. Mean (n = 3) concentration-versus-time profile of drug-derived radioactivity (ng eq/g) in plasma and key tissues following a single intravenous bolus dose of 5 mg/kg [14C]anidulafungin in male F344 rats.
TABLE 2.
Study 1: pharmacokinetic parameters of total drug-derived radioactivitya
| Tissue | Cmax (μg eq/g) | tmax (h) | AUC0-24 (μg eq·h/g) | AUC0-∞ (μg eq·h/g) | t1/2 (h) |
|---|---|---|---|---|---|
| Plasma | 7.57 | 0.083 | 131.77 | 177.87 | 37.4 |
| Liver | 24.28 | 8.0 | 1,346.94 | 2,656.38 | 69.2 |
| Lung | 39.29 | 0.083 | 934.92 | 1,341.95 | 42.2 |
| Kidney | 19.63 | 0.5 | 920.18 | 1,437.94 | 48.5 |
| Spleen | 30.92 | 0.5 | 822.61 | 1,152.68 | 40.3 |
| Skin | 5.40 | 1.0 | 190.73 | 326.92 | 56.6 |
| Muscle (quadriceps) | 4.16 | 0.5 | 102.96 | 139.22 | 37.5 |
| Blood | 14.78 | 0.083 | 203.14 | 243.62 | 28.5 |
| Cerebrospinal fluid | 0.07 | 0.083 | 0.61 | 0.95 | 53.8 |
Parameters of total drug-derived radioactivity were determined following a single intravenous bolus dose of 5 mg/kg of [14C]anidulafungin in male F344 rats. Parameters were derived based on a composite, mean concentration-time profile with n = 3 rats per sampling time.
The secondary peak observed with some tissues, predominantly for drug-derived radioactivity and to a lesser extent for the parent drug, may represent variability in the data, since different animals were sampled at each time point. Furthermore, it is also possible that formation of biotransformation products and their distribution into tissues may have caused this effect, which is conceivable for drug-derived radioactivity profiles. At least in the liver, the detection of a secondary peak is consistent with the biliary route of elimination previously reported for both unchanged anidulafungin and its biotransformation products (2; M. Stogniew, F. Pu, T. Henkel, and J. Dowell. Presented at the 13th European Congress of Clinical Microbiology and Infectious Diseases, Glasgow, United Kingdom, 2003).
Study 2.
Male pigmented Long Evans (HsdBlu:LE) rats (n = 6) aged 7.5 weeks and weighing 202 to 217 g received a single intravenous dose of [14C]anidulafungin (5 mg/kg). Animals were euthanized by using isoflurane and exsanguination via cardiac puncture at 0.5, 6, 12, 24, 72, and 168 h postdose (n = 1 rat per time point). Sagittal whole-body sections (including kidney, liver, lung, spleen, and other organs) were collected using the method described by Ullberg (16), and autoradiographic images were quantified using phosphorimaging technology as described by Johnston et al. (6). Single samples, corrected for section thickness, were taken in multiple sections for each tissue. Standard curves associated with individual scans were fitted with a least-squares-regression line from which tissue concentrations of radiocarbon were interpolated.
Table 3 provides the concentrations of drug-derived radioactivity observed using quantitative whole-body autoradiography of selected tissues (focusing on key organs associated with systemic fungal infection). Radioactivity was rapidly distributed to tissues, appearing mostly by 30 min, when it reached peak concentrations in approximately half of the organs analyzed (Table 3). High and low levels were obtained from kidney and liver due to differential disposition of radioactivity. At 6 h, approximately half of the analyzed tissues showed peak radioactivity levels, including lungs, kidney, and spleen. Among other organs, high concentrations of radiocarbon were found in lungs, spleen, kidney (high differential), and liver at these time points. At 12 h, radioactivity in most tissues began to decline and had decreased to moderate or low levels at 72 h, except in liver (high differential), where levels remained elevated. Radioactivity was also detected in cerebrospinal fluid, as well as in brain (cerebrum, cerebellum, and medulla), and ocular tissue.
TABLE 3.
Study 2: concentrations of drug-derived radioactivitya
| Tissue | Concn of drug-derived radioactivity (μg eq/g) at the indicated postdose sampling time (h)
|
|||||
|---|---|---|---|---|---|---|
| 0.5 | 6 | 12 | 24 | 72 | 168 | |
| Liver (high) | 11.79 | 29.10 | 25.01 | 29.63 | 16.9 | 4.27 |
| Liver (low) | NA | 17.68 | 15.03 | 14.70 | 7.22 | 1.83 |
| Lung | 22.31 | 22.88 | 5.64 | 8.05 | 4.24 | 0.96 |
| Kidney (high) | 18.09 | 20.66 | 14.10 | 12.57 | 7.32 | 2.57 |
| Kidney (low) | 9.18 | 8.45 | 7.54 | 4.41 | 1.97 | 0.70 |
| Spleen | 20.67 | 22.15 | 11.48 | 10.25 | 4.37 | 1.53 |
| Skin | 5.42 | 5.39 | 5.34 | 3.50 | 4.04 | 2.48 |
| Muscle (quadriceps) | 3.45 | 2.53 | 1.39 | 1.17 | 0.43 | ND |
| Blood | 6.85 | 5.07 | 2.55 | 2.27 | 0.85 | ND |
| Cerebrospinal fluid | 5.51 | 5.54 | 3.82 | 8.92 | 3.37 | 2.18 |
| Brain (cerebrum) | ND | ND | ND | 0.26 | 0.47 | 0.60 |
| Eye | 1.17 | 1.74 | 1.36 | 2.07 | 0.72 | 0.60 |
Concentrations of drug-derived radioactivity (μg eq/g) were determined in selected tissues following a single intravenous bolus dose of 5 mg/kg of [14C]anidulafungin administered to male Long Evans rats (n = 1 animal per sampling time). ND, not detectable (lower limits of detection: mean, 0.3383 ± 0.13 μg eq/g; range, 0.1159 to 0.5680 μg eq/g); NA, not applicable.
Clinical relevance.
Overall, the results of our studies indicate an extensive and rapid distribution of anidulafungin into those organs most commonly affected by invasive mycoses, i.e., lung, liver, kidney, and spleen. Exposure to the parent drug was approximately 9- to 12-fold higher in these key organs than in plasma. Furthermore, anidulafungin seems to persist longer in these tissues than in plasma, an observation recently reported by others as well (5).
MIC90s for anidulafungin range between 0.06 and 4.00 μg/ml for Candida sp. (9, 18) and between 0.03 and 0.08 μg/ml for Aspergillus fumigatus and A. flavus (3, 11). In our study, anidulafungin concentrations in lung, liver, kidney, and spleen after a single 5-mg/kg dose remained above MIC90s for all strains of Candida and Aspergillus sp. for 48 h. At 72 h postdose, anidulafungin levels were still above the MIC90s for Aspergillus, as well as for the majority of Candida strains. Gumbo et al. reported a marked reduction in kidney fungal burden in a neutropenic mouse model with disseminated candidiasis at 24 h after treatment with a single anidulafungin dose of 5 mg/kg or higher, while sustained activity over a time period of 96 h was seen following a single dose of 8 mg/kg or higher (5). As anidulafungin in clinical practice is administered once daily over a period of consecutive days, rather than as a single dose, the 24-h reduction in fungal burden is a particularly important observation. Taken together, these data indicate that the anidulafungin levels achieved in key tissues in our study in rats may be adequate for antifungal activity. It should be noted, however, that the respective proportion of anidulafungin available for microbiological activity in each tissue is not known.
Biotransformation of anidulafungin involves nonenzymatic opening of the cyclopeptide ring structure and, presumably, further breakdown of the ring-opened product into smaller fragments (M. Stogniew et al.). Therefore, considering the position of the 14C radiolabel on the anidulafungin molecule (Fig. 1), it is possible that metabolites which retain the radiolabel contributed to some fraction of the drug-derived radioactivity. Hence, it is important to assess the echinocandin tissue/plasma ratio based on parent drug levels rather than on total drug-derived radioactivity, particularly since the major metabolites of echinocandins do not possess antifungal activity (1, 19). Notably, data from study 1 indicate that exposure to the parent drug (i.e., anidulafungin) in key tissues such as liver, lung, kidney, and spleen was about 9- to 12-fold higher relative to plasma. Similar pharmacokinetic studies carried out with rats for other echinocandins (caspofungin and micafungin) have yielded somewhat lower tissue/plasma ratios than those found here for anidulafungin. Based on the caspofungin concentration values reported by Stone et al., AUC values were calculated by noncompartmental analyses (14). The tissue/plasma ratios for caspofungin based on these derived AUC values were 10.2, 5.5, and 1.2 in the liver, kidney, and lung, respectively. The AUCs in this study were based on drug-derived radioactivity associated with tritiated caspofungin and are therefore likely to be confounded by the presence of metabolites that carry the radiolabel; the proportion of total radioactivity actually associated with unchanged, active caspofungin may be as low as 49% (13). In contrast, a study of micafungin tissue distribution in rats assessed parent drug levels following administration of 1 mg/kg of nonradiolabeled micafungin (10). The tissue/plasma ratios based on the AUC of micafungin were 3.6, 3.2, and 7.8 in the lung, kidney, and liver, respectively. It therefore appears that the tissue/plasma ratios and, thus, the overall tissue penetration for caspofungin and micafungin are considerably less than that observed with anidulafungin in our investigation. This observation is consistent with anidulafungin having the highest volume of distribution among the echinocandins (15). Nevertheless, in a murine model of fungal infection, both caspofungin (8) and micafungin (4) demonstrated reduction in fungal tissue burden. In addition, none of the above studies evaluating echinocandin tissue levels, including our own, assessed the proportion of drug available for antifungal activity, and each study differed in terms of design and assay methodology. Therefore, the clinical relevance of the differences in tissue levels among the three echinocandins, including the comparatively greater tissue penetration of anidulafungin, remains unclear at the present time.
In conclusion, the results presented here indicate that anidulafungin is rapidly distributed to clinically relevant tissues in rats at concentrations significantly higher than those in plasma.
Acknowledgments
This study was sponsored by Vicuron Pharmaceuticals, a subsidiary of Pfizer Inc. Editorial support was provided by D. Wolf, PAREXEL, and was funded by Pfizer Inc.
Footnotes
Published ahead of print on 28 April 2008.
REFERENCES
- 1.Dodds Ashley, E. S., R. Lewis, J. S. Lewis, C. Martin, and D. Andes. 2006. Pharmacology of systemic antifungal agents. Clin. Infect. Dis. 43:S28-S39. [Google Scholar]
- 2.Dowell, J. A., F. Pu, J. Lee, M. Stogniew, D. Krause, and T. Henkel. 2003. A clinical mass balance study of anidulafungin showing complete fecal elimination. Abstr. 43rd Intersci. Conf. Antimicrob. Agents Chemother., abstr. A-1576.
- 3.Espinel-Ingroff, A. 1998. Comparison of in vitro activities of the new triazole SCH56592 and the echinocandins MK-0991 (L-743,872) and LY303366 against opportunistic filamentous and dimorphic fungi and yeasts. J. Clin. Microbiol. 36:2950-2956. [DOI] [PMC free article] [PubMed] [Google Scholar]
- 4.Gumbo, T., G. L. Drusano, W. Liu, R. W. Kulawy, C. Fregeau, V. Hsu, and A. Louie. 2007. Once-weekly micafungin therapy is as effective as daily therapy for disseminated candidiasis in mice with persistent neutropenia. Antimicrob. Agents Chemother. 51:968-974. [DOI] [PMC free article] [PubMed] [Google Scholar]
- 5.Gumbo, T., G. L. Drusano, W. Liu, L. Ma, M. R. Deziel, M. F. Drusano, and A. Louie. 2006. Anidulafungin pharmacokinetics and microbial response in neutropenic mice with disseminated candidiasis. Antimicrob. Agents Chemother. 50:3695-3700. [DOI] [PMC free article] [PubMed] [Google Scholar]
- 6.Johnston, R. F., S. C. Pickett, and D. L. Barker. 1990. Autoradiography using storage phosphor technology. Electrophoresis 11:355-360. [DOI] [PubMed] [Google Scholar]
- 7.Krause, D. S., A. E. Simjee, C. van Rensburg, J. Viljoen, T. J. Walsh, B. P. Goldstein, M. Wible, and T. Henkel. 2004. A randomized, double blind trial of anidulafungin versus fluconazole for the treatment of esophageal candidiasis. Clin. Infect. Dis. 39:770-775. [DOI] [PubMed] [Google Scholar]
- 8.Louie, A., M. Deziel, W. Liu, M. F. Drusano, T. Gumbo, and G. L. Drusano. 2005. Pharmacodynamics of caspofungin in a murine model of systemic candidiasis: importance of persistence of caspofungin in tissues to understanding drug activity. Antimicrob. Agents Chemother. 49:5058-5068. [DOI] [PMC free article] [PubMed] [Google Scholar]
- 9.Moore, C. B., and D. W. Denning. 2002. Tolerance and fungicidality in vitro of caspofungin, micafungin and anidulafungin against Candida guilliermondii. Abstr. 42nd Intersci. Conf. Antimicrob. Agents Chemother., abstr. M-230.
- 10.Niwa, T., Y. Yokota, A. Tokunaga, A. Y. Yamato, A. Kagayama, T. Fujiwara, J. Hatakeyama, M. Anezaki, Y. Ohtsuka, and A. Takagi. 2004. Tissue distribution after intravenous dosing of micafungin, an antifungal drug, to rats. Biol. Pharm. Bull. 27:1154-1156. [DOI] [PubMed] [Google Scholar]
- 11.Pfaller, M. A., F. Marco, S. A. Messer, and R. N. Jones. 1998. In vitro activity of two echinocandin derivatives, LY303366 and MK-0991 (L-743,792), against clinical isolates of Aspergillus, Fusarium, Rhizopus, and other filamentous fungi. Diagn. Microbiol. Infect. Dis. 30:251-255. [DOI] [PubMed] [Google Scholar]
- 12.Reboli, A., C. Rotstein, P. G. Pappas, S. W. Chapman, D. H. Kett, D. Kumar, R. Betts, M. Wible, B. P. Goldstein, J. Schranz, D. S. Krause, T. Walsh, and the Anidulafungin Study Group. 2007. Anidulafungin versus fluconazole for invasive candidiasis. N. Engl. J. Med. 356:2472-2482. [DOI] [PubMed] [Google Scholar]
- 13.Sandhu, P., X. Xu, P. J. Bondiskey, S. K. Balani, M. L. Morris, Y. S. Tang, A. R. Miller, and P. G. Pearson. 2004. Disposition of caspofungin, a novel antifungal agent, in mice, rats, rabbits, and monkeys. Antimicrob. Agents Chemother. 48:1272-1280. [DOI] [PMC free article] [PubMed] [Google Scholar]
- 14.Stone, J. A., X. Xu, G. A. Winchell, P. J. Deutsch, P. G. Pearson, E. M. Migoya, G. C. Mistry, L. Xi, A. Miller, P. Sandhu, R. Singh, F. deLuna, S. C. Dilzer, and K. C. Lasseter. 2004. Disposition of caspofungin: role of distribution in determining pharmacokinetics in plasma. Antimicrob. Agents Chemother. 48:815-823. [DOI] [PMC free article] [PubMed] [Google Scholar]
- 15.Theuretzbacher, U. 2004. Pharmacokinetics/pharmacodynamics of echinocandins. Eur. J. Clin. Microbiol. Infect. Dis. 23:805-812. [DOI] [PubMed] [Google Scholar]
- 16.Ullberg, S. 1977. The technique of whole body autoradiography: cryosectioning of large specimens. Science Tools LKB Instrument J. 2-29.
- 17.Vazquez, J. A., J. A. Schranz, D. Krause, B. P. Goldstein, A. Reboli, J. Hernandez, and C. Fichtenbaum. 2004. Efficacy from a phase 2/3 study of anidulafungin (ANID) in patients (pts) with azole-refractory mucosal candidiasis (ARMC). Abstr. 44th Intersci. Conf. Antimicrob. Agents Chemother., abstr. P-1038.
- 18.Vazquez, J. A., and J. D. Sobel. 2006. Anidulafungin: a novel echinocandin. Clin. Infect. Dis. 43:215-222. [DOI] [PubMed] [Google Scholar]
- 19.Wagner, C., W. Graninger, E. Presterl, and C. Joukhadar. 2006. The echinocandins: comparison of their pharmacokinetics, pharmacodynamics and clinical applications. Pharmacology 78:161-177. [DOI] [PubMed] [Google Scholar]
- 20.Zhanel, G. G., J. A. Karlowsky, G. A. J. Harding, T. V. Balko, S. A. Zelenitsky, M. Friesen, A. Kabani, M. Turik, and D. J. Hoban. 1997. In vitro activity of a new semisynthetic echinocandin, LY-303366, against systemic isolates of Candida species, Cryptococcus neoformans, Blastomyces dermatitidis, and Aspergillus species. Antimicrob. Agents Chemother. 41:863-865. [DOI] [PMC free article] [PubMed] [Google Scholar]


