Abstract
We hypothesized that the apolipoprotein mimetic peptide L-4F, which induces arterial anti-oxidative enzymes and is vasoprotective in a rat model of diabetes, would ameliorate insulin resistance and diabetes in obese mice. L-4F (2 mg/kg/d) administered to ob/ob mice for 6 weeks limited weight gain without altering food intake, decreased visceral (P < 0.02) and subcutaneous (P < 0.045) fat content, decreased plasma IL-1β and IL-6 levels (P < 0.05) and increased insulin sensitivity, resulting in decreased glucose (P < 0.001) and insulin (P < 0.036) levels. In addition, L-4F treatment increased aortic and bone marrow heme oxygenase (HO) activity and decreased aortic and bone marrow superoxide production (P < 0.001). L-4F treatment increased serum adiponectin levels (P < 0.037) and decreased adipogenesis in mouse bone marrow (P < 0.039) and in cultures of human bone marrow-derived mesenchymal stem cells (P < 0.022). This was manifested by reduced adiposity, improved insulin sensitivity, improved glucose tolerance, increased plasma adiponectin levels, and reduced IL-1β and IL-6 levels in obese mice. This study highlights the existence of a temporal relationship between HO-1 and adiponectin that is positively affected by L-4F in the ob/ob mouse model of diabetes, resulting in the amelioration of the deleterious effects of diabetes.
Keywords: diabetes, apolipoprotein A-I mimetic peptides, heme oxygenase-1
Oxidative stress has been implicated in the pathogenesis of insulin resistance and type 2 diabetes and its cardiovascular complications (1, 2). Excessive generation of reactive oxygen species (ROS) in diabetes is the underlying mechanism of endothelial injury, resulting in an accelerated rate of apoptosis and endothelial cell sloughing (3, 4). In addition, reduced plasma adiponectin levels have been documented in patients with coronary artery disease and diabetes, presumably as a result of an increase in ROS (5–7). Lin et al. (8, 9) highlighted the importance of ROS production in adipocytes and the associated insulin resistance and changes in serum levels of adiponectin, suggesting that increases in ROS are associated with an inflammatory response in these cells.
Adipose tissue plays an important role in insulin resistance through the production and secretion of a variety of proteins, including tumor necrosis factor-α (TNF-α,) IL-6, leptin, and adiponectin (10–13). Of these proteins, adiponectin, which is exclusively secreted from adipose tissue, has insulin-sensitizing properties that enhance fatty acid oxidation, liver insulin action, and glucose uptake and positively affect serum triglyceride levels (12–15). Adiponectin exists as both low-molecular weight (LMW) oligomers and high-molecular weight (HMW) multimers (15–17). HMW adiponectin is reported to be more active and correlates with glucose and insulin levels when compared with both LMW and total adiponectin (16, 18, 19). Low plasma levels of HMW adiponectin have been consistently associated with obesity, insulin resistance, type 2 diabetes, and coronary artery disease (20, 21). Adiponectin plays a vascular-protective role by preserving endothelial cell function in diabetic patients and in nondiabetic patients with the metabolic syndrome (22–24). In addition to modulating atherogenesis through its insulin-sensitizing actions, it has a direct anti-atherogenic effect on the arterial wall. These effects are manifested through inhibition of TNF-α-mediated adhesion of monocytes and vascular cell adhesion molecules to the endothelium, resulting in the modulation of the endothelial inflammatory response. In addition, an increase in adiponectin improved the beneficial effects of antihypertensive agents in hypertensive patients(25). PPARγ was shown to regulate the increased expression of both adiponectin (26) and heme oxygenase 1(HO-1) in human vascular cells (27).
The development of apolipoprotein A-I (apoA-I) mimetic peptides, such as 4F, has previously been reported in detail (28). These peptides have equal efficacy whether synthesized from d- or l-amino acids (29). We previously reported that rats made diabetic by an injection of streptozotocin had increased aortic oxidative stress and endothelial sloughing that was ameliorated by D-4F (4, 30). D-4F treatment was associated with increased levels of aortic HO-1, decreased superoxide, and increased extracellular superoxide dismutase. In the present study, we used a mouse model of obesity and diabetes (ob/ob) that develops spontaneous obesity because of a lack of functional leptin, a protein that regulates appetite. Lack of leptin leads to excessive eating, obesity (31), and diabetes, presumably due to an increase of inflammatory cytokines involved in insulin resistance (32). In this manuscript, we show, in a type 2 diabetic animal model, that treatment with L-4F results in increased HO-1 protein and adiponectin levels, decreased superoxide generation, and improved insulin sensitivity and glucose tolerance.
MATERIALS AND METHODS
L-4F and all reagents were from sources previously reported (4, 30) and all other reagents were of the highest available purity.
Mice and protocols
Male obese mice (B6v-Lep ob/J) were purchased from Harlan (Chicago, IL) at the age of 7 weeks, allowed to acclimatize for 1 week, and used at the age of 8 weeks. Age- and sex-matched lean mice (B6.V, lean; Harlan) were used as controls. Mice were fed a normal chow diet and had free access to water and food. Body weight of obese and lean mice at the beginning of the treatment was 34 ± 5 g and 26 ± 3 g, respectively.
Beginning at 9 weeks of age, when all obese mice had established diabetes, L-4F [i.e., Ac-D-W-F-K-A-F-Y-D-K-V-A-E-K-F-K-E-A-F-NH2 synthesized from l-amino acids only as previously described (33) was injected at a dose of 200 μg/100 gdaily in 200 μl vehicle; or vehicle (ABCT: ammonium bicarbonate buffer at pH 7.4 containing 0.01% Tween-20) was administered intraperitoneally for 6 weeks. Blood (50–100 μl) was collected from tailveins of anesthetized obese mice following L-4F or vehicle solution.Glucose monitoring was performed using an automated analyzer (Lifescan, Inc.; Milpitas, CA). Levels were 229±21 and 154 ± 9 mg/dl for obese and lean mice, respectively.There were four groups of animals: A) lean, B) lean+L-4F, C) obese, and D) obese + L-4F. In a separate experiment, vehicle-treated and L-4F-treated animals were housed in metabolic cages. Food intake was monitored daily and was not different in mice receiving vehicle or L-4F. Food intake was monitored less frequently thereafter by measuring remaining chow and body weight. The Animal Care and Use Committee of New York Medical College approved all experiments.
Tissue preparation for Western blot of adipocyte stem cells, heart, kidney, and aorta
At the time of euthanization, subcutaneous and visceral fat in the abdomen (the visible mesenteric fat, fat around the liver, fat around the kidney, and fat around the spleen) were dissected free, pooled for each mouse, weighed, and used to isolate adipocyte mesenchymal stem cells (MSCs). Cells were frozen until needed for protein measurements. Aorta and kidney were also harvested, drained of blood, and flash frozen in liquid nitrogen. Specimens were maintained at −80°C until needed. Frozen aorta and kidney segments were pulverized and placed in a homogenization buffer (10 mM phosphate buffer, 250 mM sucrose, 1 mM EDTA, 0.1 mM PMSF, and 0.1% tergitol, pH 7.5). Homogenates were centrifuged at 27,000 g for 10 min at 4°C. The supernatant was isolated, and protein levels were assayed (Bradford method). The supernatant was used for measurement of HO-1 and HO-2 (Stressgen Biotechnologies Corp.; Victoria, BC). Protein levels were visualized by immunoblotting with antibodies against each specific mouse protein. Actin was used to ensure adequate sample loading for all Western blots. Antibodies were prepared in the following dilutions: HO-1 and HO-2, 1:1,000 (Upstate Cell Signaling Solutions; Chicago, IL). Briefly, 20 μg of lysate supernatant was separated by 12% SDS/PAGE and transferred to a nitrocellulose membrane (Amersham Biosciences; Uppsala, Sweden) with a semi-dry transfer apparatus (Bio-Rad; Hercules, CA). The membranes were incubated with 10% milk in 10 mmol/l Tris-HCl (pH 7.4), 150 mmol/l NaCl, and 0.05% Tween-20 (TBST) buffer at 4°C overnight. After they were washed with TBST, the membranes were incubated with either anti-HO-1 or anti-HO-2 for 1 h at room temperature with constant shaking. The filters were washed and subsequently probed with horseradish peroxidase-conjugated donkey anti-rabbit or anti-mouse IgG (Amersham). Chemiluminescence detection was performed with the Amersham ECL detection kit according to the manufacturer's instructions.
Bone marrow and aortic HO activity were assayed as previously described (34) using a technique in which bilirubin, the end product of heme degradation, was extracted with chloroform and its concentration determined spectrophotometrically (Dual UV/VIS Beam Spectrophotometer Lambda 25; Perkin-Elmer, Norwalk, CT) using the difference in absorbance between 464 nm and 530 nm and an extraction coefficient of 40 mM−1 cm−1.
Isolation of adipocyte MSCs from visceral fat of lean, obese, and obese L-4F-treated mice
To isolate mouse adipocyte MSCs, adipose tissues were washed with PBS and digested at 37°C for 30 min with 0.075% type II collagenase (35). Enzyme activity was inhibited with α-MEM containing 10% FBS and 1% antimitotic/antimycotic solution (Invitrogen; Carlsbad, CA), and centrifuged at 1,200 × g for 10 min. The pellet was then resuspended in MEM media as described above.
Morphology and Oil Red O staining of bone marrow
Bone marrow smears made from the fibia were stained with 0.5% Oil Red O in isopropanol (w/v) for 10 min, and lipid droplets were then evaluated using a light microscope digitalized with a charge-coupled device camera and an image analysis system (Imaging and Computers; Milan, Italy). The mean number of lipid droplets was calculated from six different fields.
Human bone marrow-derived MSCs and adipocytes
Frozen bone marrow mononuclear cells were purchased from Allcells (Emeryville, CA). After thawing, mononuclear cells were resuspended in α-MEM (Invitrogen) supplemented with 10% heat-inactivated FBS (Invitrogen), and 1% antibiotic/antimycotic solution (Invitrogen). The cells were plated at a density of 1–5 × 10⁶ cells per 100 cm2 dish. The cultures were maintained at 37°C in a 5% CO2 incubator. The medium was changed after 48 h and every 3–4 days thereafter. When the MSCs were confluent, the cells were recovered by the addition of 0.25% trypsin/EDTA (Life Technologies; Frederick, MD). Passage 2–3 MSCs were plated in a 60 cm2 dish at a density of 1–2 × 10⁴ and cultured in α-MEM with 10% FBS for 7 days. The medium was replaced with adipogenic medium, and the cells were cultured for an additional 21 days. The adipogenic media consisted of complete culture medium supplemented with DMEM-high glucose, 10% (v/v) FBS, 10 μg/ml insulin, 0.5 mM dexamethasone (Sigma-Aldrich; St. Louis, MO), 0.5 mM isobutylmethylxanthine (Sigma-Aldrich), and 0.1 mM indomethacin (Sigma-Aldrich).
Measurement of O2− levels in MSCs isolated from visceral and subcutaneous fat depots
Subcutaneous and visceral fats were pooled for each mouse and used to isolate adipocyte stem cells. Cells were frozen until needed for protein measurements and O2− levels. Employing previously described methods, MSCs from lean, obese vehicle-treated, and L-4F-treated mice were placed in plastic scintillation minivials containing 5 μm lucigenin for the detection of O2− in a final volume of 1 ml of air-equilibrated Krebs solution buffered with 10 mM HEPES-NaOH (pH 7.4). Lucigenin chemiluminescence was measured in a liquid scintillation counter (LS6000IC; Beckman Instruments, San Diego, CA) at ∼37°C; data are reported as counts/min/mg protein after background subtraction.
Detection of MSC cell markers by fluorescence-activated cell sorting analysis in human cells
Human MSCs are defined by an array of positive and negative markers. Human MSCs are normally plastic-adherent under standard culture conditions and express CD105, CD73, and CD90. To be classified as an MSC, the cell must also lack expression of CD45, CD34, CD14 or CD11b, CD79 or CD19, and HLA-DR. In addition, MSCs must be able to differentiate into osteoblasts, adipocytes, and chondroblasts in vitro (36).
Human MSC phenotype was confirmed by flow cytometry (Elite ESP 2358; Beckman-Coulter, Miami, FL) using several markers known to be found on MSCs. The negative markers used were anti-CD34 and anti-CD45 (BD-Pharmingen; Palo Alto, CA), which are known to be expressed on hematopoietic stem cells and common lymphocytes. CD90, CD105, and CD166 were used as positive markers for human MSCs. The data were analyzed using WinMDI 2.8 software.
Adipogenic differentiation of human MSCs and effect of L-4F
Adipogenic differentiation of human MSCs was induced by incubation in an adipogenesis induction medium [DMEM-high glucose (37, 38), supplemented with 10 μg/ml of insulin, 1 μmol/l of dexamethasone, 0.2 mmol/l of indomethacin, 10% FBS, and 1% antibiotic–antimycotic solution]. The medium was changed every 3–4 days (37, 38), in the presence of vehicle alone or vehicle containing L-4F. At 50% confluence, L-4F and vehicle solutions were added and adipogenesis was measured using Oil Red O as described (38). Briefly, cells were fixed in ice-cold 10% formalin in PBS for 10 min, rinsed with distilled water, and stained with Oil Red O solution for 20 min. Cells were placed in absolute propylene glycol for 5 min, rinsed in 85% propylene glycol, followed by distilled water, and air dried. Oil Red O stain was extracted with isopropanol, and optical absorbance was measured at 490–520 nm. For Oil Red O staining, 0.5% Oil Red O solution (Sigma-Aldrich) was used. Briefly, adipocytes were fixed in 1% formaldehyde, washed in Oil Red O for 20 min, rinsed with 85% propylene glycol (Sigma-Aldrich) for 3 min, washed in distilled water, and mounted with aqueous mounting medium (39).
Cytokine measurements
Adiponectin (HMW), IL-6, and IL-1β were determined in mouse serum using an ELISA assay (Pierce Biotechnology, Inc.; Woburn, MA), and insulin was measured using an ELISA kit (Millipore; Billerica, MA).
Glucose and insulin tolerance tests
After a 12 h fast, mice were injected intraperitoneally with glucose (2.0 g/kg body weight). Blood samples were taken at various time points (0–120 min), and blood glucose levels and serum insulin levels were measured. For determination of insulin tolerance, mice were injected intraperitoneally with insulin (2.0 U/kg). Blood samples were taken at various time points (0–90 min), and blood glucose levels were measured.
Statistical analyses
Statistical significance between experimental groups was determined by the Fisher method of analysis of multiple comparisons (P < 0.05). For comparison between treatment groups, the null hypothesis was tested by a single-factor ANOVA for multiple groups or unpaired t-test for two groups. Data are presented as mean ± SEM.
RESULTS
L-4F increases HO-1 expression and HO activity in the aorta
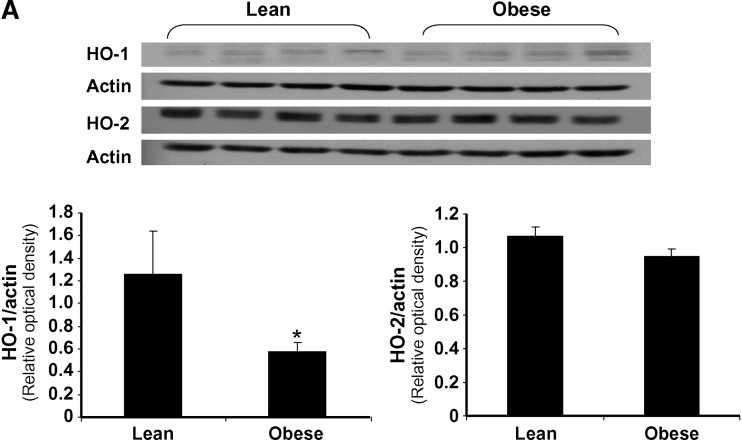
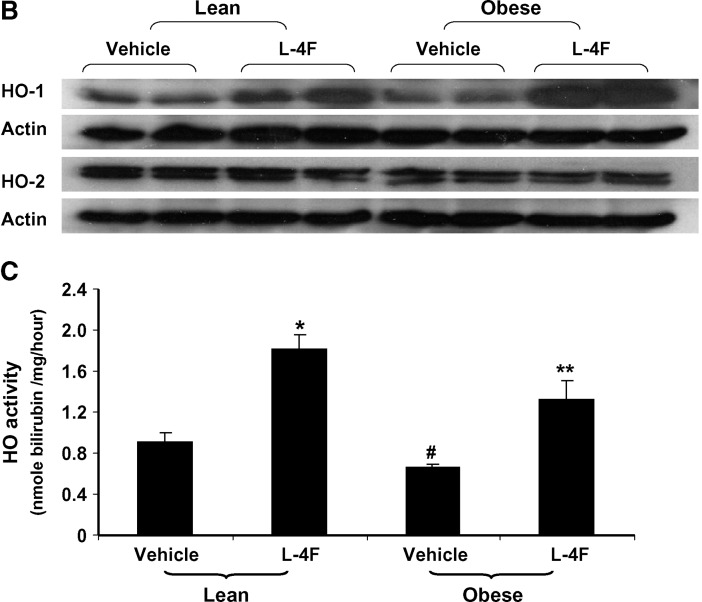
Prior to treatment, the ratio of HO-1 to actin in the aorta of obese mice was significantly less (P < 0.05) when compared with lean mice, using Western blot analysis. The ratio of HO-2 to actin was slightly lower in obese mice compared with lean (0.95 ± 0.05 and 1.10 ± 0.06) (Fig. 1A), but the difference was not significant. In a separate experiment, daily injection of L-4F for 6 weeks resulted in a significant increase in HO-1 expression in both lean and obese mice (Fig. 1B). Densitometry scanning showed that the ratio of HO-1 to actin was significantly increased by L-4F (lean vs. 4F-treated lean mice, P < 0.05; vehicle-treated obese mice vs. L-4F-treated obese mice, P < 0.008; results not shown). HO-2 levels were unaffected by L-4F treatment in both lean and obese animals. There was no difference in HO-1 and HO-2 levels in vehicle-treated and untreated animals. HO activity was measured in aortas isolated from L-4F- and vehicle-treated animals (Fig. 1C). There was a significant (P < 0.05) decrease in HO activity in vehicle-treated obese mice compared with age-matched vehicle-treated lean mice (0.66 ± 0.03 and 0.91 ± 09 nmol bilirubin/mg/h, respectively). L-4F treatment significantly increased HO activity in the aorta of both lean (P < 0.002 vs.vehicle-treated lean) and obese (P < 0.03 vs. vehicle-treated obese) mice (1.82 ± 0.14 and 1.33 ± 0.18 nmol bilirubin/mg/h, respectively). This pattern of HO expression and activity was also observed in kidney and heart isolated from lean and obese mice (data not shown).
Fig. 1.
Effect of L-4F on HO-1 and HO-2 expression in the aorta of lean and obese mice. A: Basal levels of HO-1 and HO-2 in lean and obese mice. Aorta samples were subjected to Western blotting for the determination of HO-1 and HO-2 protein expression. *P < 0.05 lean versus obese. B: Effect of daily administration of L-4F for 6 weeks on HO-1 and HO-2. The gels were scanned and the results expressed as the ratio of HO-1 to actin, n = 6. C:Effect of L-4F and vehicle on HO activity in the aorta of lean and obese mice. HO activity was determined in samples prepared from aorta as described in Materials and Methods. *P < 0.002 vehicle-treated lean versus L-4F-treated lean mice; #P < 0.05 lean vehicle-treated versus obese vehicle-treated mice; **P < 0.03 obese vehicle-treated versus L-4F-treated obese mice.
L-4F treatment increases serum adiponectin levels and decreases IL-1β and IL-6 levels
Because an increase in serum adiponectin has been reported to follow a decrease in oxidative stress (40, 41), we examined the effect of L-4F administration on serum adiponectin. As expected, serum adiponectin levels in vehicle-treated obese mice were significantly lower compared with age-matched vehicle-treated lean mice (Fig. 2A); adiponectin levels in vehicle-treated obese mice were 2.3 ± 0.32 μg/ml compared with 3.9 ± 0.45 μg/ml (P < 0.027) in vehicle-treated lean animals. L-4F administration resulted in a significant increase in adiponectin in the obese mice to 3.70 ± 0.45 μg/ml compared with obese mice treated with vehicle alone (P < 0.04). L-4F administration resulted in a significant increase in adiponectin in lean mice (results not shown).
Fig. 2.
A: Adiponectin levels in lean and obese mice. Vehicle or vehicle containing L-4F was administered daily for 6 weeks (as described in Materials and Methods), and serum samples were obtained immediately prior to euthanization. The results are expressed as μg/ml serum. *P < 0.027 vehicle-treated lean versus vehicle-treated obese mice; #P < 0.04 L-4F-treated obese versus vehicle-treated obese mice. B, C: Serum IL-1β and IL-6 levels in lean and obese mice. Vehicle or vehicle containing L-4F was administered as described in Materials and Methods. Serum samples were obtained immediately prior to euthanization. B:The results for lean vehicle-treated or obese L-4F-treated versus obese vehicle-treated mice for IL-1β; *P < 0.02 vehicle-treated obese versus vehicle-treated lean mice; #P < 0.05 L-4F-treated obese versus vehicle-treated obese mice. C: The results for lean vehicle-treated or obese L-4F-treated versus obese vehicle-treated mice for IL-6; *P < 0.05 vehicle-treated obese versus vehicle-treated lean mice; #P < 0.05 L-4F-treated obese versus vehicle-treated obese mice. Results are shown as the mean ± SEM.
Vehicle-treated obese mice had significantly (P < 0.02) higher serum IL-1β levels (121 ± 22 pg/ml) when compared with age-matched vehicle-treated lean mice (54 ± 9 pg/ml) (Fig. 2B). Administration of L-4F resulted in a significant decrease in serum IL-1β levels to 48 ± 25 pg/ml (P < 0.05) in the obese mice. The changes in serum IL-1β were the reciprocal of those seen with serum adiponectin levels (Fig. 2A). As shown in Fig. 2C, vehicle-treated obese mice had significantly (P < 0.05) higher serum IL-6 levels (402 ± 7 pg/ml) when compared with age-matched vehicle-treated lean mice (138 ± 27 pg/ml). Administration of L-4F resulted in a significant (P < 0.05) decrease in serum IL-6 levels to 214 ± 41 pg/ml in the obese mice. The changes in serum IL-6 levels were, again, the reciprocal of those seen with serum adiponectin levels (Fig. 2A).
Body weight response of obese mice following L-4F treatment
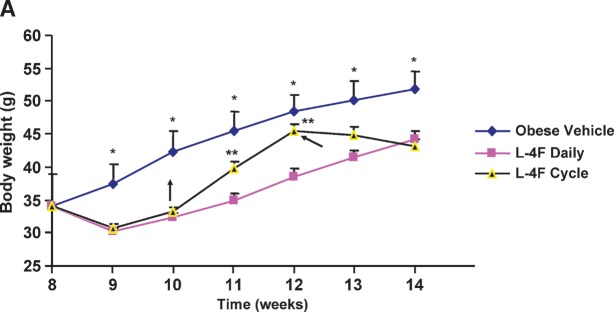
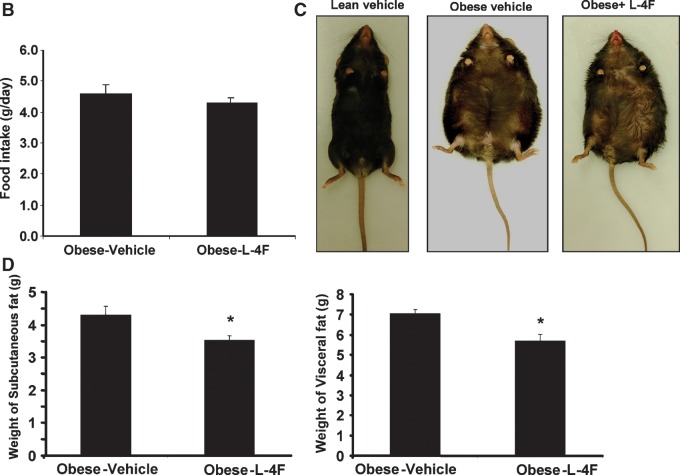
We examined the effect of long-term L-4F treatment on body weight responses (Fig. 3A). Daily treatment with L-4F was well tolerated by obese mice. Food intake was not significantly decreased by L-4F treatment compared with vehicle-treated animals (Fig. 3B). Activity and grooming were maintained during L-4F treatment, and obesity-associated hyperglycemia was decreased (Fig. 3A). L-4F treatment reduced but did not entirely prevent weight gain in obese mice when compared with age-matched vehicle-treated obese mice. (This was noticeable in mice fed fat diets, data not shown). This suggests that L-4F may modulate both adipose and decreased lipid synthesis. The final weight after 6 weeks of vehicle-and L-4F-treated animals was 51 ± 2.7 g and 44.2 ± 1.2 g, respectively. L-4F-mediated prevention of weight gain was reversible when L-4F was withdrawn. As seen in Fig. 3A, when L-4F was discontinued at week 10, obese mice gained weight at a faster rate than obese vehicle animals. Recommencement of L-4F administration at 12 weeks decreased body weight to levels similar to those seen in obese animals continuously treated with L-4F. L-4F-treated lean mice also gained less weight than vehicle-treated lean mice (final weight 30 ± 0.5 and 27.4 ± 0.7 g for vehicle- and L-4F-treated lean mice,respectively). This minimum effect on the lean mice is due to a lower fat content compared with obese mice and increased L-4F efficacy in obese when compared with lean animals.
Fig. 3.
A: Body weight of vehicle-treated or L-4F-treated obese mice. The mice were weighed at the times shown on the X-axis given as the age of the mice in weeks. The data are the weights in grams as mean ± SEM (average of two independent experiments); n = 8 for vehicle-treated and n = 10 for L-4F-treated, L-4F discontinued, L-4F recommended. *P < 0.05 obese vehicle-treated versus obese L-4F-treated mice. **P < 0.05 compared to continuous administration of L-4F. B: Food intake in vehicle-treated or L-4F-treated obese mice during the first 2 weeks of treatment. C: Representative photographs of mice after 6 weeks of treatment. D: Weight of subcutaneous and visceral fat after L-4F treatment; *P < 0.05 versus vehicle-treated obese animals.
As seen in Fig. 3C, D, fat and body appearance of obese mice confirmed the reduction in fat content and body weight loss. Visceral fat in obese mice was decreased by L-4F treatment from 7.07 ± 0.32 g to 5.70 ± 0.64 g (P < 0.02). Subcutaneous fat in obese mice was decreased from 4.30 ± 0.46 g to 3.53 ± 0.30 g (P < 0.04).
L-4F treatment improved glucose tolerance and increased insulin sensitivity
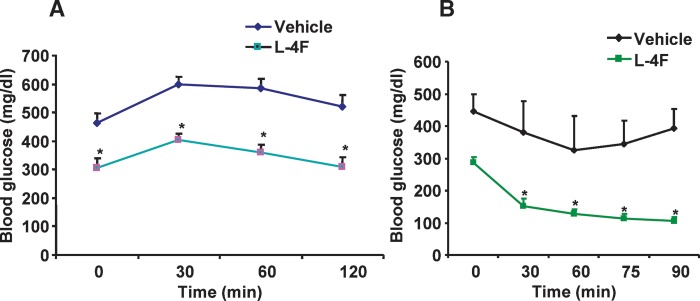
Currently, one of the main treatments for type 2 diabetes consists of insulin-sensitizing therapy resulting in a lowering of blood glucose and insulin levels (42). Plasma glucose levels in obese mice treated with vehicle were significantly higher than those in obese mice treated with L-4F at all time points during the glucose tolerance test. Blood glucose levels in vehicle-treated obese mice were significantly (P < 0.05) elevated 30 min after glucose administration and remained elevated (P < 0.05) at 120 min. In L-4F-treated obese mice, blood glucose levels were significantly (P < 0.001) elevated 30 min after glucose administration but had returned to initial levels at 120 min, (Fig. 4A). Insulin administration to the L-4F-treated obese mice resulted in a rapid decrease in glucose but not in the obese mice receiving vehicle alone, suggesting improved insulin sensitivity in the L-4F-treated obese mice. Glucose levels were significantly (P < 0.001) lower in L-4F-treated obese mice compared with vehicle-treated obese mice at all time points examined (Fig. 4B).
Fig. 4.
A: Glucose tolerance and insulin sensitivity after treatment with vehicle or vehicle containing L-4F. After 6 weeks of treatment with vehicle or vehicle containing L-4F, obese mice were injected intraperitoneally with 2 g/kg of glucose, and plasma glucose levels were determined as described in Materials and Methods for the intraperitoneal glucose tolerance test. *P < 0.05 versus vehicle-treated obese mice. B: After 6 weeks of treatment with vehicle or vehicle containing L-4F, obese mice were injected intraperitoneally with 2.0 U/kg of insulin, and plasma glucose levels were determined as described in Materials and Methods for the intraperitoneal insulin tolerance test. *P < 0.001 versus L-4F-treated obese mice, 0 min. The results are expressed as mean ± SEM; n = 4.
Effect of L-4F treatment on glucose and insulin levels in obese mice
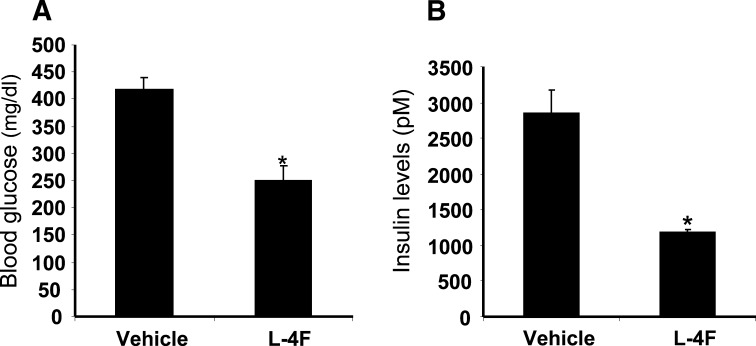
Plasma glucose levels in obese mice treated with vehicle for 6 weeks were 418 ± 21 mg/dl compared with 250 ± 27 mg/dl (P < 0.002) in obese mice treated with L-4F for 6 weeks (Fig. 5A). Consistent with the intraperitoneal insulin tolerance test results, plasma insulin levels in obese mice that received L-4F for 6 weeks were lower than in the vehicle-treated obese mice. Figure 5B shows that obese mice treated with vehicle alone had insulin levels of 2,840 ± 339 pM compared with 1,175 ± 52 pM in obese mice treated with L-4F. Insulin levels in obese mice treated with L-4F were not significantly different from those found in vehicle-treated lean mice (data not shown).
Fig. 5.
Plasma glucose and insulin levels in vehicle-treated obese mice and L-4F-treated obese mice after 6 weeks of treatment. A: Glucose levels in vehicle-treated obese and L-4F-treated obese mice after 6 weeks of treatment; *P < 0.002 vehicle-treated obeseversus L-4F-treated obese mice. B: Insulin levels in vehicle-treated obese mice and L-4F-treated obese mice after 6 weeks of treatment; *P < 0.036 vehicle-treated obese versus L-4F-treated obese mice. Glucose and insulin levels were measured before euthanization as described in Materials and Methods. Data are shown as the mean ± SEM; n = 5 for vehicle-treated and n = 7 for L-4F-treated obese mice.
Effect of L-4F on bone marrow adiposity and HO activity
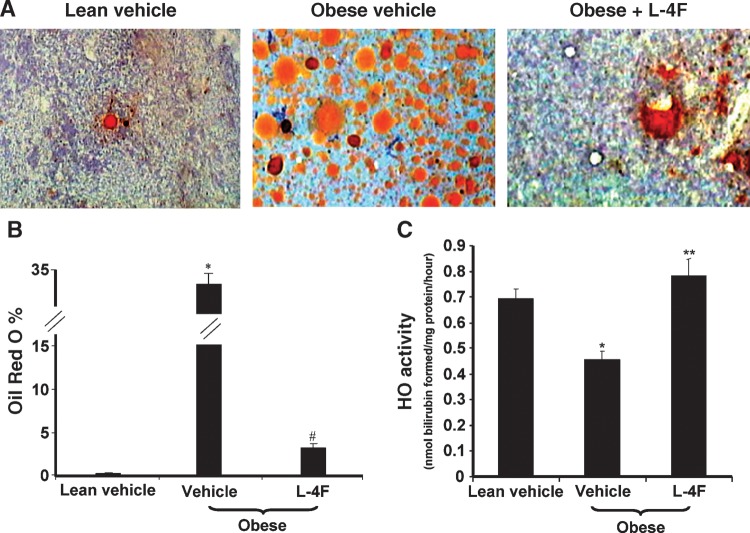
The adiposity of bone marrow as assessed by the presence of lipid droplets was significantly increased in vehicle-treated obese mice compared with vehicle-treated lean mice (Fig. 6A, B). Treatment of the obese mice with L-4F for 6 weeks resulted in a significant reduction in bone marrow lipid droplets (Fig. 6A, B) (P < 0.001). As seen in Fig. 6C, HO activity in the bone marrow from vehicle-treated lean mice was significantly higher compared with vehicle-treated obese mice. The levels of HO activity in vehicle-treated obese and lean mice were 0.46 ± 0.03 and 0.69 ± 0.04 nmol bilirubin/mg/h, respectively (P < 0.014). L-4F treatment significantly (P < 0.02) increased HO activity, 0.78 ± 0.6 nmol bilirubin formed/mg/h, in obese mice when compared with vehicle-treated obese mice (Fig. 6C). A similar pattern of increased HO activity in response to L-4F treatment was observed in lean mice treated with L-4F. HO activity increased from 0.69 ± 0.04 to 0.96 ± 0.08 nmol bilirubin/mg/h on L-4F treatment (P < 0.04 lean ± L-4F vs. lean control).
Fig. 6.
Adiposity and HO-1 activity in bone marrow. A: Representative sections of bone marrow stained to reveal lipid droplets as described in Materials and Methods are shown for vehicle-treated lean mice (left panel), vehicle-treated obese mice (middle panel), and L-4F-treated obese mice (right panel) after 6 weeks of treatment. B: The percentage of bone marrow area with Oil Red O staining was calculated by measuring 10 fields for each sample at a magnification of ×20 as described in Materials and Methods. *P < 0.001 vehicle-treated obese mice versus vehicle-treated lean mice; #P < 0.05 vehicle-treated obese versus L-4F-treated obese mice. C: Bone marrow cells were harvested, and cell lysate was prepared using cell lysis buffer as described in Materials and Methods. HO activity was determined as described in Materials and Methods. *P < 0.014 vehicle-treated obese mice versus vehicle-treated lean mice; **P < 0.014 vehicle-treated obese mice versus L-4F-treated obese mice.
Effect of L-4F on formation of O2− in isolated adipocytes
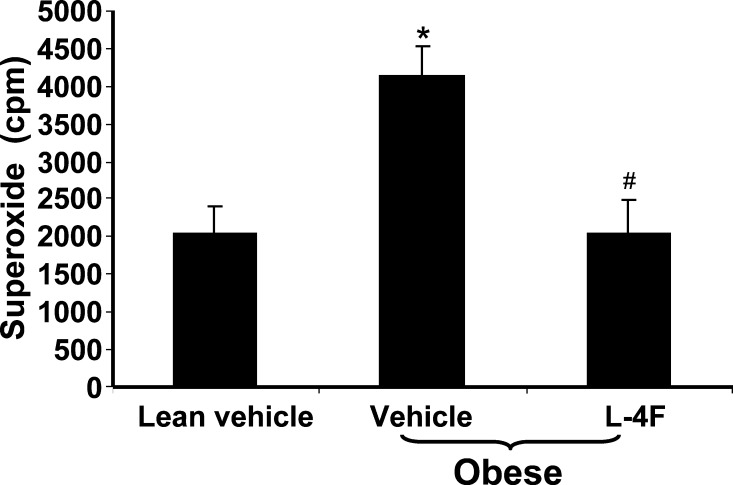
Fat was harvested, adipocytes were isolated, and O2− levels were determined. The levels of O2− in fat obtained from obese mice treated with vehicle alone were 4,144 ± 381 cpm compared with 2,040 ± 351 cpm (P < 0.03) in vehicle-treated lean mice (Fig. 7). Adipocytes from L-4F-treated obese mice showed a significant decrease in O2− levels compared with vehicle-treated obese mice. The levels in the L-4F-treated obese mice decreased to 2,032 ± 453 cpm (P < 0.039).
Fig. 7.
Effect of L-4F on superoxide levels. Visceral fat was harvested and pooled to isolate adipocytes and O2− levels were determined as described in Materials and Methods. The data shown are mean ± SEM; n = 4. *P < 0.03 vehicle-treated lean mice versus vehicle-treated obese mice; #P < 0.039 vehicle-treated obese mice versus L-4F-treated obese mice.
Effect of L-4F in vitro on human bone marrow-derived MSCs
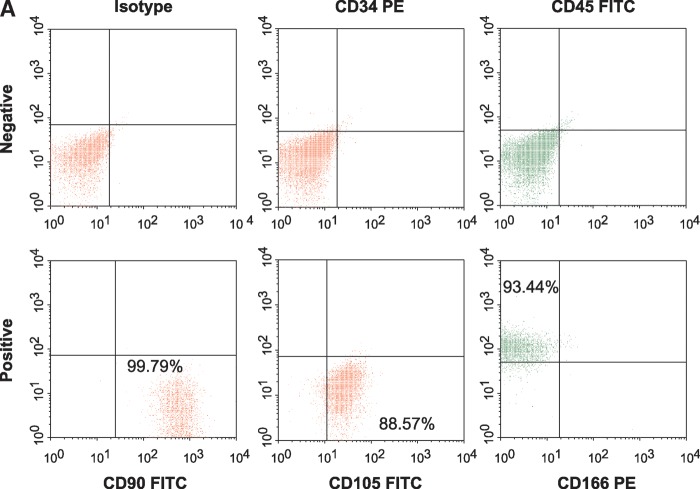
To determine the effect of L-4F on bone marrow adipogenesis in vitro, human MSCs isolated from bone marrow were used. Confirmation of human MSC phenotype was obtained by the presence of positive markers CD90, CD105, and CD166. The absence of CD34, a hematopoietic stem cell marker, and CD45, a lymphocytic marker, confirmed that the human MSCs were not significantly contaminated by hemopoietic cells. The human MSCs were 99.8% positive for CD90, 88.6% positive for CD105, and 93.4% positive for CD166. Less than 0.2% of the cells were positive for CD45 and CD34 (Fig. 8A).
Fig. 8.
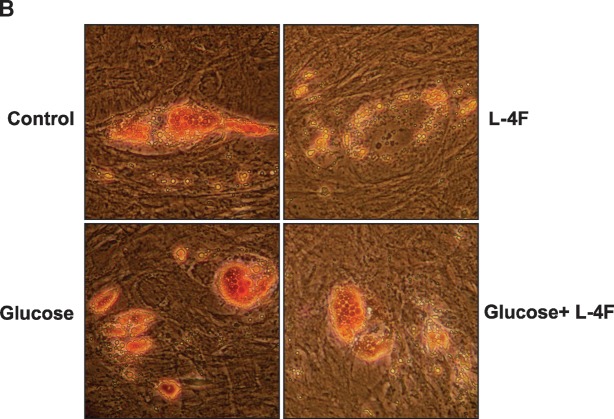
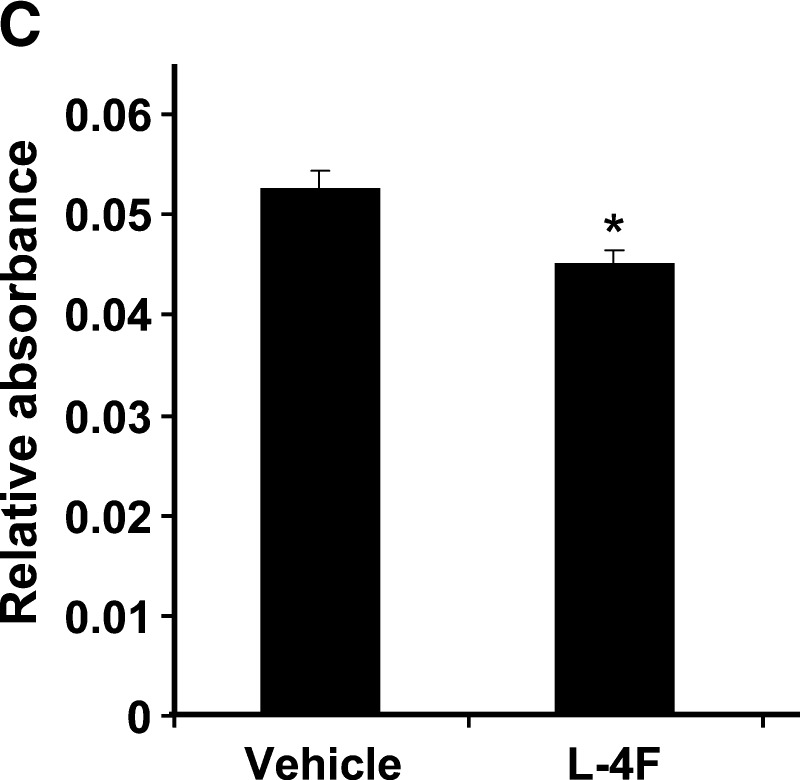
A: Surface expression of CD90, CD105, and CD166 on human MSCs (hMSCs) as determined by fluorescence-activated cell sorting analysis. Percent of cells expressing positive markers CD90 (Thy-1), CD105 (endoglin and SH2), and CD166 (ALCAM, activated leukocyte cell adhesion molecule) were 99.8%, 88.6%, and 93.4%, respectively. CD45 (common lymphocytes antigen) and CD34 (hematopoietic stem cell marker) were used as negative markers. CD45 and CD34 were expressed in less than 0.2% of cells, the same as unstained isotypes. B, C: Effect of L-4F on human MSC-derived adipogenesis. B: Oil Red O staining of hMSC cultures 10 days after induction of conditions favoring adipogenesis. Human MSCs were cultured in the presence and absence of high glucose and in the presence and absence of L-4F (20 μg/ml) and subjected to Oil Red O staining as described in Materials and Methods. C: Oil Red O stain was extracted and quantified by relative absorbance as described in Materials and Methods, confirming that L-4F treatment significantly reduced adipogenesis. The values shown are the mean ± SEM, n = 6; *P < 0.022 vehicle-treated hMSC versus L-4F-treated hMSC.
Oil Red O staining and Image Pro analysis revealed that the human MSCs treated with glucose showed a normal response to glucose with increased adipogenesis (Fig. 8B). L-4F treatment in vitro decreased Oil Red O staining (Fig. 8B). The value for extracted Oil Red O from vehicle-treated cultures expressed as relative absorbance was 0.053 ± 0.002 compared with a value of 0.045 ± 0.001 (P < 0.002) for L-4F-treated cultures (Fig. 8C).
DISCUSSION
HO activity was lower in vehicle-treated obese mice when compared with age-matched vehicle-treated lean controls (Fig. 1B). L-4F treatment increased the levels of HO-1 protein and HO activity to levels significantly greater than those seen in age-matched vehicle-treated lean animals without affecting HO-2 (Fig. 1B). These data in mice confirm our previous data in diabetic rats demonstrating that D-4F increases aorta HO-1 but not HO-2 (4, 30). The levels of HMW adiponectin paralleled those of HO-1 protein, being decreased in vehicle-treated obese mice compared with vehicle-treated lean mice and significantly increased in L-4F-treated obese mice. Because L-4F increased the anti-oxidant enzyme HO-1 (Fig. 1B) and HO activity (Figs. 1B, 6C) and because it is known that adiponectin levels are inversely related to oxidative stress (40, 41), it is tempting to suggest that the L-4F-mediated increase in HO activity mediated the increase in adiponectin levels. The reduced formation of O2− in isolated adipocytes treated with L-4F (Fig. 7) is also consistent with the L-4F induction of adiponectin levels (Fig. 3A) being the result of an L-4F-induced increase in HO activity (Figs. 1B, 6C). The reduction in IL-1β (Fig. 2B) and IL-6 (Fig. 2C) levels in vivo after L-4F treatment could also contribute to a reduction in oxidative stress and thus to the increase in adiponectin levels.
Because insulin acts centrally to decrease body weight, it has been suggested that the obesity state observed in obese mice is, in part, due to insulin resistance (43). The results we present here demonstrate that L-4F treatment improved insulin sensitivity (Fig. 4B) and glucose tolerance (Fig. 4A). This resulted in lower levels of plasma glucose (Fig. 5A) and insulin (Fig. 5B). The increase in adiponectin seen after L-4F treatment may play an important role in modulating glucose tolerance and insulin sensitivity in these mice. The involvement of adiponectin in insulin sensitivity is well documented (15, 40, 44), as well as a role for adiponectin in promoting the storage of triglycerides (13). Adiponectin is expressed exclusively in and secreted from adipocytes (15). Serum adiponectin levels are decreased in type 2 diabetes and obesity (16, 40, 44).
Inducers of HO-1 have previously been reported to cause a robust increase in serum adiponectin levels in diabetic rats (45, 46). Recently, L'Abbate et al. (41) reported that induction of HO-1 decreased superoxide and ROS generation, resulting in an increase in adiponectin and a subsequent elevation in tolerance to ROS in the heart. In the studies reported here, the increase in adiponectin levels as a result of L-4F administration resulted in a concomitant temporal reduction in fat content (Fig. 3C, D) and a significantly smaller increase in body weight (Fig. 3A), despite no change in food intake (Fig. 3B). The mechanism by which L-4F increased adiponectin levels may, as we have implied, be related to decreased superoxide levels and increased HO activity, thus suggesting a temporal relationship between HO-1 and adiponectin. The L-4F-mediated increase in HO activity may lead to an increase in adiponectin levels by protecting against the thiol-mediated retention of the protein, as suggested by Wang et al. (47).
The magnitude of prevention of weight gain varied between mice fed a high-fat diet compared with obese mice. This may reflect differences in bioavailability, tissue and cell specificity, and/or mechanism of action. Whatever the effect, cycling and aged mice studies (Fig. 3) illustrate that adipose tissues are capable of extensive remodeling and remain susceptible to L-4F treatment. We propose that adipose tissue may be maintained in a relatively immature state compared with that of other organs that are weight stable. Mechanisms governing metabolic adaptation to food intake and fat loss during L-4F-induced weight loss are unknown. The loss of visceral and subcutaneous fat as a result of L-4F treatment suggests that L-4F-treated animals preferably used fatty acid as an energy substrate during weight reduction. Weight loss with a normal appetite is a common specific response, suggesting the lack of undesirable side effects (48–51). The effect of L-4F on adipose tissue during cycling, i.e., intermittent treatment, suggests that L-4F may cause adipose tissue remodeling and remain susceptible to L-4F-mediated anti-inflammatory effects. Furthermore, when L-4F was withdrawn, mice regained weight at an accelerated rate, which resembled that seen in humans (51, 52). Weight gain is achieved at a faster rate after caloric modification and restriction.
Various isoforms of adiponectin have been reported, of which the HMW form appears to be the most important (16, 53). It was the HMW form of adiponectin that was found to be increased in the studies reported here (Fig. 2A). Consistent with a decrease in circulating adiponectin levels in vehicle-treated obese mice compared with vehicle-treated lean mice (Fig. 2A), there was evidence of increased bone marrow adiposity in the vehicle-treated obese mice (Fig. 6A, B). Similarly, with the induction of circulating adiponectin levels in obese mice treated with L-4F (Fig. 2A), there was a decrease in bone marrow adiposity (Fig. 6A, B). Induction of HO-1 in bone marrow has been reported to have a beneficial effect on the hematopoietic microenvironment, including MSCs (54, 55).
Additionally, when human bone marrow-derived MSCs were isolated and cultured in vitro under conditions promoting adipogenesis (Fig. 8), treatment with L-4F reduced adipogenesis (Fig. 8B, C).
A spectrum of compounds have been used to upregulate HO-1 expression and HO activity to attenuate cardiovascular inflammation. SnCl2 has been reported to act as an anti-inflammatory agent, decreasing inflammatory mediators in hypertensive animals (56). Several recent studies have revealed that some well-known and commonly used drugs, such as aspirin, have cytoprotective properties via HO-1 induction (57). Similarly, statins, the widely used lipid-lowering agents, substantially decrease cardiovascular morbidity and mortality in patients with and without coronary disease. Both simvastatin and lovastatin increase HO-1 mRNA levels in vitro and in vivo (58–61). Likewise, probucol and one of its derivates, AG1067, now in clinical trials for attenuation of cardiovascular risk factors, are capable of inducing HO-1 (as reviewed in Ref. 62). L-4F is also a potent inducer of HO-1 protein and HO activity, and this may be one of the mechanisms by which many of these anti-inflammatory drugs act (as reviewed in Ref. 46).
There is no single drug currently on the market that addresses all aspects of the metabolic syndrome. This study clearly shows that L-4F increases adiponectin with consequent adiposity reduction, decreases blood glucose, improves insulin sensitivity, and reduces anti-inflammatory markers. In addition to its powerful HO-1 inducibility, L-4F, like other apoA-1 mimetic proteins, may exert its extraordinary ability by binding and removing pro-inflammatory oxidized phospholipids from tissues (63). These oxidized phospholipids are reported to have a role in a number of chronic inflammatory conditions (64). The remarkable action of L-4F in the experiments reported here suggests that these oxidized lipids may play a role in obesity, insulin resistance, and diabetes. In summary, L-4F offers great promise in the management of the metabolic syndrome.
Acknowledgments
The authors thank Ms. Jennifer Brown and Ms. Chiara Kimmel for editorial assistance.
Abbreviations
apoA-I, apolipoprotein A-I
HMW, high molecular weight
HO, heme oxygenase
LMW, low molecular weight
MSC, mesenchymal stem cell
ROS, reactive oxygen species
Published, JLR Papers in Press, April 28, 2008.
Footnotes
This work was supported by National Institutes of Health Grants DK-068134, HL-55601, and HL-34300.
References
- 1.Robertson R. P. 2004. Chronic oxidative stress as a central mechanism for glucose toxicity in pancreatic islet beta cells in diabetes. J. Biol. Chem. 279 42351–42354. [DOI] [PubMed] [Google Scholar]
- 2.Wellen K. E., and G. S. Hotamisligil. 2005. Inflammation, stress, and diabetes. J. Clin. Invest. 115 1111–1119. [DOI] [PMC free article] [PubMed] [Google Scholar]
- 3.Bahia L., L. G. Aguiar, N. Villela, D. Bottino, A. F. Godoy-Matos, B. Geloneze, M. Tambascia, and E. Bouskela. 2006. Relationship between adipokines, inflammation, and vascular reactivity in lean controls and obese subjects with metabolic syndrome. Clinics. 61 433–440. [DOI] [PubMed] [Google Scholar]
- 4.Kruger A. L., S. Peterson, S. Turkseven, P. M. Kaminski, F. F. Zhang, S. Quan, M. S. Wolin, and N. G. Abraham. 2005. D-4F induces heme oxygenase-1 and extracellular superoxide dismutase, decreases endothelial cell sloughing, and improves vascular reactivity in rat model of diabetes. Circulation. 111 3126–3134. [DOI] [PubMed] [Google Scholar]
- 5.Bakkaloglu S. A., O. Soylemezoglu, N. Buyan, S. O. Oktar, T. Funahashi, H. Pasaoglu, A. H. Elhan, H. Peru, and E. Hasanoglu. 2006. Adiponectin levels and arteriosclerotic risk factors in pediatric renal transplant recipients. Pediatr. Transplant. 10 187–192. [DOI] [PubMed] [Google Scholar]
- 6.Haider D. G., K. Schindler, A. Bohdjalian, G. Prager, A. Luger, M. Wolzt, and B. Ludvik. 2007. Plasma adipocyte and epidermal fatty acid binding protein is reduced after weight loss in obesity. Diabetes Obes. Metab. 9 761–763. [DOI] [PubMed] [Google Scholar]
- 7.Ohashi K., S. Kihara, N. Ouchi, M. Kumada, K. Fujita, A. Hiuge, T. Hibuse, M. Ryo, H. Nishizawa, N. Maeda, et al. 2006. Adiponectin replenishment ameliorates obesity-related hypertension. Hypertension. 47 1108–1116. [DOI] [PubMed] [Google Scholar]
- 8.Lin Y., A. H. Berg, P. Iyengar, T. K. Lam, A. Giacca, T. P. Combs, M. W. Rajala, X. Du, B. Rollman, W. Li, et al. 2005. The hyperglycemia-induced inflammatory response in adipocytes: the role of reactive oxygen species. J. Biol. Chem. 280 4617–4626. [DOI] [PubMed] [Google Scholar]
- 9.Lin H. V., J. Y. Kim, A. Pocai, L. Rossetti, L. Shapiro, P. E. Scherer, and D. Accili. 2007. Adiponectin resistance exacerbates insulin resistance in insulin receptor transgenic/knockout mice. Diabetes. 56 1969–1976. [DOI] [PubMed] [Google Scholar]
- 10.Kershaw E. E., and J. S. Flier. 2004. Adipose tissue as an endocrine organ. J. Clin. Endocrinol. Metab. 89 2548–2556. [DOI] [PubMed] [Google Scholar]
- 11.Berg A. H., and P. E. Scherer. 2005. Adipose tissue, inflammation, and cardiovascular disease. Circ. Res. 96 939–949. [DOI] [PubMed] [Google Scholar]
- 12.Fain J. N., A. K. Madan, M. L. Hiler, P. Cheema, and S. W. Bahouth. 2004. Comparison of the release of adipokines by adipose tissue, adipose tissue matrix, and adipocytes from visceral and subcutaneous abdominal adipose tissues of obese humans. Endocrinology. 145 2273–2282. [DOI] [PubMed] [Google Scholar]
- 13.Kim J. Y., E. van de Wall, M. Laplante, A. Azzara, M. E. Trujillo, S. M. Hofmann, T. Schraw, J. L. Durand, H. Li, G. Li, et al. 2007. Obesity-associated improvements in metabolic profile through expansion of adipose tissue. J. Clin. Invest. 117 2621–2637. [DOI] [PMC free article] [PubMed] [Google Scholar]
- 14.Kubota N., Y. Terauchi, T. Kubota, H. Kumagai, S. Itoh, H. Satoh, W. Yano, H. Ogata, K. Tokuyama, I. Takamoto, et al. 2006. Pioglitazone ameliorates insulin resistance and diabetes by both adiponectin-dependent and -independent pathways. J. Biol. Chem. 281 8748–8755. [DOI] [PubMed] [Google Scholar]
- 15.Berg A. H., T. P. Combs, X. Du, M. Brownlee, and P. E. Scherer. 2001. The adipocyte-secreted protein Acrp30 enhances hepatic insulin action. Nat. Med. 7 947–953. [DOI] [PubMed] [Google Scholar]
- 16.Basu R., U. B. Pajvani, R. A. Rizza, and P. E. Scherer. 2007. Selective downregulation of the high molecular weight form of adiponectin in hyperinsulinemia and in type 2 diabetes: differential regulation from nondiabetic subjects. Diabetes. 56 2174–2177. [DOI] [PubMed] [Google Scholar]
- 17.Moon H. S., H. G. Lee, J. H. Seo, C. S. Chung, D. D. Guo, T. G. Kim, Y. J. Choi, and C. S. Cho. 2007. Leptin-induced matrix metalloproteinase-2 secretion is suppressed by trans-10,cis-12 conjugated linoleic acid. Biochem. Biophys. Res. Commun. 356 955–960. [DOI] [PubMed] [Google Scholar]
- 18.Kobayashi H., N. Ouchi, S. Kihara, K. Walsh, M. Kumada, Y. Abe, T. Funahashi, and Y. Matsuzawa. 2004. Selective suppression of endothelial cell apoptosis by the high molecular weight form of adiponectin. Circ. Res. 94 e27–e31. [DOI] [PMC free article] [PubMed] [Google Scholar]
- 19.Lara-Castro C., N. Luo, P. Wallace, R. L. Klein, and W. T. Garvey. 2006. Adiponectin multimeric complexes and the metabolic syndrome trait cluster. Diabetes. 55 249–259. [PubMed] [Google Scholar]
- 20.Arita Y., S. Kihara, N. Ouchi, M. Takahashi, K. Maeda, J. Miyagawa, K. Hotta, I. Shimomura, T. Nakamura, K. Miyaoka, et al. 1999. Paradoxical decrease of an adipose-specific protein, adiponectin, in obesity. Biochem. Biophys. Res. Commun. 257 79–83. [DOI] [PubMed] [Google Scholar]
- 21.Weyer C., T. Funahashi, S. Tanaka, K. Hotta, Y. Matsuzawa, R. E. Pratley, and P. A. Tataranni. 2001. Hypoadiponectinemia in obesity and type 2 diabetes: close association with insulin resistance and hyperinsulinemia. J. Clin. Endocrinol. Metab. 86 1930–1935. [DOI] [PubMed] [Google Scholar]
- 22.Hopkins T. A., N. Ouchi, R. Shibata, and K. Walsh. 2007. Adiponectin actions in the cardiovascular system. Cardiovasc. Res. 74 11–18. [DOI] [PMC free article] [PubMed] [Google Scholar]
- 23.Bahia L., L. G. Aguiar, N. Villela, D. Bottino, A. F. Godoy-Matos, B. Geloneze, M. Tambascia, and E. Bouskela. 2007. Adiponectin is associated with improvement of endothelial function after rosiglitazone treatment in non-diabetic individuals with metabolic syndrome. Atherosclerosis. 195 138–146. [DOI] [PubMed] [Google Scholar]
- 24.Chen H., M. Montagnani, T. Funahashi, I. Shimomura, and M. J. Quon. 2003. Adiponectin stimulates production of nitric oxide in vascular endothelial cells. J. Biol. Chem. 278 45021–45026. [DOI] [PubMed] [Google Scholar]
- 25.Yilmaz M. I., A. Sonmez, K. Caglar, T. Celik, M. Yenicesu, T. Eyileten, C. Acikel, Y. Oguz, I. Yavuz, and A. Vural. 2007. Effect of antihypertensive agents on plasma adiponectin levels in hypertensive patients with metabolic syndrome. Nephrology (Carlton). 12 147–153. [DOI] [PubMed] [Google Scholar]
- 26.Iwaki M., M. Matsuda, N. Maeda, T. Funahashi, Y. Matsuzawa, M. Makishima, and I. Shimomura. 2003. Induction of adiponectin, a fat-derived antidiabetic and antiatherogenic factor, by nuclear receptors. Diabetes. 52 1655–1663. [DOI] [PubMed] [Google Scholar]
- 27.Kronke G., A. Kadl, E. Ikonomu, S. Bluml, A. Furnkranz, I. J. Sarembock, V. N. Bochkov, M. Exner, B. R. Binder, and N. Leitinger. 2007. Expression of heme oxygenase-1 in human vascular cells is regulated by peroxisome proliferator-activated receptors. Arterioscler. Thromb. Vasc. Biol. 27 1276–1282. [DOI] [PubMed] [Google Scholar]
- 28.Navab M., G. M. Anantharamaiah, S. T. Reddy, S. Hama, G. Hough, V. R. Grijalva, N. Yu, B. J. Ansell, G. Datta, D. W. Garber, et al. 2005. Apolipoprotein A-I mimetic peptides. Arterioscler. Thromb. Vasc. Biol. 25 1325–1331. [DOI] [PubMed] [Google Scholar]
- 29.Van Lenten B. J., A. C. Wagner, M. Navab, G. M. Anantharamaiah, S. Hama, S. T. Reddy, and A. M. Fogelman. 2007. Lipoprotein inflammatory properties and serum amyloid A levels but not cholesterol levels predict lesion area in cholesterol-fed rabbits. J. Lipid Res. 48 2344–2353. [DOI] [PubMed] [Google Scholar]
- 30.Peterson S. J., D. Husney, A. L. Kruger, R. Olszanecki, F. Ricci, L. F. Rodella, A. Stacchiotti, R. Rezzani, J. A. McClung, W. S. Aronow, et al. 2007. Long-term treatment with the apolipoprotein A1 mimetic peptide increases antioxidants and vascular repair in type I diabetic rats. J. Pharmacol. Exp. Ther. 322 514–520. [DOI] [PubMed] [Google Scholar]
- 31.Halaas J. L., C. Boozer, J. Blair-West, N. Fidahusein, D. A. Denton, and J. M. Friedman. 1997. Physiological response to long-term peripheral and central leptin infusion in lean and obese mice. Proc. Natl. Acad. Sci. USA. 94 8878–8883. [DOI] [PMC free article] [PubMed] [Google Scholar]
- 32.Li, M., D. H. Kim, P. Tsenovoy, S. J. Peterson, R. Rezzani, L. F. Rodella, W. S. Aronow, S. Ikehara, and N. G. Abraham. 2008. Treatment of obese diabetic mice with an heme oxygenase inducer reduces visceral and abdominal adiposity increases adiponectin levels and improves insulin sensitivity and glucose tolerance. Diabetes. In press. [DOI] [PubMed]
- 33.Navab M., G. M. Anantharamaiah, S. Hama, D. W. Garber, M. Chaddha, G. Hough, R. Lallone, and A. M. Fogelman. 2002. Oral administration of an apo A-I mimetic peptide synthesized from D-amino acids dramatically reduces atherosclerosis in mice independent of plasma cholesterol. Circulation. 105 290–292. [DOI] [PubMed] [Google Scholar]
- 34.Abraham N. G., T. Kushida, J. McClung, M. Weiss, S. Quan, R. Lafaro, Z. Darzynkiewicz, and M. Wolin. 2003. Heme oxygenase-1 attenuates glucose-mediated cell growth arrest and apoptosis in human microvessel endothelial cells. Circ. Res. 93 507–514. [DOI] [PubMed] [Google Scholar]
- 35.Lee R. H., B. Kim, I. Choi, H. Kim, H. S. Choi, K. Suh, Y. C. Bae, and J. S. Jung. 2004. Characterization and expression analysis of mesenchymal stem cells from human bone marrow and adipose tissue. Cell. Physiol. Biochem. 14 311–324. [DOI] [PubMed] [Google Scholar]
- 36.Keating A. 2006. Mesenchymal stromal cells. Curr. Opin. Hematol. 13 419–425. [DOI] [PMC free article] [PubMed] [Google Scholar]
- 37.Novikoff A. B., P. M. Novikoff, O. M. Rosen, and C. S. Rubin. 1980. Organelle relationships in cultured 3T3-L1 preadipocytes. J. Cell Biol. 87 180–196. [DOI] [PMC free article] [PubMed] [Google Scholar]
- 38.Tondreau T., N. Meuleman, A. Delforge, M. Dejeneffe, R. Leroy, M. Massy, C. Mortier, D. Bron, and L. Lagneaux. 2005. Mesenchymal stem cells derived from CD133-positive cells in mobilized peripheral blood and cord blood: proliferation, Oct4 expression, and plasticity. Stem Cells. 23 1105–1112. [DOI] [PubMed] [Google Scholar]
- 39.Bavendiek U., A. Zirlik, S. LaClair, L. MacFarlane, P. Libby, and U. Schonbeck. 2005. Atherogenesis in mice does not require CD40 ligand from bone marrow-derived cells. Arterioscler. Thromb. Vasc. Biol. 25 1244–1249. [DOI] [PubMed] [Google Scholar]
- 40.Minoura H., S. Takeshita, C. Kimura, J. Hirosumi, S. Takakura, I. Kawamura, J. Seki, T. Manda, and S. Mutoh. 2007. Mechanism by which a novel non-thiazolidinedione peroxisome proliferator-activated receptor gamma agonist, FK614, ameliorates insulin resistance in Zucker fatty rats. Diabetes Obes. Metab. 9 369–378. [DOI] [PubMed] [Google Scholar]
- 41.L'Abbate A., D. Neglia, C. Vecoli, M. Novelli, V. Ottaviano, S. Baldi, R. Barsacchi, A. Paolicchi, P. Masiello, G. Drummond, et al. 2007. Beneficial effect of heme oxygenase-1 expression in myocardial ischemia-reperfusion increases adiponectin in mildly diabetic rats. Am. J. Physiol. Heart Circ. Physiol. 293 H3532–H3541. [DOI] [PubMed] [Google Scholar]
- 42.Fonseca V. A. 2007. Rationale for the use of insulin sensitizers to prevent cardiovascular events in type 2 diabetes mellitus. Am. J. Med. 120 (Suppl.) 18–25. [DOI] [PubMed] [Google Scholar]
- 43.Lazar M. A. 2005. How obesity causes diabetes: not a tall tale. Science. 307 373–375. [DOI] [PubMed] [Google Scholar]
- 44.Qi L., A. Doria, J. E. Manson, J. B. Meigs, D. Hunter, C. S. Mantzoros, and F. B. Hu. 2006. Adiponectin genetic variability, plasma adiponectin, and cardiovascular risk in patients with type 2 diabetes. Diabetes. 55 1512–1516. [DOI] [PubMed] [Google Scholar]
- 45.Abraham N., P. Tsenovoy, J. McClung, and G. Drummond. 2008. Heme oxygenase: a target gene for anti-diabetic and obesity. Curr. Pharm. Des. 14 412–421. [DOI] [PubMed] [Google Scholar]
- 46.Abraham N. G., and A. Kappas. 2008. Pharmacological and clinical aspects of heme oxygenase. Pharmacol. Rev. 60 79–127. [DOI] [PubMed] [Google Scholar]
- 47.Wang Z. V., T. D. Schraw, J. Y. Kim, T. Khan, M. W. Rajala, A. Follenzi, and P. E. Scherer. 2007. Secretion of the adipocyte-specific secretory protein adiponectin critically depends on thiol-mediated protein retention. Mol. Cell. Biol. 27 3716–3731. [DOI] [PMC free article] [PubMed] [Google Scholar]
- 48.Grossman B. M., M. L. Devore, E. W. Kelso, and R. J. Martin. 1997. Effect of glucose and 2-deoxyglucose on hypothalamic GABA release in lactating rats. Physiol. Behav. 61 169–173. [DOI] [PubMed] [Google Scholar]
- 49.Scharrer E. 1999. Control of food intake by fatty acid oxidation and ketogenesis. Nutrition. 15 704–714. [DOI] [PubMed] [Google Scholar]
- 50.Rupnick M. A., D. Panigrahy, C. Y. Zhang, S. M. Dallabrida, B. B. Lowell, R. Langer, and M. J. Folkman. 2002. Adipose tissue mass can be regulated through the vasculature. Proc. Natl. Acad. Sci. USA. 99 10730–10735. [DOI] [PMC free article] [PubMed] [Google Scholar]
- 51.Morimura M., O. Ishiko, T. Sumi, H. Yoshida, and S. Ogita. 2001. Angiogenesis in adipose tissues and skeletal muscles with rebound weight-gain after diet-restriction in rabbits. Int. J. Mol. Med. 8 499–503. [DOI] [PubMed] [Google Scholar]
- 52.Hattori K., T. Sumi, T. Yasui, M. Morimura, H. Nobeyama, E. Okamoto, M. Noriyuki, K. Honda, H. Kiyama, and O. Ishiko. 2004. VEGF mRNA in adipocytes increase with rebound weight-gain after diet-restriction. Int. J. Mol. Med. 13 395–399. [PubMed] [Google Scholar]
- 53.Pajvani U. B., M. Hawkins, T. P. Combs, M. W. Rajala, T. Doebber, J. P. Berger, J. A. Wagner, M. Wu, A. Knopps, A. H. Xiang, et al. 2004. Complex distribution, not absolute amount of adiponectin, correlates with thiazolidinedione-mediated improvement in insulin sensitivity. J. Biol. Chem. 279 12152–12162. [DOI] [PubMed] [Google Scholar]
- 54.Abraham N. G. 1991. Molecular regulation—biological role of heme in hematopoiesis. Blood Rev. 5 19–28. [DOI] [PubMed] [Google Scholar]
- 55.Abraham N. G., M. Li, L. Vanella, S. J. Peterson, S. Ikehara, and D. Asprinio. 2008. Bone marrow stem cell transplant into intra-bone cavity prevents type 2 diabetes: role of heme oxygenase-adiponectin. J. Autoimmun. 30 128–135. [DOI] [PubMed] [Google Scholar]
- 56.Sacerdoti D., B. Escalante, N. G. Abraham, J. C. McGiff, R. D. Levere, and M. L. Schwartzman. 1989. Treatment with tin prevents the development of hypertension in spontaneously hypertensive rats. Science. 243 388–390. [DOI] [PubMed] [Google Scholar]
- 57.Grosser N., A. Abate, S. Oberle, H. J. Vreman, P. A. Dennery, J. C. Becker, T. Pohle, D. S. Seidman, and H. Schroder. 2003. Heme oxygenase-1 induction may explain the antioxidant profile of aspirin. Biochem. Biophys. Res. Commun. 308 956–960. [DOI] [PubMed] [Google Scholar]
- 58.Lee T. S., C. C. Chang, Y. Zhu, and J. Y. Shyy. 2004. Simvastatin induces heme oxygenase-1: a novel mechanism of vessel protection. Circulation. 110 1296–1302. [DOI] [PubMed] [Google Scholar]
- 59.Oberle S., A. Abate, N. Grosser, A. Hemmerle, H. J. Vreman, P. A. Dennery, H. T. Schneider, D. Stalleicken, and H. Schroder. 2003. Endothelial protection by pentaerithrityl trinitrate: bilirubin and carbon monoxide as possible mediators. Exp. Biol. Med. (Maywood). 228 529–534. [DOI] [PubMed] [Google Scholar]
- 60.Grosser N., A. Hemmerle, G. Berndt, K. Erdmann, U. Hinkelmann, S. Schurgerc, N. Wijayanti, S. Immenschuh, and H. Schroder. 2004. The antioxidant defense protein heme oxygenase 1 is a novel target for statins in endothelial cells. Free Radic. Biol. Med. 37 2064–2071. [DOI] [PubMed] [Google Scholar]
- 61.Grosser N., K. Erdmann, A. Hemmerle, G. Berndt, U. Hinkelmann, G. Smith, and H. Schroder. 2004. Rosuvastatin upregulates the antioxidant defense protein heme oxygenase-1. Biochem. Biophys. Res. Commun. 325 871–876. [DOI] [PubMed] [Google Scholar]
- 62.Stocker R., and M. A. Perrella. 2006. Heme oxygenase-1: a novel drug target for atherosclerotic diseases? Circulation. 114 2178–2189. [DOI] [PubMed] [Google Scholar]
- 63.Buga G. M., J. S. Frank, G. A. Mottino, A. Hakhamian, A. Narasimha, A. D. Watson, B. Yekta, M. Navab, S. T. Reddy, G. M. Anantharamiah, et al. 2007. D-4F reduces EO6 immunoreactivity, SREBP-1c mRNA levels, and renal inflammation in LDL receptor-null mice fed a Western diet. J. Lipid Res. 49 192–205. [DOI] [PubMed] [Google Scholar]
- 64.Berliner J. A., and A. D. Watson. 2005. A role for oxidized phospholipids in atherosclerosis. N. Engl. J. Med. 353 9–11. [DOI] [PubMed] [Google Scholar]


