Abstract
The Sanfilippo syndrome type B is an autosomal recessive disorder caused by mutation in the gene (NAGLU) encoding α-N-acetylglucosaminidase, a lysosomal enzyme required for the stepwise degradation of heparan sulfate. The most serious manifestations are profound mental retardation, intractable behavior problems, and death in the second decade. To generate a model for studies of pathophysiology and of potential therapy, we disrupted exon 6 of Naglu, the homologous mouse gene. Naglu−/− mice were healthy and fertile while young and could survive for 8–12 mo. They were totally deficient in α-N-acetylglucosaminidase and had massive accumulation of heparan sulfate in liver and kidney as well as secondary changes in activity of several other lysosomal enzymes in liver and brain and elevation of gangliosides GM2 and GM3 in brain. Vacuolation was seen in many cells, including macrophages, epithelial cells, and neurons, and became more prominent with age. Although most vacuoles contained finely granular material characteristic of glycosaminoglycan accumulation, large pleiomorphic inclusions were seen in some neurons and pericytes in the brain. Abnormal hypoactive behavior was manifested by 4.5-mo-old Naglu−/− mice in an open field test; the hyperactivity that is characteristic of affected children was not observed even in younger mice. In a Pavlovian fear conditioning test, the 4.5-mo-old mutant mice showed normal response to context, indicating intact hippocampal-dependent learning, but reduced response to a conditioning tone, perhaps attributable to hearing impairment. The phenotype of the α-N-acetylglucosaminidase-deficient mice is sufficiently similar to that of patients with the Sanfilippo syndrome type B to make these mice a good model for study of pathophysiology and for development of therapy.
The Sanfilippo syndrome type B [mucopolysaccharidosis III B (MPS III B)] is an autosomal recessive disorder caused by lack of activity of α-N-acetylglucosaminidase, one of the enzymes needed to degrade heparan sulfate, and the resulting accumulation of this glycosaminoglycan (GAG) (1). The disease is very heterogeneous at the molecular level. Although the gene encoding α-N-acetylglucosaminidase was cloned only recently (2–4), over 70 mutations and 2 polymorphisms have already been identified (2, 5–8).
The Sanfilippo syndrome type B is closely related to the other three types of Sanfilippo syndrome (A, C, and D), all of which are caused by deficiency of lysosomal enzymes needed for the removal of α-linked glucosamine residues of heparan sulfate. In all four types of the disease, the central nervous system is particularly affected even though the enzyme deficiencies and lysosomal storage are systemic; somatic manifestations such as organomegaly or skeletal malformations are much less prominent than in other MPS (1). Pathological changes in brains of patients with Sanfilippo syndrome have been documented by occasional imaging or autopsy studies that suggest some degree of cerebral atrophy in the late stages of the disease (9, 10). The Sanfilippo syndrome is particularly hard on families, because the progressive mental retardation is often accompanied by intense hyperactivity that is not readily managed with medications (11). The hyperactivity may last for many years; when it finally subsides, the cognitive functions continue to deteriorate until the patient’s death, usually in the late teens. There is clinical variability within and between each of the four subtypes, a consequence of their molecular heterogeneity. Some patients with an attenuated form of Sanfilippo syndrome type B have a milder course without behavioral disturbances, and longer survival with retention of some limited skills (12).
Animal forms of Sanfilippo syndrome, all of spontaneous origin, have been discovered in recent years: a caprine form of Sanfilippo type D (deficiency of N-acetylglucosamine 6-sulfatase) (13), canine (14), and murine (15) forms of Sanfilippo syndrome type A (deficiency of heparan sulfamidase), and a disease of emus biochemically similar to Sanfilippo syndrome type B (16).
We have developed a murine model of the Sanfilippo syndrome type B to accelerate studies of pathogenesis and development of therapy for this devastating disease. A preliminary account of this work has been published in abstract form (17, 18).
Methods
Disruption of the Naglu Gene.
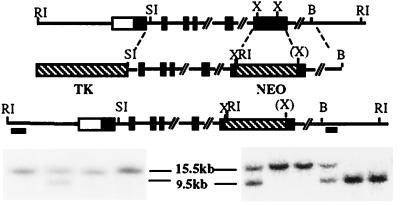
The Naglu gene (GenBank accession no. AF003255) was cloned from a 129/Sv mouse genomic library (Stratagene). Exon 6 was selected for disruption because a number of Sanfilippo B mutations had already been found there (5). After digestion with XhoI restriction endonuclease, the 852-bp fragment within exon 6 was replaced by a cassette containing the neor gene under control of the phosphoglycerate kinase promoter (Stratagene). A cassette containing the Herpes simplex virus thymidine kinase gene under control of its own promoter was cloned into the vector upstream of the Naglu gene (Fig. 1). The final construct contained 5 kb and 3.5 kb of 5′ and 3′ homology, respectively.
Figure 1.
Targeted disruption of the Naglu gene. The structure of the endogenous gene, the targeting construct, and the disrupted allele are presented schematically on successive lines. Southern blot identification of the disrupted gene is shown (Bottom): embryonic stem cell colonies (Left) and F2 mice (Right). These were identified by hybridization of the 5′ probe to EcoRI restriction fragments. The fragment is smaller in the disrupted allele than in the normal one (9.5 kb vs. 15.5 kb) because of the presence of an EcoRI site in the neor gene. Hybridization with the 3′ probe gave a 6-kb fragment for the disrupted allele (not shown). Filled rectangles represent exons, whereas the open rectangle at the 5′ end indicates that the transcription start site has not been defined. The two bars under the disrupted allele represent the 5′ and 3′ probes used for Southern blots. Abbreviations for restriction enzymes are: RI, EcoRI; SI, SacI; X, XhoI; B, BamHI; (X) indicates that the XhoI site was lost during the cloning process.
The vector was linearized with SalI restriction endonuclease before electroporation into CCE embryonic stem (ES) cells, which are derived from mouse strain 129SvEv. The ES cells were grown on irradiated feeder layers of mouse fibroblasts (STO), in DMEM (GIBCO) supplemented with 15% fetal bovine serum (HyClone), nonessential amino acids, β-mercaptoethanol, and murine leukemia inhibitory factor (GIBCO). Drug selection was carried out in 225 μg/ml of geneticin (GIBCO) and 0.2 μM fialuridine (FIAU) (Moravek Biochemicals, Brea, CA). Surviving colonies were subjected to “mini-Southern” analyses (19). A SacI fragment upstream and an EcoRV/BamHI fragment downstream of the targeted region were used to identify the targeted allele (Fig. 1). Further screening was carried out with the 5′ probe only. About 1% of the survivors of the drug selection were found to have a disrupted Naglu gene.
Animal Breeding.
Successfully targeted ES colonies were injected into C57BL/6 blastocysts at the University of California Los Angeles Transgenic Mouse Facility. The one chimeric male with a disrupted gene in the germ line was mated to C57BL/6 females. Heterozygotes were either intercrossed for experimental use or backcrossed to C57BL/6 mice to put the mutation on a congenic background. Genotyping was initially performed by Southern analysis of DNA obtained by tail biopsy at 10 d, and by assay of α-N-acetylglucosaminidase activity in these biopsies after a strict dose response had been established.
Enzyme Assays.
About 30 mg of tissue was homogenized by hand in 1.4 ml of 0.9% NaCl/0.2% Triton X-100, rotated for 2 hr at 4°C, and centrifuged to remove debris. The activity of α-N-acetylglucosaminidase was determined fluorometrically (20). Homogenate (25 μl) was incubated for 1 hr at 37°C with an equal volume of 0.2 mM 4-methylumbelliferyl α-N-acetylglucosaminide (Calbiochem) in 0.1 M Na acetate buffer, pH 4.3, containing 0.5 mg/ml BSA; the fluorescence of 4-methylumbelliferone released was measured after addition of 1.0 ml of glycine buffer, pH 10.5. One unit of activity corresponds to the hydrolysis of 1 nmol substrate per hour. α-l-Iduronidase was assayed as described (21). Neuraminidase was assayed exactly as described for α-N-acetylglucosaminidase, except for substitution of 0.2 mM 4-methylumbelliferyl-α-N-acetylneuraminic acid; this substrate (Calbiochem) was first purified by extraction with t-butyl-methyl ether, HPLC grade (Aldrich). The following enzymes were all assayed by incubating appropriately diluted homogenate with the respective 4-methylumbelliferyl substrates for 1 hr at 37°C under the following conditions: α-glucosidase and β-galactosidase, 25 μl of homogenate with 125 μl 0.25 mM substrate in 0.1 M Na acetate buffer at pH 4.3; β-glucuronidase, 50 μl of homogenate with 50 μl 0.2 mM substrate in 0.1 M Na acetate buffer, pH 4.3; β-hexosaminidase, 25 μl of homogenate with 125 μl 0.24 mM substrate in 10 mM citrate/20 mM phosphate buffer, pH 4.5.
Analysis of GAG.
Soluble GAG was extracted from lyophilized tissues by incubation in 0.9% NaCl/0.2% Triton X-100 (30 μl per mg dry weight) at 4°C overnight with shaking. Debris was removed by centrifugation. GAG was precipitated with Alcian blue (Polysciences), the blue precipitate was dissolved and absorbance measured at 600 nm as described (22). Heparan sulfate from porcine intestinal mucosa (Sigma H9902) was used as standard. For enzymatic identification of GAG, the tissue extracts were first heated at 100°C for 5 min to inactivate endogenous enzymes then incubated with heparan sulfate lyase I, heparan sulfate lyase II, chondroitin lyase ABC, or chondroitin lyase AC (Seikagaku America, Rockville, MD) following instructions of the manufacturer; GAG that remained undigested was precipitated with Alcian blue and measured as above. Mock-treated controls were incubated in buffer without lyase. Electrophoretic separation was carried out on cellulose acetate plates (23, 24). Urine from individual mice was collected in metabolic cages; GAG was precipitated with Alcian blue for quantitative measurement and with cetylpyridinium chloride for electrophoresis.
Analysis of Gangliosides.
Brain hemispheres were collected from 5 mo-old mice, sagittally cut in two, and stored frozen. Ganglioside analysis was performed on the half-hemispheres without further dissection, according to previously described methods (25, 26).
Pathological Studies.
Mice were euthanized by CO2 inhalation, and tissues other than brain were fixed in 4% phosphate buffered formalin and embedded in paraffin for light microscopy. Sections were 4 μm thick. For electron microscopy, liver was fixed in 3% glutaraldehyde in PBS and kidney in 2.5% glutaraldehyde/4% formaldehyde in 0.1 M cacodylate buffer. For examination of brain, mice were anesthetized and perfused from the left ventricle with 4% buffered formalin for light microscopy and with 4% paraformaldehyde/2% glutaraldehyde for electron microscopy.
Behavioral Studies.
Generalized activity was assessed by an open field test, carried out essentially as described for rats (27). Briefly, mice were brought to a rectangular open field (a translucent green polyethylene container, 71 × 36 × 30 cm) in a room lit only by a 25-W red light bulb. A grid of lines divided the open field into eight equal segments. An overhead camera allowed observers to watch the mice on a video screen in an adjacent room. Crossovers (defined as all four paws crossing one of the lines) were scored for 4 min in the dark, after which two 100-W white lights (on opposite ends of the enclosure) were turned on, and scoring was continued for an additional 4 min.
For Pavlovian fear conditioning, mice were placed in stainless steel and Plexiglass conditioning chambers (28 × 21 × 22 cm, Lafayette Instruments, Lafayette, IN) that had floors consisting of 24 stainless steel rods, 1 mm in diameter, spaced 5 mm apart. After 3 min, a tone (10 sec, 85 dB, 2 kHz/A scale) was presented, coterminating with an aversive foot shock (2 sec, 0.5 mA). One minute later, the mice were returned to their home cages. One day after training, the mice were returned to the conditioning chambers for a contextual fear test; freezing, defined by the absence of any visible movement except for breathing, was scored for 4 min according to a blind 8-sec sampling procedure (28). On the next day, they were brought to novel chambers for a tone fear test. These chambers were in a different room and differed from the training chambers in many respects, such as background noise, odor, and lighting (27). After a 2-min baseline period, the training tone was presented continuously for 4 min; freezing was scored during the entire 6-min period.
Results
General Observations.
Naglu−/− mice were normal in appearance and were generally healthy while young. Both males and females were fertile up to 6 mo and survived 8–12 mo. Older mice were euthanized as they became visibly ill, with abdominal distention, weight loss, disheveled fur, skin ulceration around the genitalia, and difficulty in walking. They had a greatly distended urinary bladder. Palpation of younger mice showed that urinary retention in bladder occurred from the age of 6 mo.
Enzyme Activity.
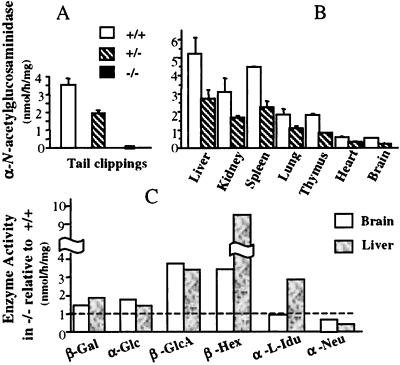
α-N-acetylglucosaminidase activity showed strict dose response with genotype. Homozygous mutant mice had no activity, confirming that the targeted allele was null, whereas heterozygotes had half the normal activity (Fig. 2A). The dose response was seen in all tissues tested, although the absolute level of enzyme varied in different tissues (Fig. 2B). Given the neurological manifestations of the Sanfilippo syndrome, it was somewhat surprising to find that the lowest α-N-acetylglucosaminidase activity was found in brain. To confirm this, the enzyme was also measured in homogenates of different parts of the brain from a 5-mo-old +/+ mouse; the activity in olfactory bulb, hippocampus, cerebral frontal cortex, cerebral caudal cortex, cerebellum, and brainstem did not deviate by more than one-third of the whole brain homogenate (not shown).
Figure 2.
Enzyme activities in mutant and control mice. (A) Activity, mean ± SD, of α-N-acetylglucosaminidase in tail clippings of 10-d-old mice. The mice of the second backcross generation numbered 65 for +/+, 102 for +/−, and 65 for −/−. There was no change in enzyme level in subsequent backcross generations. (B) α-N-acetylglucosaminidase activity in various tissues of 1-mo-old +/+ and +/− mice (two mice each for brain and three for other tissues); the activity in −/− mice is not shown, because it was zero in every case. (C) Ratio of activity of other enzymes in liver and brain of +/+ and −/− mice; one 5-mo-old mutant mouse was used for liver and two for brain, with one control mouse of the same age. Abbreviations for enzymes: β-Gal, β-galactosidase; α-Glu, α-glucosidase; β-GlcA, β-glucuronidase; β-Hex, β-hexosaminidase; α-l-Idu, α-l-iduronidase; α-Neu, α-N-acetylneuraminidase.
Several other lysosomal enzymes—β-galactosidase, α-glucosidase, β-glucuronidase, and β-hexosaminidase—were elevated in both liver and brain of 5-mo-old mice (Fig. 2C). α-l-Iduronidase was elevated in liver but not in brain, and neuraminidase was reduced in both tissues. Elevation of β-glucuronidase and β-hexosaminidase activities in liver of 1-mo-old mice was less pronounced, but the trend was the same (not shown).
Accumulation of Soluble GAG.
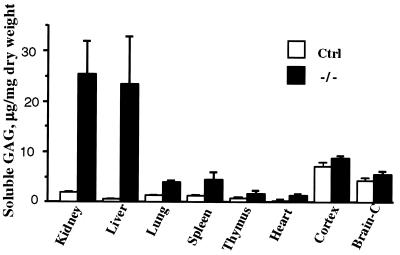
GAG soluble under the same conditions as lysosomal enzymes (i.e., in 0.9% NaCl containing 0.2% Triton X-100) was thought likely to represent undegraded or partially degraded GAG stored in lysosomes. Analysis of this pool in different tissues showed a massive increase in liver and kidney and lesser but statistically significant increases in lung, spleen, thymus, and heart (Fig. 3). In all cases, the control mouse tissues contained little soluble GAG. However, there was considerable soluble GAG in brain of control mice, and only a slight increase was seen in the −/− mice.
Figure 3.
Accumulation of soluble GAG in tissues of mutant and control mice. Soluble Alcian-blue precipitable GAG (mean ±SD) was from tissues of six −/− and eight control mice (6 +/− and 2 +/+). The brain was separated into cortex and remainder (Brain-C).
To identify the soluble GAG, the extracts were treated with bacterial GAG lyases of known specificity after heat inactivation of endogenous GAG hydrolases. As seen in Table 1, treatment of kidney extract with heparan sulfate lyase I removed essentially all the GAG, identifying it as heparan sulfate. Liver extracts were only partially degraded with heparan sulfate lyase I but were sensitive to heparan sulfate lyase II, an enzyme that can cleave the “heparin-like” regions that contain more α-l-iduronic acid. The difference in the material stored in kidney and liver could also be seen in electrophoresis on cellulose acetate; kidney GAG migrated like the heparan sulfate standard, whereas liver GAG migrated between heparan sulfate and heparin (not shown). The GAG in brain of both control and affected mice, on the other hand, was shown by enzymatic digestion to be primarily chondroitin sulfate A or C (Table 1); the small increment seen in Fig. 3 in the affected mouse brains could be identified neither enzymatically nor by electrophoresis.
Table 1.
Enzymatic identification of soluble GAG
| Treatment | GAG Fraction remaining
|
|||
|---|---|---|---|---|
| Kidney | Liver | Brain | ||
| −/− | −/− | −/− | +/− | |
| Mock-treated | 1.0 | 1.0 | 1.0 | 1.0 |
| Heparan sulfate lyase I | 0.2 | 0.4–0.7 | — | — |
| Heparan sulfate lyase II | 0.1 | 0.2 | 0.9–1.0 | 0.9–1.0 |
| Chondroitin ABC lyase | 1.0 | 1.0 | 0.2 | 0.2 |
| Chondroitin AC lyase | — | — | 0.1–0.2 | 0.1 |
The numbers represent the fraction of GAG remaining in each extract after digestion with lyase, relative to the amount remaining in the mock-treated extract.
Unexpectedly, we detected neither a quantitative nor qualitative difference between urinary excretion of GAG of mutant and control mice. The amount of GAG (μg/mg creatinine) was 255 ± 92, 247 ± 148, and 294 ± 171 for 8 +/+, 8 +/−, and 17 −/− mice (1.5- to 5-mo-old), respectively. Electrophoresis on cellulose acetate plates showed that the GAG excreted by 1.5- to 3-mo-old affected and control mice was heparan sulfate (data not shown).
Analysis of Brain Gangliosides.
Table 2 shows the distribution of gangliosides in the brain of homozygous mutant and of control mice. Major increases were found in the amounts of ganglioside GM2 and GM3, 5- and 9-fold, respectively; a slight but statistically significant decrease was seen in the level of GM1. The level of other gangliosides did not appear to be affected. The total amount of ganglioside in the mutant animals was within 5% of the control.
Table 2.
Ganglioside profiles in brain
| Ganglioside | Control | Naglu −/− |
|---|---|---|
| GM3 | 46 ± 18 | 417 ± 39*** |
| GM2 | 43 ± 6 | 240 ± 37*** |
| GM1 | 1,024 ± 49 | 819 ± 79** |
| GD1a | 1,105 ± 91 | 989 ± 81 |
| GD1b | 357 ± 13 | 320 ± 26 |
| GT1 | 728 ± 31 | 675 ± 91 |
| GQ | 101 ± 23 | 80 ± 4 |
| Minor | 436 ± 68 | 510 ± 61 |
Four Naglu −/− mice and five control mice (2 +/+ and 3 +/−) were used for the analyses. Numbers represent nmol of ganglioside per g of tissue (wet weight), mean ± SD. Minor gangliosides comprise GD3, GD2 and an unknown ganglioside. ***, P < 0.001; **, P < 0.01.
Pathology.
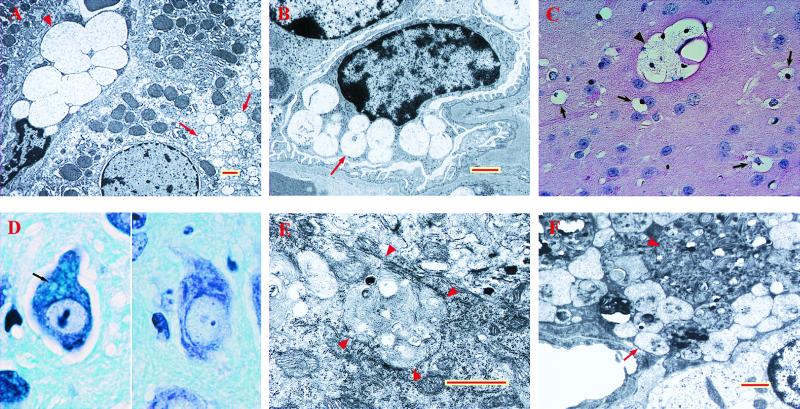
Gross pathology at 6 mo indicated neither organ atrophy nor organomegaly. By light microscopy, tissues of 22-d-old mutant mice were unremarkable. By 33 d, vacuolated macrophages were seen in many organs, including liver, spleen, lymph nodes, kidney, lung, skin, and brain. The only epithelial cells to show vacuolation at this age were found in kidney (in glomerular epithelium, in distal but not proximal convoluted tubules, and in Henle’s loop). Neurons were also found to be affected in many parts of the brain. Examination of tissues by light microscopy at 3 mo and again at 6 mo showed that essentially the same changes became more prominent with age—i.e., more vacuolated macrophages and more readily visible changes in epithelial cells and neurons. Electron microscopy showed inclusions containing finely granular material, typical of the appearance of GAG storage in liver and kidney (Fig. 4 A and B, respectively). Kupffer cells were ballooned with a few very large inclusions, whereas hepatocytes contained a large number of small vacuoles. In the kidney, glomerular and tubular epithelial cells as well as interstitial cells were vacuolated, whereas mesangial cells were not.
Figure 4.
Abnormal inclusions in tissues of mutant mice. (A) Liver of −/− mouse, 3 mo old. Note the very large vacuoles in the Kupffer cell (arrowhead) and much smaller vacuoles in the hepatocyte (arrows), both containing fine granular material. (B) Podocyte of −/− mouse, 6 mo old, showing vacuoles with fine granular material (arrow). (C) Macrophage-like cells with vacuolated cytoplasm in caudatoputamen of −/− mouse, 6 mo old (hematoxylin/eosin stain). Arrows point to individual cells, whereas arrowhead points to a cluster. (D) Neuron of dentate nucleus of cerebellum with large inclusions stained light blue (arrow) in −/− mouse (Left) and absence of such inclusions in cell from same area of a control mouse, both 6 mo old (Kluver–Barrera luxol fast blue stain). (E) Purkinje cell from 6-mo-old −/− mouse. Note the large inclusion containing lamellar as well as coarse granular material; arrowheads point to edge of the inclusion. (F) Pericyte from 6-mo-old −/− mouse. A very large pleiomorphic inclusion (arrowhead) is present in addition to inclusions containing granular material (arrow). Red and yellow bars = 1 μm.
Lesions in the central nervous system were seen by light microscopy to consist of vacuoles in macrophage-like cells and neurons. The macrophage-like cells (Fig. 4C) were found in all parts of the central nervous system and were similar in appearance to those found in numerous other organs. Fine vacuolation of neurons was seen in the olfactory bulb and accessory olfactory bulb and in selected areas of the brain cortex, thalamus, hypothalamus, amygdala, midbrain, pons, and medulla. Neurons of the caudatoputamen showed little involvement. Even in affected areas, only some neurons might appear vacuolated. In the cerebellum, most Purkinje cells and neurons in cerebellar nuclei showed a different kind of lesion. They contained one or a few large inclusions that stained poorly with hematoxylin/eosin but intensely with periodic acid/Schiff reagent. Many of these inclusions stained deep blue with Kluver–Barrera luxol fast blue stain (Fig. 4D). Similar inclusions were seen in neurons of some thalamic nuclei. Electron microscopy showed the large inclusions in Purkinje cells to contain electron-dense material, some of it with the appearance of loosely packed membranes (Fig. 4E). Perithelial cells contained inclusions with fine granular material as well as inclusions that were highly pleiomorphic (Fig. 4F).
Behavior.
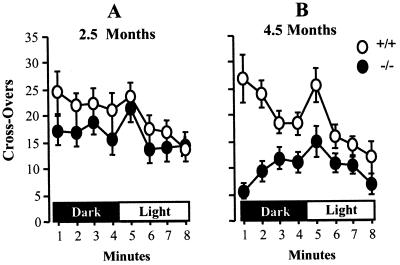
Mutant mice and +/+ controls, 2.5 and 4.5 mo old, were compared in two behavioral tests—the open field test and Pavlovian fear conditioning. The younger mutant mice did not differ significantly from the controls in open field activity in either darkness or bright light, as seen in Fig. 5A [Multivariate ANOVA; effect of genotype, F(1, 21) = 1.3, P > 0.25]. However, 4.5-mo-old mutant mice showed drastically suppressed open field activity [(F(1, 16) = 12.9, P < 0.01] (Fig. 5B).
Figure 5.
Open field behavior of mutant and control mice. Mutant (filled circles) and control +/+ mice (open circles) were tested for open field activity in darkness and in bright light. Mean ± SEM is given for crossovers scored during each minute. (A) 2.5-mo-old mice, 13 −/− and 10 +/+. (B) 4.5-mo-old mice, 9 −/− and 8 +/+.
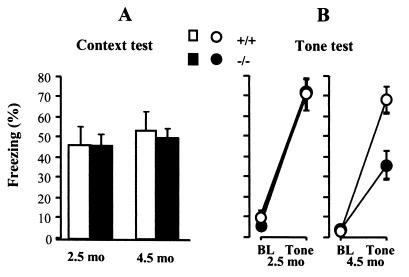
The mutant mice exhibited robust freezing during the contextual fear test, comparable to normal at both ages (Fig. 6A). ANOVA showed no significant effect of genotype or age [F(1, 36) < 0.5, P > 0.5]. In the tone test, the younger −/− mice behaved normally [F(1, 21) < 0.1, P > 0.8], but the older mutant mice exhibited a significant deficit in freezing in response to the tone [F(1, 21) = 10.4, P < 0.01) (Fig. 6B).
Figure 6.
Pavlovian fear conditioning. Mutant −/− (filled circles) and control +/+ mice (open circles), 2.5 or 4.5 mo old, were conditioned with a tone-shock pairing. Freezing is reported as % time, mean ± SEM. The mice are the same as those used in the open field test of Fig. 5. (A) Context-elicited freezing assessed for 4 min. (B) After determining baseline (BL) freezing for 2 min in a novel context, the tone was played for 4 min to assess tone-elicited freezing.
Discussion
The Naglu −/− mice show the chronic and progressive course that is characteristic of human lysosomal storage diseases. Biochemical, pathological, and behavioral changes become more pronounced with time. Although the mice are healthy and fertile while young, the effects of the disease become outwardly obvious after 6 mo. Until that time, the mice could be considered more mildly affected clinically than human patients, as is common in mouse models of lysosomal storage disease [e.g., GM1 gangliosidosis (29), α-mannosidosis (30)]. A second degradative pathway is the basis of the very mild phenotype of murine Tay–Sachs disease (31). Whether some ancillary pathway (e.g., via endoheparanase) exists in the Naglu −/− mouse is not known.
The biochemical abnormalities observed in the homozygous mutant mice were anticipated from findings in MPS patients and animal models. The deficiency of one enzyme involved in degradation of MPS is often accompanied by increases in others. This had been found for MPS I, II, III (32), and VII (33). The increase may reflect an increased number of lysosomes, increased biosynthesis, and/or stabilization of the enzymes by storage material. On the other hand, neuraminidase activity was reduced in both liver and brain of the Naglu −/− mouse. Whether the reduction is of pathologic significance is not clear.
Brain gangliosides GM2 and GM3 were found markedly elevated in the mouse model. These gangliosides are also elevated in several human MPS, including MPS III (34–36). Elevation of these gangliosides, although not directly related to the primary enzyme defect, has been suggested to play a major role in the pathogenesis of MPS III D (36).
Heparan sulfate proteoglycan is thought to be ubiquitous, either in the cell membrane or extracellular matrix (37), and heparan sulfate is therefore expected to be stored in lysosomes of all cells of the deficient mice. Yet in young Naglu −/− mice, storage was found mainly in cells of the macrophage lineage, suggesting that these cells act as a clearinghouse for any circulating heparan sulfate. Perhaps heparan sulfate fragments, which would be expected to have terminal α-N-acetylglucosaminide residues in the Naglu −/− mice, is taken up through the macrophage mannose receptor, which is known to recognize also terminal N-acetylglucosamine (38).
Tubular and glomerular cells of the kidney are the first epithelial cells to show vacuolation, in keeping with the importance of heparan sulfate in renal basement membranes (39). On the other hand, the storage in brain is puzzling. No excess heparan sulfate was seen in the soluble GAG fraction of brain, perhaps because of an absence of fragments of the size precipitable by Alcian blue. Although perithelial cells and macrophages contain vacuoles with the characteristic appearance of lysosomes filled with GAG, many neurons contain inclusions that are quite different. By electron microscopy they appear moderately dense, with coarse granular material and some membranous whorls, but they do not have the characteristic appearance of Zebra bodies, which are often found in neurons of MPS patients. Some perithelial cells also contain electron-dense inclusions. The biogenesis of these inclusions is not known.
Young Naglu−/− mice displayed normal behavior in an open field test, but by the age of 4.5 mo, they were far less active than normal controls. This hypoactivity was probably not caused by difficulty in ambulating, because the joints did not show gross pathologic abnormality. The test reflects exploratory behavior and also generalized anxiety, both of which could be altered in the mutant mice. There was no evidence of the hyperactivity that is so characteristic of children affected with Sanfilippo syndrome (11), and in this respect we find the mouse model different from the human disease.
The mutant mice showed a normal display of conditioned fear (as measured by freezing) in the context test but a reduced display in the tone test. This result seems inconsistent, because plasticity required for tone conditioning is considered simpler than that required for contextual fear (40), and suggests that the deficit in the tone test may reflect a hearing deficit rather than a true learning impairment; indeed, an increased threshold for auditory-evoked brainstem response in older mice was found in preliminary experiments by L. C. Erway (personal communication). However, our results do not rule out that the mutant mice might have impairments in more complex learning than contextual fear conditioning.
How can failure to degrade heparan sulfate within lysosomes cause neurologic disease in Sanfilippo syndrome? Heparan sulfate chains are known to bind the fibroblast growth factor family of growth factors as well as many other soluble and insoluble ligands (41). Undegraded heparan sulfate sequestered in lysosomes should not be able to function in this manner, but fragments that escape from the cell could act as either agonists or antagonists of heparan sulfate proteoglycans on the cell surface or in the extracellular matrix. Pathogenic effects of α-N-acetylglucosaminidase deficiency may be mediated though indirect effects on other lysosomal enzymes or through changes in nonneuronal cells. The unusual inclusions seen in many neurons may also hold a clue to the pathogenesis. The mouse model of the Sanfilippo type B syndrome is well suited to answer such questions, as well as to develop therapeutic strategies.
Acknowledgments
We thank Yan Huang for excellent technical assistance, Dr. Sergey Ryazantsev and Birgitta Sjostrand for electron microscopy, and Dr. Lawrence C. Erway (University of Cincinnati, Cincinnati, OH) for testing auditory brainstem response. This work was supported in part by a postdoctoral fellowship, National Institutes of Health (NIH)/NS 10141 (H.H.L.), and by grants from NIH (NS 22376) and the Children’s Medical Research Foundation (E.F.N.).
Abbreviations
- GAG
glycosaminoglycan
- MPS
mucopolysaccharidosis
Footnotes
Data deposition: The sequence reported in this paper has been deposited in the GenBank database (accession no. AF003255).
References
- 1.Neufeld E F, Muenzer J. In: The Metabolic and Molecular Bases of Inherited Disease. Scriver C R, Beaudet A L, Sly W S, Valle D, editors. New York: McGraw–Hill; 1995. pp. 2465–2494. [Google Scholar]
- 2.Zhao H G, Li H H, Bach G, Schmidtchen A, Neufeld E F. Proc Natl Acad Sci USA. 1996;93:6101–6105. doi: 10.1073/pnas.93.12.6101. [DOI] [PMC free article] [PubMed] [Google Scholar]
- 3.Weber B, Blanch L, Clements P R, Scott H S, Hopwood J J. Hum Mol Genet. 1996;5:771–777. doi: 10.1093/hmg/5.6.771. [DOI] [PubMed] [Google Scholar]
- 4.Zhao Z, Yazdani A, Shen Y, Sun Z, Bailey J, Caskey C T, Lee C C. Mamm Genome. 1996;7:686–690. doi: 10.1007/s003359900206. [DOI] [PubMed] [Google Scholar]
- 5.Schmidtchen A, Greenberg D, Zhao H G, Li H H, Huang Y, Tieu P, Zhao H Z, Cheng S, Zhao Z, Whitley C B, et al. Am J Hum Genet. 1998;62:64–69. doi: 10.1086/301685. [DOI] [PMC free article] [PubMed] [Google Scholar]
- 6.Zhao H G, Aronovich E L, Whitley C B. Am J Hum Genet. 1998;62:53–63. doi: 10.1086/301682. [DOI] [PMC free article] [PubMed] [Google Scholar]
- 7.Beesley G E, Young E P, Vellodi A, Winchester B G. J Med Genet. 1998;35:910–914. doi: 10.1136/jmg.35.11.910. [DOI] [PMC free article] [PubMed] [Google Scholar]
- 8.Weber B, Guo X H, Kleijer W J, van de Kamp J J, Poorthuis B J, Hopwood J J. Eur J Hum Genet. 1999;7:34–44. doi: 10.1038/sj.ejhg.5200242. [DOI] [PubMed] [Google Scholar]
- 9.Muenzer J. Adv Pediatr. 1986;33:269–302. [PubMed] [Google Scholar]
- 10.Kakkis E D, Neufeld E F. In: Principles of Child Neurology. Berg B O, editor. New York: McGraw–Hill; 1995. pp. 1141–1166. [Google Scholar]
- 11.Cleary M A, Wraith J E. Arch Dis Child. 1993;69:403–406. doi: 10.1136/adc.69.3.403. [DOI] [PMC free article] [PubMed] [Google Scholar]
- 12.van Schrojenstein-de Valk H M, van de Kamp J J. Am J Med Genet. 1987;28:125–129. doi: 10.1002/ajmg.1320280118. [DOI] [PubMed] [Google Scholar]
- 13.Jones M Z, Alroy J, Boyer P J, Cavanagh K T, Johnson K, Gage D, Vorro J, Render J A, Common R S, Leedle R A, et al. J Neuropathol Exp Neurol. 1998;57:148–157. doi: 10.1097/00005072-199802000-00006. [DOI] [PubMed] [Google Scholar]
- 14.Fischer A, Carmichael K P, Munnell J F, Jhabvala P, Thompson J N, Matalon R, Jezyk P F, Wang P, Giger U. Pediatr Res. 1998;44:74–82. doi: 10.1203/00006450-199807000-00012. [DOI] [PubMed] [Google Scholar]
- 15.Bhaumik M, Muller V J, Rozaklis T, Johnson L, Dobrenis K, Bhattacharyya R, Wurzelmann S, Finamore P, Hopwood J J, Walkley S U, et al. Glycobiology. 1999;9:1389–1396. doi: 10.1093/glycob/9.12.1389. [DOI] [PubMed] [Google Scholar]
- 16.Giger U, Shivaprasad H, Wang P, Jezyk P, Patterson D, Bradley G. Vet Pathol. 1997;34:5. (abstr.). [Google Scholar]
- 17.Li H H, Yu W H, Zhao H Z, Rozengurt N, Lyons K M, Anagnostaras S G, Neufeld E F. Am J Hum Genet. 1998;63:15. (abstr.). [Google Scholar]
- 18.Li H H, Yu W H, Rozengurt N, Anagnostaras S, Fanselow M, Gomez-Pinilla F, Suzuki K, Vanier M, Neufeld E F. J Neurochem. 1999;73:S23. doi: 10.1073/pnas.96.25.14505. (abstr). [DOI] [PMC free article] [PubMed] [Google Scholar]
- 19.Ramírez-Solis R, Davis A C, Bradley A. Methods Enzymol. 1993;225:855–878. doi: 10.1016/0076-6879(93)25054-6. [DOI] [PubMed] [Google Scholar]
- 20.Chow P, Weissmann B. Carbohydr Res. 1981;96:87–93. doi: 10.1016/s0008-6215(00)84698-4. [DOI] [PubMed] [Google Scholar]
- 21.Kakkis E D, Matynia A, Jonas A J, Neufeld E F. Protein Expr Purif. 1994;5:225–232. doi: 10.1006/prep.1994.1035. [DOI] [PubMed] [Google Scholar]
- 22.Björnsson S. Anal Biochem. 1993;210:282–291. doi: 10.1006/abio.1993.1197. [DOI] [PubMed] [Google Scholar]
- 23.Cappelletti R, Del Rosso M, Chiarugi V P. Anal Biochem. 1979;99:311–315. doi: 10.1016/s0003-2697(79)80012-3. [DOI] [PubMed] [Google Scholar]
- 24.Hopwood J J, Harrison J R. Anal Biochem. 1982;119:120–127. doi: 10.1016/0003-2697(82)90674-1. [DOI] [PubMed] [Google Scholar]
- 25.Fujita N, Suzuki K, Vanier M T, Popko B, Maeda N, Klein A, Henseler M, Sandhoff K, Nakayasu H. Hum Mol Genet. 1996;5:711–725. doi: 10.1093/hmg/5.6.711. [DOI] [PubMed] [Google Scholar]
- 26.Suzuki K, Vanier M T, Coetzee T, Popko B. Neurochem Res. 1999;24:471–474. doi: 10.1023/a:1022571410445. [DOI] [PubMed] [Google Scholar]
- 27.Anagnostaras S G, Maren S, Fanselow M S. J Neurosci. 1999;19:1106–1114. doi: 10.1523/JNEUROSCI.19-03-01106.1999. [DOI] [PMC free article] [PubMed] [Google Scholar]
- 28.Fanselow M S, Bolles R C. J Comp Physiol Psychol. 1979;93:736–744. doi: 10.1037/h0077609. [DOI] [PubMed] [Google Scholar]
- 29.Hahn C N, del Pilar Martin M, Schröder M, Vanier M T, Hara Y, Suzuki K, d’Azzo A. Hum Mol Genet. 1997;6:205–211. doi: 10.1093/hmg/6.2.205. [DOI] [PubMed] [Google Scholar]
- 30.Stinchi S, Lullmann-Rauch R, Hartmann D, Coenen R, Beccari T, Orlacchio A, von Figura K, Saftig P. Hum Mol Genet. 1999;8:1365–1372. doi: 10.1093/hmg/8.8.1365. [DOI] [PubMed] [Google Scholar]
- 31.Sango K, Yamanaka S, Hoffmann A, Okuda Y, Grinberg A, Westphal H, McDonald M P, Crawley J N, Sandhoff K, Suzuki K, et al. Nat Genet. 1995;11:170–176. doi: 10.1038/ng1095-170. [DOI] [PubMed] [Google Scholar]
- 32.Van Hoof F, Hers H G. Eur J Biochem. 1968;7:34–44. doi: 10.1111/j.1432-1033.1968.tb19570.x. [DOI] [PubMed] [Google Scholar]
- 33.Sands M S, Vogler C, Kyle J W, Grubb J H, Levy B, Galvin N, Sly W S, Birkenmeier E H. J Clin Invest. 1994;93:2324–2331. doi: 10.1172/JCI117237. [DOI] [PMC free article] [PubMed] [Google Scholar]
- 34.Hara A, Kitazawa N, Taketomi T. J Lipid Res. 1984;25:175–184. [PubMed] [Google Scholar]
- 35.Constantopoulos G, Eiben R M, Schafer I A. J Neurochem. 1978;31:1215–1222. doi: 10.1111/j.1471-4159.1978.tb06245.x. [DOI] [PubMed] [Google Scholar]
- 36.Jones M Z, Alroy J, Rutledge J C, Taylor J W, Alvord E C, Jr, Toone J, Applegarth D, Hopwood J J, Skutelsky E, Ianelli C, et al. J Neuropathol Exp Neurol. 1997;56:1158–1167. [PubMed] [Google Scholar]
- 37.Kjellén L, Lindahl U. Annu Rev Biochem. 1991;60:443–475. doi: 10.1146/annurev.bi.60.070191.002303. [DOI] [PubMed] [Google Scholar]
- 38.Pontow S E, Kery V, Stahl P D. Int Rev Cytol. 1992;137B:221–244. doi: 10.1016/s0074-7696(08)62606-6. [DOI] [PubMed] [Google Scholar]
- 39.Farquhar M G. In: Cell Biology of the Extracellular Matrix. Hay E D, editor. New York: Plenum; 1991. pp. 365–418. [Google Scholar]
- 40.Maren S, Fanselow M S. Neuron. 1996;16:237–240. doi: 10.1016/s0896-6273(00)80041-0. [DOI] [PubMed] [Google Scholar]
- 41.Bernfield M, Gotte M, Park P W, Reizes O, Fitzgerald M L, Lincecum J, Zako M. Annu Rev Biochem. 1999;68:729–777. doi: 10.1146/annurev.biochem.68.1.729. [DOI] [PubMed] [Google Scholar]


