Abstract
The cell envelope of gram-negative bacteria is responsible for many important biological functions: it plays a structural role, it accommodates the selective transfer of material across the cell wall, it undergoes changes made necessary by growth and division, and it transfers information about the environment into the cell. Thus, an accurate quantification of cell mechanical properties is required not only to understand physiological processes but also to help elucidate the relationship between cell surface structure and function. We have used a novel, atomic force microscopy (AFM)-based approach to probe the mechanical properties of single bacterial cells by applying a constant compressive force to the cell under fluid conditions while measuring the time-dependent displacement (creep) of the AFM tip due to the viscoelastic properties of the cell. For these experiments, we chose a representative gram-negative bacterium, Pseudomonas aeruginosa PAO1, and we used regular V-shaped AFM cantilevers with pyramid-shaped and colloidal tips. We find that the cell response is well described by a three-element mechanical model which describes an effective cell spring constant, k1, and an effective time constant, τ, for the creep deformation. Adding glutaraldehyde, an agent that increases the covalent bonding of the cell surface, produced a significant increase in k1 together with a significant decrease in τ. This work represents a new attempt toward the understanding of the nanomechanical properties of single bacteria while they are under fluid conditions, which could be of practical value for elucidating, for instance, the biomechanical effects of drugs (such as antibiotics) on pathogens.
The gram-negative cell wall is composed of two membranes (the inner and outer membranes) separated by a viscous compartment (the periplasm) that contains a thin peptidoglycan layer. The basic structural components of the inner and outer membranes are lipids and proteins, whereas the peptidoglycan layer is a covalently linked macromolecular structure composed of stiff glycan chains that are cross-linked by more-flexible peptide stems. There are also proteins associated with the peptidoglycan layer, such as lipoproteins that link it to the outer membrane. Here, the “lipo” substituent is inserted into the hydrophobic domain of the outer membrane and the “protein” portion is linked to the peptidoglycan by either covalent or electrostatic bonds (7). Despite its apparent simplicity, the cell wall of gram-negative bacteria is responsible for many important biological functions: it plays a structural role by helping to maintain cellular shape and resisting turgor pressure, it accommodates the selective transfer of material across the cell wall, it undergoes changes made necessary by growth and division, and it transfers information about the environment into the cell (26). These functions not only suggest that the cell wall is dynamic, but that its mechanical properties are of significant importance. The cell wall must be stiff enough to maintain cell shape and, at the same time, ductile enough to permit the expansion made necessary by the synthesis of cellular material and consequent growth of the cell within. As well, the passage of small molecules across the membrane is likely to induce transient deformations to which the cell envelope would need to respond by adapting to temporary nanoscale shape changes. A number of studies have also shown that forces acting on the cell surface can evoke responses at the level of gene expression (3, 4, 8). The mechanical properties of the cell wall must, therefore, be involved in the transfer of information. Accordingly, a fundamental understanding of cell physiological processes requires, in addition to details concerning genetic regulation, knowledge of the mechanical properties of cells.
For many years, estimates of cell wall mechanical properties have been largely qualitative (2, 19, 22). Many of the techniques initially used required the analysis of large numbers of cells, so that the resulting data were the average of the results for millions or even billions of bacteria. There was little regard given to the individualism of single bacteria, and often the data were obtained by using atypical mutants (sometimes) under unnaturally dry conditions. An example is the work presented by Thwaites and Mendelson (27). They developed a means to produce bacterial threads composed of multiple chains of Bacillus subtilis cells, which is a so-called macrofiber made from cultures of a cell separation-suppressed mutant that can be investigated by standard fiber-testing techniques. Bacterial threads were shown to be viscoelastic; i.e., they exhibited mechanical properties characteristic of both elastic solids and viscous fluids. The properties measured in these experiments were extrapolated to those of the cell wall and excluded the properties of the protoplasts. Because this method tested a gram-positive rod and is restricted to filament-forming mutant strains, it is not widely applicable.
Recently, atomic force microscopy (AFM) has emerged as a valuable tool that can be used not only to image the surface topography of a sample under physiological conditions but also to locally measure the mechanical properties of the material itself (15, 28, 34). To this end, force-indentation curves are commonly measured; these represent the relationship between the loading force and the depth of the indentation as the tip at the end of the AFM cantilever pushes onto the sample surface. Quantitative information on sample elasticity (e.g., Young's modulus) is obtained from the force required to achieve a certain depth penetration. AFM indentation has been used to study the elastic properties of the dried proteinaceous sheath of the archaeon Methanospirillum hungatei (33), the peptidoglycan layer of Escherichia coli and Pseudomonas aeruginosa (32), and the properties of the latter inside living cells under fully hydrated conditions (31). The results of these measurements revealed that both intact bacterial cells and their isolated cell surface layers are extensible, flexible, and elastic. However, the fluidity associated with lipid membranes, the polymeric nature of the peptidoglycan network, and the dynamic nature of the cell envelope suggest that bacterial cell walls also have a viscous response. Although their elastic nature has been extensively probed, their viscous properties have not yet been evaluated at the level of a single cell.
A viscoelastic material can have both an elastic and a viscous response to an applied stress (9, 10). Viscoelastic materials can respond to an applied stress in a variety of ways: there can be an instantaneous, elastic deformation, a delayed elastic deformation, and viscous flow (9, 10). The particular response obtained for a given material is determined by the nature of the experiment as well as the molecular motions or rearrangements that are possible for that material. In the present study, we have used a novel, AFM-based approach to probe the local viscoelastic properties of a single bacterial cell. Specifically, we applied a constant compressive force to the cell underwater while measuring the time-dependent displacement (creep) of the AFM tip. This is a nanoscale version of a conventional creep experiment which is used to study the slow time dependence of the mechanical properties of a wide variety of materials ranging from steel to polymers to biological materials (9, 30). For the present experiments, we chose a representative gram-negative bacterium, Pseudomonas aeruginosa PAO1, and we used AFM tips of two different sizes and geometries. In addition, we altered the bacterium's natural mechanical properties by exposing the cell to glutaraldehyde, which increases the covalent bonding of the cell surface. This work represents a new attempt to understand the biomechanics of single bacteria under fluid conditions. This technique and the results herein could be of practical value for elucidating the biomechanical effects of drugs (such as antibiotics) on pathogens (V. Vadillo-Rodriguez and J. R. Dutcher, unpublished data).
MATERIALS AND METHODS
Bacterial strain, growth conditions, and harvesting.
Pseudomonas aeruginosa PAO1 was maintained on Trypticase soy agar (Becton Dickinson and Company) and cultured in Trypticase soy broth (Becton Dickinson and Company) for experimentation at 37°C for 16 h on a rotary shaker (150 rpm) to a late-exponential-growth phase. Bacteria were harvested by centrifugation (5 min at 1,150 × g), washed twice, and resuspended in deionized water. For experiments on the effect of glutaraldehyde on the mechanical properties of bacterial cells, bacteria were treated with a 2.5% (vol/vol) glutaraldehyde solution (biotechnology grade; Fisher Scientific) for 2.5 h at 4°C. After glutaraldehyde treatment, the bacteria were washed once and resuspended in deionized water.
Sample preparation and cell viability.
An important requirement for AFM investigations is that the sample must be immobilized on a surface. For this purpose, an aliquot of the bacterial suspension of ∼105 cells per ml was allowed to adhere through electrostatic interaction to a poly-l-lysine-coated glass substrate that was prepared as previously described (29). After 15 min, the bacterium-coated glass substrate was rinsed with deionized water to remove loosely attached bacteria and then transferred to the AFM for immediate measurement.
To check if the use of poly-l-lysine had a deleterious effect on the viability of the bacteria, growth medium was added to a bacterium-polylysine-coated glass slide and bacterial viability monitored by using a green fluorescent protein-tagged P. aeruginosa PAO1 strain that could easily be seen by using fluorescent microscopy. Over a 24-h period at room temperature, we observed the bacteria detaching, dividing, and occasionally reattaching to the surface.
AFM imaging and force data acquisition.
All AFM measurements were conducted at room temperature under MilliQ water (resistivity of 18.2 MΩ per cm) by using an Asylum MFP-3D (Asylum Research, Santa Barbara, CA). Unless otherwise stated, imaging of the cells, with a typical length of 2 μm and 1 μm in diameter, was performed in contact mode at low applied force (∼1 nN) at a scan rate of 1 Hz using Si3N4 V-shaped cantilevers that have a pyramid-shaped tip with a typical radius of curvature of 20 nm (OTR4; Veeco). Force measurements were carried out by using two different types of AFM cantilevers: OTR4 cantilevers and Si3N4 V-shaped cantilevers with colloidal silicon oxide tips with a tip radius of curvature of 300 nm (Novascan Technologies, Inc.). Prior to use, the spring constant of each cantilever was determined by using the thermal fluctuation method (18). Typically, the cantilever spring constant was 0.07 ± 0.01 (mean ± standard deviation) N/m. To determine the elastic and viscous contributions to the mechanical properties, force-time curves were collected at the center of the top of individual cells. These curves show the time-dependent deformation of the cell surface in response to a constant applied force.
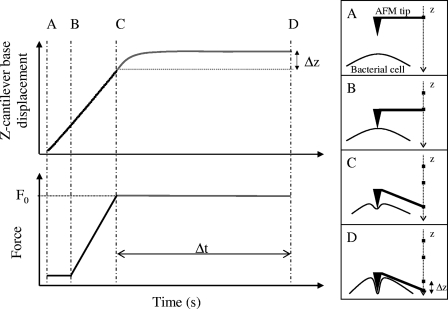
In the force-time AFM experiments, the AFM tip was lowered at a constant rate of 1.98 μm/s toward the cell surface until a preset value of the loading force F0 was reached. The loading force F0 was then held constant by controlling the cantilever deflection d, where F0 = kd and k is the cantilever spring constant, and the cantilever base displacement was measured by monitoring the vertical (Z) movement of the z-piezolectric transducer. Figure 1 shows a schematic of a typical AFM force-time curve measurement. For samples, such as bacterial cells, that are less stiff than the cantilever, the deflection of the cantilever during the approaching period (A to C in Fig. 1) can be assumed to result exclusively from the mechanical indentation of the cell. Because of this, the approach part of the force-time curves was used to generate force-indentation curves according to the method described in references 1 and 24. The data collected during the time of contact between the AFM tip and the bacterial cell (C to D in Fig. 1) represents the time-dependent deformation of the bacterial cell in the presence of a constant loading force, i.e., the cell creep response. Creep response curves were collected for contact times ranging from 1 to 10 s. In addition, to investigate the dependence of the cell mechanical response on the magnitude of the loading force, the loading force was varied between 2 and 10 nN. Three force-time curves were collected per cell for each value of the loading force and contact time. Four cells from two different cultures were studied. Thus, each set of the cell viscoelastic parameters reported in this study was calculated as the average of the values obtained from the analysis of 12 force-time curves for each experimental condition. As a control, a set of force-time curves were also recorded on clean glass substrates for each experimental condition investigated.
FIG. 1.
Schematic diagrams of typical AFM force-time curve measurements. The AFM tip is lowered at a constant rate of 1.98 μm/s toward the cell surface until a preset value of the loading force F0 is reached (A to C), at which point F0 is held constant and the cantilever base displacement (z) is measured as a function of time (C to D). The cantilever deflection during the time period B to C was assumed to result exclusively from the mechanical indentation of the cell. The period from C to D corresponds to the time over which the creep response was measured, i.e., Δt in the figure.
Evaluation of the creep response: viscoelastic parameters.
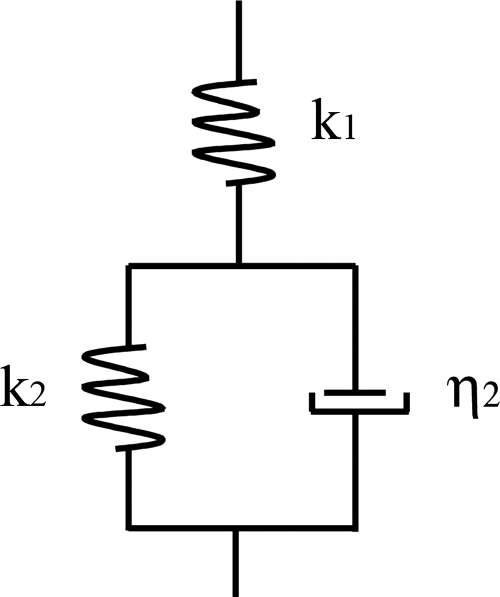
The viscoelastic behavior of materials can be modeled as combinations of elastic elements (springs) and viscous elements (dashpots) (30). These models are used to derive equations that describe the deformation of the material under investigation. One of the simplest models that predicts creep behavior is called the standard solid (10), which is shown schematically in Fig. 2. It consists of an elastic spring, which describes an instantaneous elastic deformation, placed in series with a parallel combination of a spring and dashpot (Kelvin-Voigt element), which describes a delayed elastic deformation. We have used the standard solid model to interpret the creep data obtained on bacterial cells in the present study since we obtained evidence for both an elastic and a delayed elastic response. We have not allowed for the possibility of viscous flow because the deformations observed in the present experiments are reversible, to within the precision of the experiment. Based on the standard solid model, we have derived the following equation that we have used to describe the experimentally observed creep response:
 |
(1) |
where Z(t) is the position of the z-piezoelectric transducer as a function of time t, F0 is the magnitude of the loading force, k1 and k2 are the spring constants, and η2 is the viscosity characterizing the cell surface. The ratio η2/k2 is the so-called characteristic retardation time τ corresponding to the time during which the sample deforms by 1 − e−1 (or 63.2%) of the total creep deformation.
FIG. 2.
Schematic diagram of the standard solid model used to obtain the best-fit viscoelastic parameters of the cell surface. The model consists of an elastic spring with stiffness k1, which describes the instantaneous elastic deformation, in series with a parallel combination of a spring with stiffness k2 and a dashpot with viscosity η2, which describes the delayed elastic deformation.
RESULTS AND DISCUSSION
AFM image analysis.
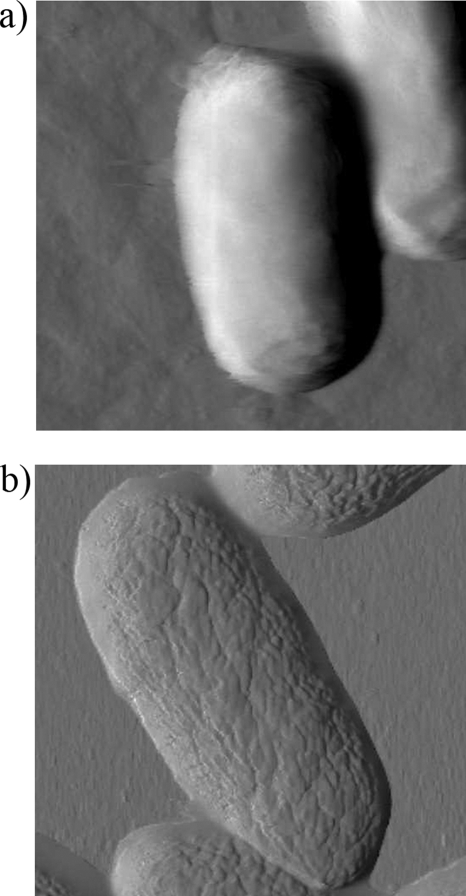
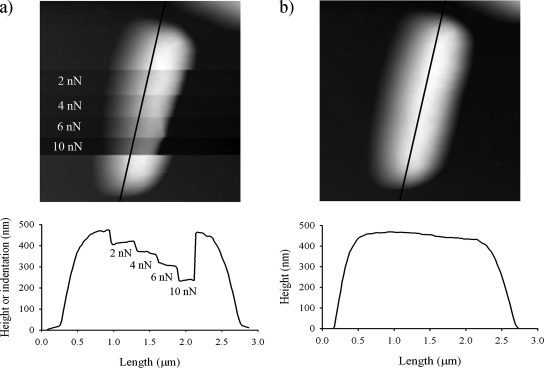
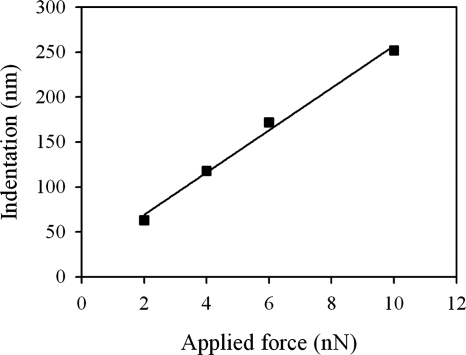
Typical AFM deflection images for an untreated and a glutaraldehyde-treated P. aeruginosa PAO1 cell in water are shown in Fig. 3a and b, respectively. The surface of the untreated cell appears smooth and almost structureless, whereas the cell treated with glutaraldehyde possesses small surface corrugations, presumably due to the treatment. Glutaraldehyde cross-links proteins within cell membranes, which could distort the outer membrane surface of the cell. Untreated cells were also imaged while increasing the loading force during the collection of the image (Fig. 4a) using pyramid-shaped AFM tips. These measurements revealed that the cell surface is easily deformed (see cross section shown in Fig. 4a) and that the tip indentation increased linearly with the loading force (Fig. 5). Remarkably, subsequent imaging of the same cell at a low value of the loading force (Fig. 4b) showed that the large deformations previously induced by the larger loading forces were completely reversible with the cell wall still intact. In addition to the decrease in cell height with increasing loading force, there is a corresponding apparent reduction of the cell width under the AFM tip, as can be seen in Fig. 4a. Obviously, the volume of the cell is not decreasing with increasing loading force, but rather the local compression of the cell by the AFM tip results in the bulging of the rest of the cell.
FIG. 3.
AFM deflection images for an untreated (a) and a glutaraldehyde-treated (b) P. aeruginosa PAO1 cell in water obtained by using V-shaped AFM cantilevers with pyramid-shaped tips. The scan size is 2 by 2 μm.
FIG. 4.
(a) AFM height image (2.5 by 2.5 μm) of a P. aeruginosa PAO1 cell obtained in contact mode by using a V-shaped AFM cantilever with a pyramid-shaped tip by increasing the loading force F0 in a step-wise fashion. The cross section corresponds to the black line shown in the AFM image along the length of the cell. (b) AFM deflection image of the same cell collected after the image shown in panel a, using a small F0 value of 1 nN.
FIG. 5.
Cell indentation estimated from the cross-section shown in Fig. 4a as a function of the force applied during AFM imaging.
It is perhaps surprising that the cell can withstand such large compressions by the AFM tip without disruption of the cell wall. Although AFM measurements have confirmed the flexibility and elasticity of isolated peptidoglycan sacculi of P. aeruginosa PAO1 cells in hydrated conditions (32), lipid bilayers can deform only slightly (between 2 and 5%) before rupturing or buckling under compression (17). However, large local curvatures of the outer and inner membranes are known to occur naturally for bacterial cells, leading to the formation of membrane vesicles (5) and mesosomes (13). In addition, the examination of ultrathin sections of P. aeruginosa PAO1 cells using transmission electron microscopy has revealed that the plasma membrane, the peptidoglycan layer, and the outer membrane deform in concert during the process of cell constriction that leads to cell division (6). Therefore, it is likely that large compressions of the cell wall due to the AFM tip can be accommodated by the cell without compromising the integrity of the cell wall, with the recovery of the original cell shape after the removal of the loading force due to the internal turgor pressure of the cell.
Analysis of force-indentation curves: cell surface elasticity.
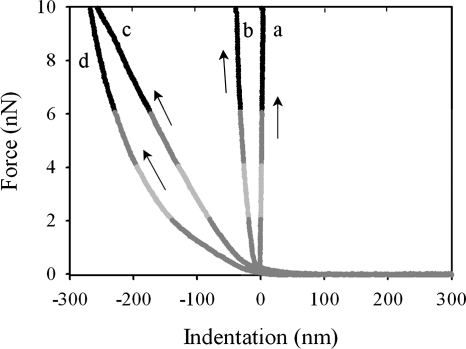
The approach portion of the force-time curves was used to generate plots of loading force versus indentation based on the assumption that the deflection of the cantilever during the approach of the AFM tip to the sample surface resulted exclusively from the mechanical indentation of the cells. An example of force-indentation curves for all the cases investigated is shown in Fig. 6 for F0 loading force values of 2, 4, 6, and 10 nN. We observe that the indentations measured for untreated cells under different loading force values agree quantitatively with those estimated from AFM images of cells under different loading force values (Fig. 5). Therefore, the assumption that the cantilever deflection results exclusively from the mechanical indentation of the cell is valid, such that other interactions between the tip and the sample surface, e.g., electrostatic forces, are not significant. The different curves in Fig. 6 have different slopes, corresponding to different stiffness values for the samples. Glass is very stiff compared with the spring constant of the AFM cantilever, and its approach curve (curve a in Fig. 6) shows no measurable indentation, corresponding to a vertical line. The glutaraldehyde-treated cells (Fig. 6, curve b) are stiffer than the untreated cells (curves c and d), as expected, with a linear increase in the indentation with the loading force. A linear response is also observed for the untreated cells measured by using colloidal AFM tips (Fig. 6, curve c). In contrast, when pyramid-shaped AFM tips are used (Fig. 6, curve d), the indentation does not increase linearly with the loading force. We attribute the nonlinearity of curve d to the high local strain exerted at the point of contact with the cell surface by the sharp tip.
FIG. 6.
Approach indentation curves for different surfaces and for F0 loading force values of 2, 4, 6, and 10 nN obtained by using pyramid-shaped AFM tips (PT) and colloidal AFM tips (CT). Curves a, b, c, and d correspond to glass (PT or CT), a glutaraldehyde-treated cell (PT), an untreated cell (CT) and an untreated cell (PT), respectively. The black arrows indicate the approach direction.
An effective cell spring constant can be estimated by calculating the ratio between the loading force and the depth of indentation only in the cases for which the cell response to the loading force is linear (i.e., elastic). The values obtained for the effective cell spring constant are 0.044 ± 0.002 N/m and 0.11 ± 0.03 N/m for untreated and glutaraldehyde-treated cells, respectively, and are independent of the loading force. Previous AFM studies of cell mechanics have been limited to the evaluation of cell surface elasticity through the analysis of force-indentation curves obtained by using V-shaped AFM cantilevers with pyramid-shaped tips (12, 23, 28). In these studies, the measured nonlinear indentation region was modeled by using the so-called Hertz model (11, 14, 25), and the values reported for the stiffness of the cell surface ranged between 0.016 and 0.053 N/m for the different gram-negative cells investigated (a bibliographic survey showing published values of cell surface elasticity can be found in reference 20). However, the Hertz model assumes infinitesimal sample deformation. From our current results, we see that for relatively soft gram-negative bacteria, the local deformation near the sharp probe usually falls into the finite strain regime, in which the induced deformations are larger than the diameter of the indenter. Thus, for such soft samples, a direct quantification of cell surface elasticity can be obtained more accurately by using colloidal AFM tips rather than pyramid-shaped AFM tips, for which the material response to the loading force is more likely to be linear.
Analysis of creep-deformation curves: cell surface viscoelasticity.
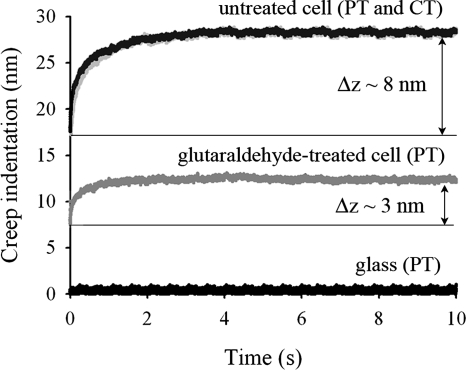
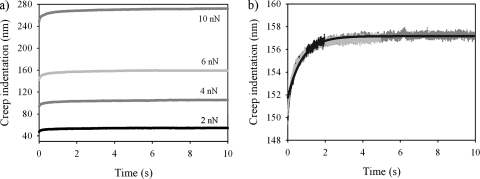
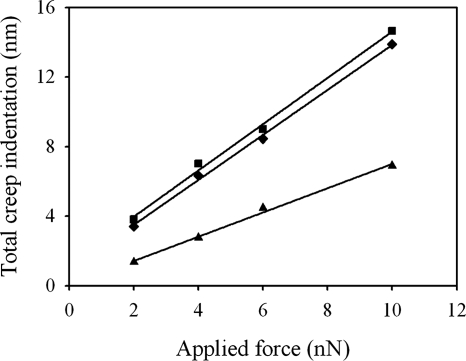
Although the elastic modulus is the most-commonly reported parameter to characterize the mechanical properties of bacterial cells, it does not provide a complete description. The force-time curves measured in the present study demonstrate that the cells undergo a time-dependent deformation in response to a constant loading force, i.e., they creep. Therefore, the cells are more-properly described as viscoelastic. In Fig. 7 we show an example of creep deformation for each type of cell and AFM tip geometry used in the present study for an F0 loading force of 4 nN. This behavior was observed for all values of the loading force F0 used in the present study (Fig. 8a). In addition, the creep data obtained for different contact times overlapped onto a master curve, as shown in Fig. 8b. We also found that the total relative deformation of the cell during creep, i.e., the total deformation that the cell undergoes after a 10 s period under a constant applied force (see the Δz values in Fig. 7), was directly proportional to the loading force (Fig. 9), verifying that the experiments were performed within the linear viscoelastic regime. We note that the creep response was also linear for untreated cells that were measured by using pyramid-shaped AFM tips and that the response coincided with that obtained by using colloidal AFM tips. Since an identical response was found at different indentation length scales, ranging from several tens of nanometers to hundreds of nanometers (comparable to the size of the cell), this indicates that the local viscoelastic properties of the cell envelope on the nanoscopic scale are similar to its viscoelastic properties on the microscopic scale. More fundamentally, this finding suggests that we are measuring an intrinsic cell property and not an artifact that is due to a particular geometry probed in the experiment.
FIG. 7.
Creep deformation as a function of time for the different cases investigated (PT and CT represent pyramid-shaped AFM tips and colloidal AFM tips, respectively) using an F0 loading force of 4 nN. Note that the glass surface does not creep with time, corresponding to a horizontal line on the plot.
FIG. 8.
(a) Creep deformation response obtained for an untreated P. aeruginosa PAO1 cell using a pyramid-shaped AFM tip with a fixed contact time of 10 s and different values of the loading force F0 as indicated on the graph. (b) Creep deformation response obtained for an untreated P. aeruginosa PAO1 cell using a pyramid-shaped AFM tip with an F0 loading force of 6 nN and different contact times (1, 2, 5, and 10 s). The solid line represents the best fit to the data for the longest contact time of 10 s.
FIG. 9.
Total creep deformation as a function of the loading force for untreated PAO1 cells measured by using pyramid-shaped AFM tips (▪) and colloidal AFM tips (♦) and for glutaraldehyde-treated PAO1 cells measured by using pyramid-shaped AFM tips (▴). The solid lines are best-fit straight lines to the data for each data set.
Since the mechanical response of the cell to the applied force varied on a time scale of several seconds (cf. Figure 7), which was very slow compared with the loading time tL (0.02 s < tL < 0.2 s for the range of loading forces 2 nN < F0 < 10 nN), we can separate the mechanical response of the cell into two components: a fast, elastic response of the cell envelope and a delayed elastic response due to creep deformation. We use the standard solid model of viscoelasticity theory (30) to describe the mechanical response of the cell, which is characterized by three parameters: k1, k2 and η2, as defined for equation 1 and Fig. 2. We found that the fits of the creep deformation data to this model were very good for all of the cells and AFM tip geometries used in the present study, with linear correlation coefficient values that are close to one (R2 ≥ 0.96). An example of a fit of typical creep deformation data to the standard solid model is shown in Fig. 8b. The averages of the best-fit values of the viscoelastic parameters of the standard solid model for the different cells and AFM tip geometries are listed in Table 1. The average values of the best-fit parameter values obtained for different values of the loading force F0 have been listed in Table 1, since the values do not vary significantly with the value of F0, with the exception of the value of k1 for untreated cells measured by using pyramid-shaped AFM tips, for which the range of k1 values is given. This variation of k1 with F0 is likely due to the nonlinear increase in cell indentation with loading force for pyramid-shaped AFM tips under this experimental condition.
TABLE 1.
Best-fit viscoelastic parameters of the standard solid model obtained for untreated and glutaraldehyde-treated PAO1 cellsa
| Cell treatment and AFM tip | Parameter and value (unit of measure)
|
|||
|---|---|---|---|---|
| k1 (N/m) | k2 (N/m) | μ2 (N·s/m) | τ (s) | |
| Untreated | ||||
| PT | 0.017-0.040b | 0.8 ± 0.1 | 1.3 ± 0.1 | 1.7 ± 0.2 |
| CT | 0.044 ± 0.002 | 0.81 ± 0.08 | 1.4 ± 0.3 | 1.8 ± 0.2 |
| Glutaraldehyde treated | ||||
| PT | 0.11 ± 0.03 | 1.5 ± 0.1 | 1.0 ± 0.2 | 0.8 ± 0.3 |
Cells were measured by using pyramid-shaped AFM tips (PT) and colloidal AFM tips (CT). The parameters k1 and k2 are the stiffness values of the elastic springs, η2 is the viscosity of the dashpot (cf. Fig. 2), and τ is the characteristic retardation time defined as the ratio η2/k2. We have listed the average values of the best-fit parameters obtained for different values of the loading force F0 (2, 4, 6, and 10 nN) since the values do not vary significantly with the value of the loading force, with the exception of the value of k1 for untreated cells measured using pyramid-shaped AFM tips, for which the range of k1 values is given. The uncertainty values listed in the table correspond to the standard deviation of the average values of the best-fit parameters obtained for different values of the loading force.
A range of k1 values is given for this particular experimental condition, corresponding to the range of loading forces used in the present study.
We note that the average value of k1 = 0.044 ± 0.002 N/m obtained for the colloidal AFM tips is the same as the sample stiffness determined independently from the force-indentation curves (0.044 ± 0.002 N/m), as discussed in the previous section. This agreement between the two values validates our interpretation of k1 as the elastic response of the cell envelope. In addition, the best-fit values of the characteristic response time τ are consistent with the time scale observed for creep deformation.
To further test the validity of our use of the standard solid model to interpret the creep deformation data, we exposed bacterial cells to glutaraldehyde. Treatment with glutaraldehyde increased the stiffness of the cell by at least a factor of 2.8 (corresponding to a value of k1 = 0.11 ± 0.03 N/m), presumably due to increased cross-linkages between amine groups located in the cell envelope. In addition, the treatment of the cells with glutaraldehyde resulted in a decrease of τ by a factor of 2.2, indicating that the cell envelope responds more quickly to the deformation, which is consistent with an enhanced elastic response.
Slow, time-dependent creep deformation in response to an applied force could be a distinct advantage to bacterial cells. As cells grow, it is necessary to break some of the bonds within the very thin, highly stressed peptidoglycan network so that new peptidoglycan material can be inserted. The bond breaking is accomplished by autolysin molecules produced within the cell and transported through the cell wall. Maintaining the mechanical integrity of the peptidoglycan layer during cell growth is a challenging requirement for the cell, since the breaking of a bond will transfer stress to neighboring bonds, which are consequently easier to break. This could lead to a “domino” type of reaction, causing a tear or fissure and the eventual lysis of the cell. It is possible that the viscoelastic response of the bacterial cell wall observed in the present study could delay the accumulation of localized strain and allow bonds to reform before the rupture of the network can occur. This proposed mechanism for maintaining peptidoglycan network integrity during hydrolase activity has the advantage that it does not require the existence of other specialized enzymes that have been postulated (16, 21) but have not been observed.
The large deformations of the bacterial cell wall associated with cell division also make stringent demands on the mechanical properties of the bacterial cell wall. Our observation of the ability of bacterial cells with large intracellular turgor pressure to withstand very large deformations by the AFM tip (cf. Fig. 4) without lysing indicates the high strength of the peptidoglycan network.
It is clear from the results of these measurements that the mechanical properties of bacterial cell walls might fulfill a major role in the proper growth and division of the cells. The AFM-based technique to measure the local viscoelasticity on live bacterial cells described in the present study can provide important insight into various aspects of the mechanical properties. For example, the relative importance of cell elasticity and viscosity will depend on the chemical composition of the bacterial cell wall and the interactions between various structural components. Comparison of the mechanical response of cells which differ in the composition and architecture of their outer layer holds considerable promise for elucidating the role of specific molecular interactions in maintaining cell integrity, as well as other aspects of cell physiology. In addition, we have demonstrated that changes in the mechanical properties of the cells in response to external treatments, such as glutaraldehyde treatment, can be monitored. Antimicrobial compounds, such as beta-lactam antibiotics, cephalosporins, vancomycin, and (perhaps) aminoglycosides, are known to disrupt the peptidoglycan layer, and many other compounds can inhibit protein or DNA synthesis. Such physiological modifications to bacterial cell surfaces will likely produce corresponding changes to their physical properties, such as their elasticity and viscosity, and measurement of these properties could provide important insights into the mechanism of action of antibiotic agents.
In summary, we have presented a novel, nondestructive, AFM-based approach for the characterization of the mechanical behavior of individual bacterial cells. Through AFM imaging and the measurement of AFM force-indentation and force-time curves, we have demonstrated that the time-dependent response of gram-negative P. aeruginosa PAO1 cells to a constant loading force is viscoelastic, with both an elastic and a delayed elastic response. Further studies are needed to make definite correlations between the complex mechanical behavior of bacterial cell walls and their biological function.
Acknowledgments
We gratefully acknowledge financial support from the Advanced Foods and Materials Network (AFMnet), the Canadian Foundation for Innovation, and the Natural Sciences and Engineering Research Council of Canada. J.R.D. and T.J.B. acknowledge support from the Canada Research Chairs (CRC) program.
This work is dedicated to T.J.B., our good friend and superb colleague, who passed away during the preparation of the manuscript.
Footnotes
Published ahead of print on 11 April 2008.
REFERENCES
- 1.Arnoldi, M., C. M. Kacher, E. Bauerlein, M. Radmacher, and M. Fritz. 1998. Elastic properties of the cell wall of Manetospirillum gryphyswaldense investigated with atomic force microscopy. Appl. Phys. 66S613-S617. [Google Scholar]
- 2.Baldwin, W. W., M. J.-T. Sheu, P. W. Bankston, and C. L. Woldringh. 1988. Changes in buoyant density and cell size of Escherichia coli in response to osmotic shocks. J. Bacteriol. 170452-455. [DOI] [PMC free article] [PubMed] [Google Scholar]
- 3.Bartlett, D., M. Wright, A. A. Yayamos, and M. Silverman. 1989. Isolation of a gene regulated by hydrostatic pressure in a deep-sea bacterium. Nature 342572-574. [DOI] [PubMed] [Google Scholar]
- 4.Belas, R., M. Simon, and M. Silverman. 1986. Regulation of lateral flagella gene transcription in Vibrio parahaemolyticus. J. Bacteriol. 167210-218. [DOI] [PMC free article] [PubMed] [Google Scholar]
- 5.Beveridge, T. J. 1999. Structure of gram-negative cell walls and their derived membrane vesicles. J. Bacteriol. 1814725-4733. [DOI] [PMC free article] [PubMed] [Google Scholar]
- 6.Beveridge, T. J. 1989. The structure of bacteria, p. 1-65. In J. S. Poindexter and E. R. Leadbetter (ed.), Bacteria in nature, vol. 3. Plenum Press, New York, NY. [Google Scholar]
- 7.Cabben, M. T., and C. Jacobs-Wagner. 2005. Bacterial cell shape. Nat. Rev. Microbiol. 3601-610. [DOI] [PubMed] [Google Scholar]
- 8.Csonka, L. N. 1989. Physiological and genetic responses of bacteria to osmotic stress. Microbiol. Rev. 53121-147. [DOI] [PMC free article] [PubMed] [Google Scholar]
- 9.Ferry, J. D. 1980. Viscoelastic properties of polymers, 3rd ed. John Wiley & Sons, Hoboken, NJ.
- 10.Findley, W. N., J. S. Lai, and K. Onaran. 1989. Creep and relaxation of nonlinear viscoelastic materials with an introduction to linear viscoelasticity. Dover Publications, Inc., New York, NY.
- 11.Gaboriaud, F., B. S. Parcha, M. L. Gee, J. A. Holden, and R. A. Strugnell. 2008. Spatially resolved force spectroscopy of bacterial surfaces using force-volume imaging. Colloids Surf. B. 62206-213. [DOI] [PubMed] [Google Scholar]
- 12.Gaboriaud, F., S. Bailet, E. Dague, and F. Jorand. 2005. Surface structure and nanomechanical properties of Shewanella putrefaciens bacteria at two pH values (4 and 10) determined by atomic force microscopy. J. Bacteriol. 1873864-3868. [DOI] [PMC free article] [PubMed] [Google Scholar]
- 13.Greenawalt, J. W., and T. L. Whiteside. 1975. Mesosomes: membranous bacterial organelles. Bacteriol. Rev. 39405-463. [DOI] [PMC free article] [PubMed] [Google Scholar]
- 14.Hertz, H. 1881. Über die Berührung fester elastischer Körper. J. Reine Angew. Math. 92156-171. [Google Scholar]
- 15.Hoh, J. H., and C.-A. Schoenenberger. 1994. Surface morphology and mechanical properties of MDCK monoloayers by atomic force microscopy. J. Cell Sci. 1071105-1114. [DOI] [PubMed] [Google Scholar]
- 16.Koch, A. L. 2001. Bacterial growth and form, 2nd ed. Kluwer Academic Publishers, Dordrecht, The Netherlands.
- 17.Koch, A. L. 1998. The biophysics of the gram-negative periplasmic space. Crit. Rev. Microbiol. 2423-59. [DOI] [PubMed] [Google Scholar]
- 18.Levy, R., and M. Maaloum. 2002. Measuring the spring constant of atomic force microscope cantilevers: thermal fluctuations and other methods. Nanotechnology 1333-37. [Google Scholar]
- 19.Marquis, R. E. 1968. Salt-induced contraction of bacterial cell walls. J. Bacteriol. 95775-781. [DOI] [PMC free article] [PubMed] [Google Scholar]
- 20.Mendez-Vilas, A., A. M. Gallardo-Moreno, and M. L. Gonzales-Martin. 2007. Atomic force microscopy of mechanically trapped bacterial cells. Microsc. Microanal. 1355-64. [DOI] [PubMed] [Google Scholar]
- 21.Norris, V., J. A. Ayala, K. Begg, et al. 1994. Cell cycle control: prokaryotic solutions to eukaryotic problems? J. Theor. Biol. 168227-230. [DOI] [PubMed] [Google Scholar]
- 22.Ou, L.-T., and R. E. Marquis. 1970. Electrochemical interactions in cell walls of gram-positive cocci. J. Bacteriol. 10192-101. [DOI] [PMC free article] [PubMed] [Google Scholar]
- 23.Penegar, I., C. Toque, S. D. A. Cornell, J. R. Smith, and S. A. Campbell. 1999. Nano-indentation measurements of the marine bacteria Sphingomonas paucimobilis using the atomic force microscope, p. 5-15. In J. A. Lewis (ed.), 10th Int. Congr. Marine Corrosion Fouling, Melbourne, Australia.
- 24.Radmacher, M., M. Fritz, and P. K. Hansma. 1995. Imaging soft samples with the atomic force microscope: gelatin in water and propanol. Biophys. J. 69264-270. [DOI] [PMC free article] [PubMed] [Google Scholar]
- 25.Sneddon, I. N. 1965. The relation between load and penetration in the axisymmetric Boussinesq problem for a punch of arbitrary profile. Int. J. Eng. Sci. 347-57. [Google Scholar]
- 26.Thwaites, J. J., and N. H. Mendelson. 1991. Mechanical behaviour of bacterial cell walls. Adv. Microb. Physiol. 32173-222. [DOI] [PubMed] [Google Scholar]
- 27.Thwaites, J. J., and N. H. Meldenson. 1985. Biomechanics of bacterial walls: studies of bacterial thread made from Bacillus subtilis. Proc. Natl. Acad. Sci. USA 822163-2167. [DOI] [PMC free article] [PubMed] [Google Scholar]
- 28.Touhami, A., B. Nysten, and Y. F. Dufrene. 2003. Nanoscale mapping of the elasticity of microbial cells by atomic force microscopy. Langmuir 194539-4543. [Google Scholar]
- 29.Vadillo-Rodriguez, V., H. J. Busscher, W. Norde, J. de Vries, R. J. B. Dijkstra, I. Stokroos, and H. C. van der Mei. 2004. Comparison of atomic force microscopy interaction forces between bacteria and silicon nitride substrata for three commonly used immobilization methods. Appl. Environ. Microbiol. 705441-5446. [DOI] [PMC free article] [PubMed] [Google Scholar]
- 30.Ward, I. M., and D. W. Hadley. 1993. An introduction to the mechanical properties of solid polymers. John Wiley & Sons, Hoboken, NJ.
- 31.Yao, X., J. Walker, S. Burke, S. Stewart, M. H. Jericho, D. Pink, R. Hunter, and T. Beveridge. 2002. Atomic force microscopy and theoretical considerations of surface properties and turgor pressures of bacteria. Colloids Surf. B 23213-230. [Google Scholar]
- 32.Yao, X., M. Jericho, D. Pink, and T. Beveridge. 1999. Thickness and elasticity of gram-negative murein sacculi measured by atomic force microscopy. J. Bacteriol. 1816865-6875. [DOI] [PMC free article] [PubMed] [Google Scholar]
- 33.Xu, W., P. J. Mulhern, B. L. Blackford, M. H. Jericho, M. Firter, and T. J. Beveridge. 1996. Modeling and measuring the elastic properties of an archaeal surface, the sheath of Methanospirillum hungatei, and the implication for methane production. J. Bacteriol. 1783106-3112. [DOI] [PMC free article] [PubMed] [Google Scholar]
- 34.Zhao, L., D. Schaefer, and M. R. Marten. 2005. Assessment of elasticity and topography of Aspergillus nidulans spores via atomic force microscopy. Appl. Environ. Microbiol. 71955-960. [DOI] [PMC free article] [PubMed] [Google Scholar]


