Abstract
Glucocorticosteroid hormones, including dexamethasone, have diverse effects on immature lymphocyte function that ultimately lead to cell death. Previous studies established that glucocorticoid-induced alterations in intracellular calcium homeostasis promote apoptosis, but the mechanism by which glucocorticoids disrupt calcium homeostasis is unknown. Through gene expression array analysis, we found that dexamethasone induces a striking elevation of inositol 1,4,5-trisphosphate receptor (IP3R) levels in two murine lymphoma cell lines, WEHI7.2 and S49.A2. IP3R elevation was confirmed at both mRNA and protein levels. However, there was not a strong correlation between IP3R elevation and altered calcium homeostasis in terms of either kinetics or dose response. Moreover, IP3R knockdown, by either antisense or small interfering RNA, did not prevent either calcium disruption or apoptosis. Finally, DT40 lymphoma cells lacking all three IP3R isoforms were just as sensitive to dexamethasone-induced apoptosis as wild-type DT40 cells expressing all three IP3R isoforms. Thus, although alterations in intracellular calcium homeostasis contribute to glucocorticoid-induced apoptosis, these calcium alterations are not directly attributable to IP3R elevation.
Glucocorticosteroid hormones are essential regulators of metabolism, development, and immunity. The effects of glucocorticoids on the immune system are particularly noteworthy because of their clinically important anti-inflammatory and immunosuppressive actions (reviewed in Ref. 1). Glucocorticoids have both positive and negative effects on thymocyte development and lymphocyte function (reviewed in Refs. 2 and 3). At pharmacological levels, glucocorticoids have profoundly negative effects on immature lymphocytes, inhibiting both glucose metabolism and cytokine signaling (reviewed in Ref. 4). Sustained exposure to pharmacological glucocorticoid concentrations inhibits lymphocyte proliferation and ultimately culminates in cell death, long recognized to be a prime example of apoptosis (5). Thus, the potent synthetic glucocorticoids prednisone and dexamethasone are among the most effective agents used to treat lymphoid malignancies (reviewed in Ref. 6).
Glucocorticoid actions are generally genomic in nature and mediated through the glucocorticoid receptor, a member of the nuclear receptor superfamily of transcription factors (reviewed in Ref. 7). Pioneering studies decades ago used the WEHI7.2 and S49 murine T-cell lines to demonstrate the essential role of glucocorticoid receptors in mediating cell death induction by dexamethasone (8). Numerous studies, including those employing the CEM human T-cell leukemia line and transgenic mouse models, have further refined our knowledge of the role of glucocorticoid receptors and glucocorticoid-mediated gene regulation in this important form of apoptosis (reviewed in Refs. 4, 9, and 10). Using similar model systems, the technology of oligonucleotide microarray analysis has been applied to identify the spectrum of genes regulated by glucocorticoids in both normal and leukemic lymphocytes (11–16). Gene expression analysis has also been extended to glucocorticoid-treated primary leukemia cells isolated from patient samples (17, 18).
Because of the fundamental importance of glucocorticoid-induced apoptosis, the primary goal of these gene expression studies has been to identify glucocorticoid-regulated genes responsible for mediating cell death. Not surprisingly, these studies have identified a large number of glucocorticoid-regulated genes, including the gene encoding the pro-apoptotic protein Bim (15). Bim knockdown inhibits glucocorticoid-induced apoptosis, and hence, its up-regulation by dexamethasone plays a critical role in this cell death process (19, 20), but other glucocorticoid-induced genes potentially involved in mediating cell death were also detected by microarray analysis (21–23).
Here we report finding, through oligonucleotide microarray analysis, that the expression of genes encoding IP3R2 isoforms 1 and 2 are up-regulated by dexamethasone in both WEHI7.2 and S49.A2 cells. IP3Rs are ligand-gated calcium channels located in the endoplasmic reticulum (ER) membrane (reviewed in Refs. 24–26). Various roles for IP3Rs in cell survival and apoptosis have been proposed (reviewed in Ref. 27). Finding that IP3R expression is glucocorticoid-induced is intriguing because numerous reports indicate that glucocorticoid treatment alters calcium homeostasis in lymphocytes, contributing to cell death induction (reviewed in Refs. 4 and 28). One might speculate that IP3R elevation could contribute to alterations in calcium homeostasis in the absence of IP3-mediated stimulation through several mechanisms. If IP3Rs are not completely closed in the basal unstimulated state, net calcium leakage would be magnified by an elevation of IP3R levels. Also, other events associated with the cell death process may trigger IP3R-mediated calcium loss from the ER as follows: (i) elevation of reactive oxygen species, known to sensitize IP3Rs to endogenous levels of IP3 (29); (ii) release from mitochondria of cytochrome c, which is reported to bind to IP3Rs and enhance their opening (30); and (iii) activation of caspases, which cleave IP3Rs, producing a continuously open truncated channel (31, 32). Therefore, in the work described here, the dexamethasone-mediated elevation of IP3Rs is confirmed at both the mRNA and protein levels, and the hypothesis that IP3R induction mediates calcium changes that promote apoptosis is tested by multiple approaches.
EXPERIMENTAL PROCEDURES
Reagents—Unless otherwise noted, all chemicals were purchased from Sigma.
Cell Culture and Gene Expression Analysis—WEHI7.2 and S49.A2 cells were cultured and gene expression analysis was conducted using Affymetrix MG-U74A (version 2) GeneChips as described previously (15). DT40 wild-type and IP3R triple-knockdown cell lines, originally created by Sugawara et al. (33), were gifts from William Schilling (Case Western Reserve University) and were cultured in RPMI 1640 medium containing 10% heat-inactivated fetal bovine serum (U. S. Biochemical Corp.), 1% chicken serum, 2 mm l-glutamine, 12.5 units/ml penicillin, and 12.5 μg/ml streptomycin.
Northern Blotting—Northern blotting was performed by standard methods. Full-length cDNA probes for IP3R1, IP3R2, and IP3R3 were obtained by performing restriction digests on pGEM-T Easy vectors (Promega) that contained full-length sequences generated by PCR from expression constructs for IP3R1 and IP3R3 (gifts from Dr. Suresh Joseph, Thomas Jefferson University) and IP3R2 (gift from Dr. Jean-François Dufour, University of Bern).
Immunoblotting—Immunoblotting was performed as described previously (34) with protein samples electrophoretically resolved through 4–20% gradient gels (Bio-Rad). The antibodies for IP3R1, IP3R3, and β-actin were purchased from Calbiochem, Pharmingen, and Sigma, respectively. Antibody for IP3R2 was a gift from Richard Wojcikiewicz (SUNY Upstate Medical University).
Ca2+ Measurements—Ca2+ measurements by fluorometry were performed as described previously (34). Briefly, cells were loaded in extracellular buffer (130 mm NaCl, 5 mm KCl, 1.5 mm CaCl2, 1 mm MgCl2, 25 mm HEPES, pH 7.5, 1 mg/ml bovine serum albumin, and 5 mm glucose) with 1 μm Fura-2/AM for 45 min at room temperature. Cells were then pelleted and resuspended in fresh extracellular buffer and incubated for 30 min at room temperature to allow dye de-esterification. Ca2+ measurements were then performed on a fluorometer (Photon Technologies, Inc.). 10 mm EGTA was added immediately before cytosolic Ca2+ was measured to chelate extracellular Ca2+ and eliminate its contribution to the determined Ca2+ concentration. Data were analyzed using Felix software version 1.42 (Photon Technologies, Inc.).
Flow Cytometric Apoptosis Assays—One million cells were collected by centrifugation, washed once with PBS, and resuspended in 500 μl of ice-cold methanol for fixation. After incubation for at least 1 h at –20 °C, cells were centrifuged, washed once with PBS, and incubated for 30 min at 37 °C in staining solution (50 μg/ml propidium iodide (Molecular Probes), 0.1% Nonidet P-40, 20 μg/ml RNase A, and 0.1% sodium azide in PBS). Propidium iodide fluorescence was measured with a FACScan XL flow cytometer (Coulter). Single whole cells with a DNA content less than that of the G1 population were scored as apoptotic. Data analysis was conducted using WinList 3D version 5.0 (Verity Software House). Quantification of apoptosis in live cells, as performed in experiments using DT40 cells, was as follows. 24 h after vector electroporation, 1 million cells were pelleted and resuspended in 1 ml of PBS. Hoechst 33342 (Molecular Probes) was added to a final concentration of 5 μg/ml, and cells were incubated at 37 °C for 15 min. Cells were then analyzed on a BD Biosciences LSR flow cytometer, exciting Hoechst 33342 with a UV laser and GFP with a 488-nm laser. Single whole cells with a DNA content less than that of the G1 population were scored as apoptotic.
RNA Interference—The negative control siCONTROL non-targeting siRNA pool as well as IP3R1, IP3R2, and IP3R3 siGENOME SMARTpools were purchased from Dharmacon (Lafayette, CO). After suspension in 1× siRNA buffer, SMARTpools were added at a concentration of 1 μm each to 0.2-cm cuvettes containing 10 million WEHI7.2 cells suspended in 200 μl of Opti-MEM I (Invitrogen). Cuvettes were then subjected to a single 140-V, 10-ms square-wave pulse from a Gene Pulser Xcell (Bio-Rad), and the contents of the cuvette were immediately added to fresh medium. The electroporation conditions were optimized by electroporating 1 μm siGLO cyclophilin B (Dharmacon) and visualizing cellular siRNA uptake by epifluorescence microscopy. The optimized conditions yielded siRNA uptake into >80% of WEHI7.2 cells. Cells were grown in culture post-transfection for 24 h before use in subsequent experiments.
IP3R Antisense RNA Repression—The IP3R antisense RNA vector (pcDNA3.1-IP3R-antisense) was created by amplifying the –211 to +466 fragment of IP3R1 from pGEM-T-IP3R1 by PCR and ligating it in reverse orientation into pcDNA3.1(+) (Invitrogen). WEHI7.2 cells were transfected with the IP3R antisense RNA vector or the empty vector control using the electroporation protocol as described above, and cells were added to a T75 flask with tissue culture medium containing 1 mg/ml G418. Cell populations were monitored daily and split to 100,000 cells/ml if the density approached 1 million cells/ml. After 1 week in selection culture, live cells were isolated with Ficoll-Paque Plus (GE Healthcare) according to the manufacturer's standard protocol. G418-resistant cells were cultured in the continued presence of 1 mg/ml G418 until they were used in experiments.
Dexamethasone Binding Assay—Twenty million cells of each type analyzed were pelleted by centrifugation and washed twice in fresh medium. Cells were then resuspended at a concentration of 5 million/ml, and 1 ml was transferred to autoclaved glass tubes, four tubes per cell type. [3H]Dexamethasone was then added to each glass tube at a final concentration of 30 nm. Unlabeled dexamethasone was added to two of the four tubes at a final concentration of 3 μm. Cells were then incubated for 2 h, and the incubation was terminated by the addition of 3 ml of ice-cold PBS. Cells were centrifuged, and the pellet was resuspended in 1 ml of culture medium. Following room temperature incubation for 5 min, cells were washed once with ice-cold PBS and resuspended in 1 ml of ethanol. Radioactivity was quantified by scintillation counting, and the specific dexamethasone binding was calculated as the radioactivity in the [3H]dexamethasone-only tube minus the radioactivity in the tube containing [3H]dexamethasone with unlabeled dexamethasone.
Dual-Luciferase Reporter Assay—Dual-Luciferase reporter assays were performed using the Dual-Luciferase reporter assay kit (Promega) according to the manufacturer's standard protocol. Briefly, DT40 cells were electroporated (5 million cells; 0.2-cm cuvette subjected to a single 140-V, 10-ms square-wave pulse) with 50 μg of pTAT3-Luc, which contains three tandem repeats of the glucocorticoid-responsive tyrosine aminotransferase promoter linked to firefly luciferase (gift of Jorge Iniguez-Lluhi, University of Michigan). For a transfection control, cells were electroporated with 5 μg of phRG-TK (Promega), a constitutively expressing Renilla luciferase vector. In addition to the luciferase expression vectors, cells were electroporated with 50 μg of pEmd-C1 (modified pEGFP-C1 vector, Clontech) or pGR-GFP, which is pEmd-C1 containing the rat glucocorticoid receptor cDNA. Transfected cells were treated with 1 μm dexamethasone for 18 h and then harvested by centrifugation. Cell pellets were washed with PBS, resuspended in Passive lysis buffer solution, and incubated on ice for 30 min. The tubes were then centrifuged at maximum speed for 5 min, and 10 μl of supernatant was added to 96-well plates in duplicate. Luminescence was measured in a PerkinElmer Victor3 plate reader, which measured firefly and Renilla luciferase activity following injection of appropriate substrates. Background luminescence was measured in wells containing 10 μl of water instead of cell supernatant. Promoter activity was quantified by dividing the background-corrected firefly luciferase luminescence by the background-corrected Renilla luciferase luminescence.
Statistics—Statistical analyses were performed with Microsoft Excel 2003 using a two-tailed Student's t test.
RESULTS
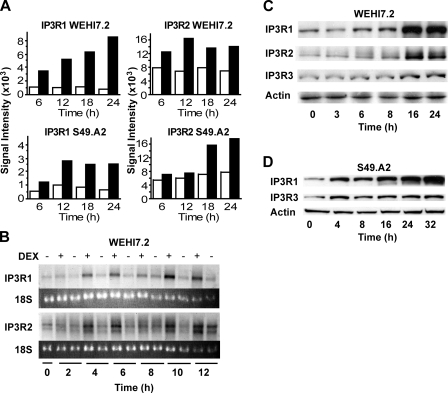
IP3R Up-regulation by Dexamethasone—As detailed in earlier reports from our laboratory (15, 21–23), two glucocorticoid-sensitive murine T-cell lines, WEHI7.2 and S49.A2, were employed in microarray experiments to identify genes up-regulated by dexamethasone. Briefly, both cell lines were incubated in parallel with 1 μm dexamethasone or ethanol (the vehicle in which dexamethasone was dissolved) for various times, followed by mRNA isolation and hybridization to Affymetrix oligonucleotide arrays. Increased hybridization of mRNA from both of the dexamethasone-treated cell lines to oligonucleotide probe sets corresponding to IP3R1 and IP3R2, relative to time matched vehicle controls, was detected (Fig. 1A). Notably, probe sets corresponding to IP3R3 were not present on the arrays. The dexamethasone-mediated up-regulation of IP3R1 and IP3R2 in WEHI7.2 cells was confirmed by Northern hybridization (Fig. 1B) and immunoblotting (Fig. 1C). A more modest elevation of IP3R3 was detected following dexamethasone treatment (Fig. 1C). Dexamethasone also up-regulated IP3Rs in S49.A2 cells, and here also the induction of IP3R1 was more prominent than the induction of IP3R3 (Fig. 1D).
FIGURE 1.
IP3R induction by dexamethasone. A, signal intensities of labeled complementary RNA hybridized to oligonucleotide probes on Affymetrix arrays for IP3R1 and IP3R2 in WEHI7.2 and S49.A2 lymphoma cells. Cells were treated for the indicated times with ethanol vehicle (white bars) or 1 μm dexamethasone (black bars). Data represent the mean of duplicate samples. B, Northern blot analysis confirming elevation of IP3R1 and IP3R2 mRNA levels in WEHI7.2 cells following treatment with 1 μm dexamethasone (DEX). Results are representative of five experiments. C and D, immunoblots confirming elevation of IP3Rs in WEHI7.2 and S49.A2 cells treated with 1 μm dexamethasone. Results are representative of multiple independent experiments: five for WEHI7.2 and three for S49.A2.
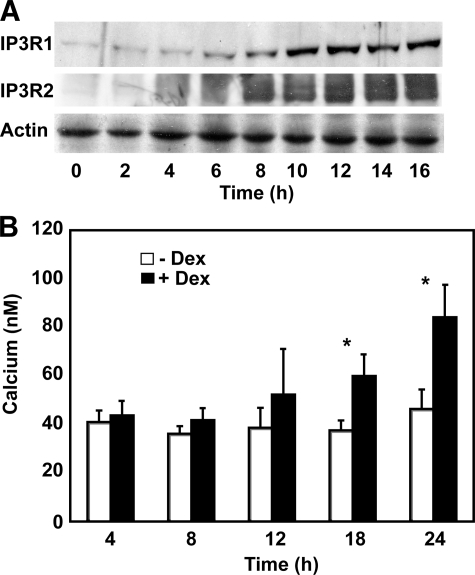
Lack of Correlation between IP3R Up-regulation and Calcium Alterations—To assess the potential correlation between IP3R elevation and cytoplasmic calcium elevation, IP3R1 levels and cytoplasmic calcium levels were measured at frequent time points over a 24-h period after adding 1 μm dexamethasone to WEHI7.2 cells (Fig. 2). IP3R1 and IP3R2 elevations were detected by immunoblotting as early as 6 h following dexamethasone addition and were nearly maximal by 10 h (Fig. 2A). Cytoplasmic calcium elevation, measured fluorometrically using the calcium-sensitive dye Fura-2/AM, appeared to lag behind IP3R elevation, being variable (p = 0.31) at 12 h following dexamethasone addition but significant (p ≤ 0.01) at 18 and 24 h after dexamethasone addition (Fig. 2B). Based on single-cell calcium measurements, the calcium elevation appeared throughout the cell population rather than reflecting a large elevation in a subpopulation of cells (data not shown). Although the delay between IP3R elevation and calcium elevation suggests a lack of correlation between these two events, it is possible that because calcium homeostasis is tightly regulated the cell works to maintain calcium homeostasis as long as possible.
FIGURE 2.
Kinetics of IP3R and calcium elevations. A, an immunoblot, representative of multiple experiments, documenting the time course of IP3R1 and IP3R2 elevation in WEHI7.2 cells treated with 1 μm dexamethasone. IP3R elevation is detected as early as 6 h following dexamethasone addition and appears nearly maximal by 10 h. B, time course of cytoplasmic calcium elevation following treatment of WEHI7.2 cells with 1 μm dexamethasone (Dex). Error bars represent the mean ± S.E. of five separate experiments. *, p ≤ 0.01.
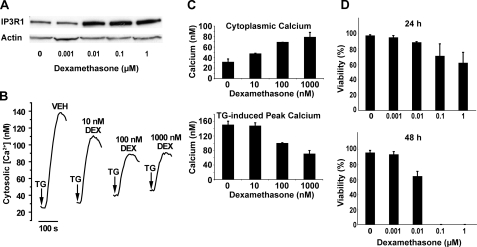
Also, the dose-response relationship between IP3R elevation and disruption of calcium homeostasis was assessed. As shown in Fig. 3A, the IP3R elevation at 10 nm dexamethasone was just as high as at 0.1 and 1 μm. This observation was highly consistent in five separate experiments. The effect of the same range of dexamethasone concentrations on cytoplasmic calcium concentration and thapsigargin (TG)-induced calcium elevation was measured fluorometrically in Fura-2/AM-loaded cells. Note that extracellular calcium was chelated by EGTA immediately before adding TG. Hence, the cytoplasmic calcium elevation induced by TG is an indirect measure of ER calcium content. A dose-related elevation of cytoplasmic calcium concentration was accompanied by a dose-related decrease in TG-induced peak calcium elevation (Fig. 3, B and C). These findings confirm our earlier evidence that cytoplasmic calcium concentration is elevated and ER lumenal calcium content is decreased following dexamethasone treatment (35). Thus, although IP3R elevation is maximal at 0.01 μm dexamethasone, alterations in calcium homeostasis are more prominent at 0.1 and 1 μm dexamethasone than at 0.01 μm dexamethasone. Also, cell death induction occurred earlier in a higher percentage of cells at dexamethasone concentrations in excess of that required to maximally elevate IP3R levels (Fig. 3D). Hence, there is not a strong correlation between IP3R elevation and disrupted either calcium homeostasis or cell death.
FIGURE 3.
Dose-response relationships between IP3R elevation and calcium alterations and cell death. A, an immunoblot, representative of five separate experiments, demonstrating the elevation of IP3R1 following treatment of WEHI7.2 cells with the indicated concentrations of dexamethasone for 24 h. B, calcium traces demonstrating the dexamethasone (DEX) dose dependence of cytoplasmic calcium elevation and decreased TG-releasable calcium in WEHI7.2 cells treated with the indicated concentrations of dexamethasone for 24 h. Arrows indicate the point of TG addition. Traces are representative of three separate experiments, each performed with duplicate samples. C, cytoplasmic calcium concentration and TG-induced peak calcium elevation in WEHI7.2 cells treated with the indicated concentrations of dexamethasone for 24 h. Error bars represent the mean ± S.E. (n = 3). D, WEHI7.2 cell viability at 24 and 48 h following treatment with the indicated concentrations of dexamethasone. Error bars represent the mean ± S.E. (n = 3). Note that viable cells were not detected at the 48-h time point following treatment with 0.1 and 1 μm dexamethasone.
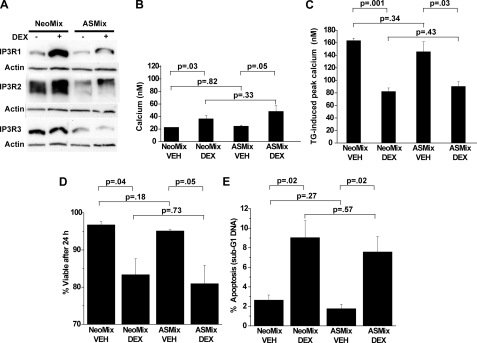
Failure of IP3R Knockdown to Inhibit Calcium Alterations and Apoptosis—Because induction of more than one IP3R isoform was observed, an antisense construct was designed to reduce expression of all three IP3R isoforms. When expressed in WEHI7.2 cells, this antisense construct markedly inhibited dexamethasone-induced IP3R elevation (Fig. 4A) but did not prevent the dexamethasone-induced elevation of cytoplasmic calcium (Fig. 4B) or the decrease in ER calcium content (Fig. 4C). Moreover, knocking down IP3Rs did not prevent dexamethasone-induced loss of cell viability (measured by trypan blue dye exclusion) (Fig. 4D) or apoptosis (measured by flow cytometry) (Fig. 4E).
FIGURE 4.
Antisense RNA-mediated IP3R repression. WEHI7.2 cells were transfected with empty vector (NeoMix) or vector expressing antisense RNA directed toward all three IP3R isoforms (ASMix), and mixed cell populations (i.e. non-clonal) were selected in G418. Cells were treated for 24 h with 0.1 μm dexamethasone prior to the following measurements. A, immunoblot documenting antisense RNA-mediated repression of basal and dexamethasone (DEX)-induced IP3R expression, representative of 10 experiments. B, cytoplasmic calcium concentration. Error bars represent the mean ± S.E. of three separate experiments. C, TG-induced calcium elevation. Error bars represent the mean ± S.E. of three separate experiments. D, cell viability (trypan blue exclusion). Error bars represent the mean ± S.E. of four experiments. E, apoptosis (sub-G1 DNA accumulation). Error bars represent the mean ± S.E. of four experiments. VEH, ethanol vehicle.
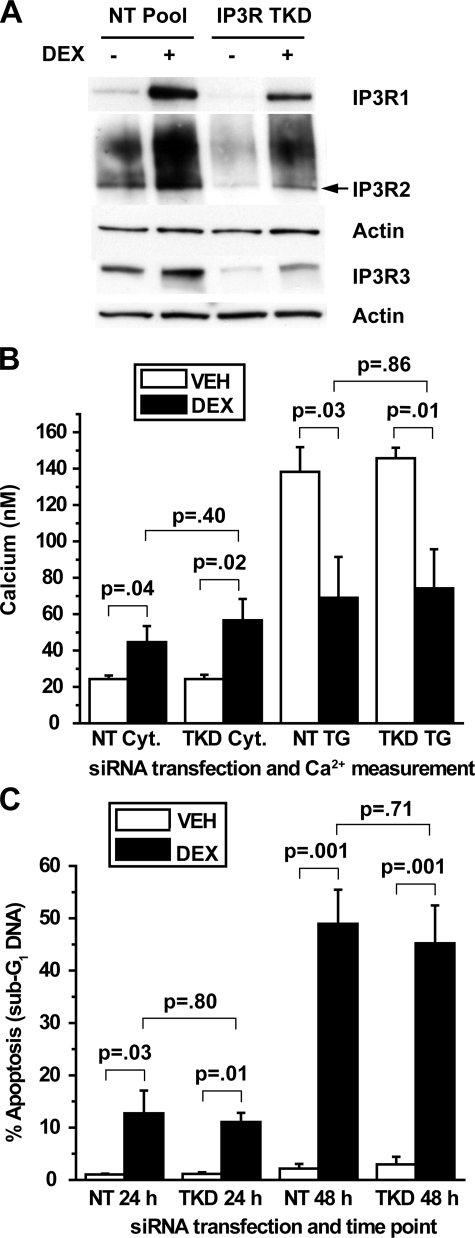
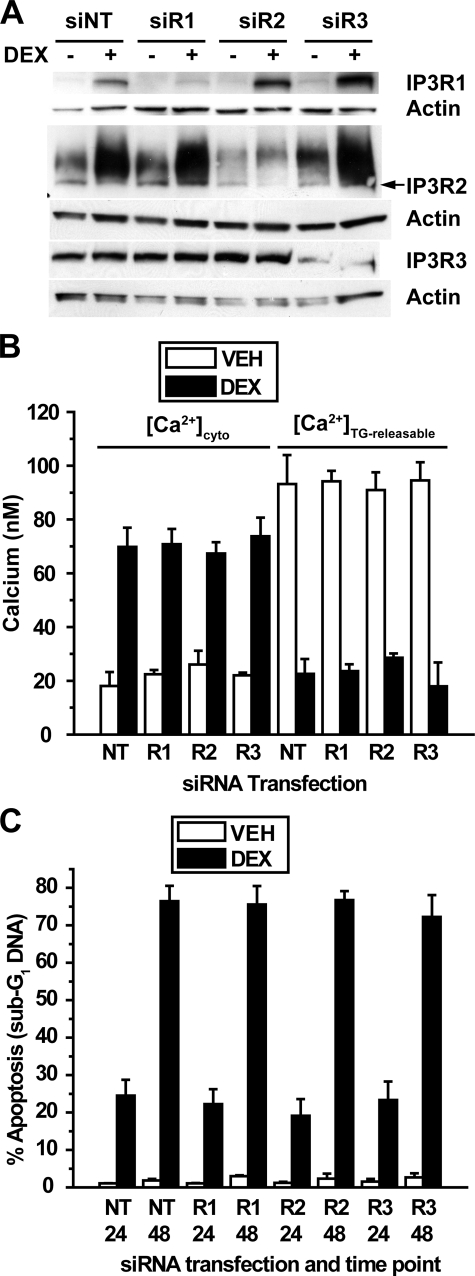
To confirm these findings by an alternative method, siRNA was used to reduce IP3R levels in dexamethasone-treated cells. Extensive preliminary studies using fluorescently labeled siRNA oligonucleotides were performed to optimize siRNA delivery in WEHI7.2 cells (data not shown). Using a pool of siRNA oligonucleotides directed toward all three IP3R subtypes, significant reduction of all three subtypes was achieved both in untreated and dexamethasone-treated cells (Fig. 5A), but this did not prevent dexamethasone-induced calcium alterations (Fig. 5B) or apoptosis (Fig. 5C). When individual IP3R subtypes were targeted by siRNA, the degree of knockdown was even more substantial, although selective knockdown of one IP3R isoform was often associated with a reciprocal elevation of another isoform (Fig. 6A). Individual IP3R isoform knockdown did not have a detectable effect on either dexamethasone-induced calcium alterations (Fig. 6B) or apoptosis (Fig. 6C). Although IP3R knockdown by siRNA was not complete, the degree of knockdown should have been sufficient to at least partially inhibit dexamethasone-induced calcium elevation and apoptosis, but it was not. Thus, these findings, together with the preceding evidence of a lack of correlation between IP3R elevation and calcium alterations, strongly suggest that IP3R elevation is not required for dexamethasone-induced changes in either calcium homeostasis or apoptosis.
FIGURE 5.
siRNA-mediated repression of all three IP3R isoforms. A, WEHI7.2 cells were transfected with siRNA SMARTpools for all three IP3R isoforms (IP3R TKD, triple knockdown of all three subtypes simultaneously) or a non-targeting SMARTpool (NT Pool) and subsequently treated for 24 h with 100 nm dexamethasone (DEX) or ethanol vehicle. The correct molecular mass band for IP3R2 (∼300 kDa) is the lower, sharper band, as indicated by the arrow. Findings are representative of 13 separate experiments. B, cytosolic (Cyt.) calcium and TG-releasable calcium were quantified in WEHI7.2 cells transfected with SMARTpools for all three IP3R subtypes simultaneously and treated for 24 h with 1 μm dexamethasone or ethanol vehicle (VEH). Error bars represent the mean ± S.E. of four experiments. C, apoptotic sensitivity to dexamethasone was compared between cells transfected with SMARTpools for all three IP3R subtypes simultaneously and cells transfected with a non-targeting SMARTpool. Cells were treated with 100 nm dexamethasone or ethanol vehicle for 24 or 48 h, and apoptosis was measured by flow cytometric quantification of sub-G1 DNA accumulation. Error bars represent the mean ± S.E. of four experiments.
FIGURE 6.
siRNA-mediated repression of individual IP3R isoforms. A, WEHI7.2 cells were transfected with siRNA SMARTpools for IP3R1 (siR1), IP3R2 (siR2), and IP3R3 (siR3) or a non-targeting siRNA SMARTpool (siNT) as a negative control. Cells were treated for 24 h with 100 nm dexamethasone (DEX) or ethanol vehicle. Immunoblots show subtype-specific repression of each subtype. The correct molecular mass band for IP3R2 (∼300 kDa) is the lower, sharper band, as indicated by the arrow. Findings are representative of nine experiments. B, cytosolic calcium and TG-releasable calcium were quantified in cells transfected with SMARTpools for each subtype individually and treated for 24 h with 1 μm dexamethasone or ethanol vehicle (VEH). Error bars represent the mean ± S.E. of three experiments. Each comparison of cytosolic calcium elevation and decreased TG-releasable calcium between dexamethasone-treated and untreated cells was significant (p < 0.01). For dexamethasone-treated cells, each comparison of cytosolic calcium elevation and decreased TG-releasable calcium between non-targeting SMARTpool (NT) and SMARTpools for IP3R1 (R1), IP3R2 (R2), and IP3R3 (R3) was insignificant (p > 0.5). C, apoptotic sensitivity to dexamethasone was measured in cells transfected with SMARTpools for each subtype individually. Cells were treated with 100 nm dexamethasone or ethanol vehicle for 24 or 48 h, and apoptosis was measured by flow cytometric quantification of sub-G1 DNA accumulation. Error bars represent the mean ± S.E. of three experiments. In each comparison the dexamethasone-mediated increase in apoptosis was significant (p < 0.01), but in each case knocking down an individual IP3R subtype failed to inhibit apoptosis (p > 0.5).
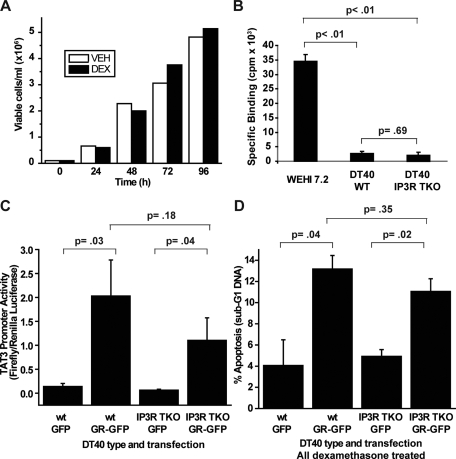
Failure of IP3R Knockout to Inhibit Dexamethasone-induced Apoptosis in DT40 Cells—Because siRNA-mediated IP3R knockdown in the preceding experiments was not complete, one might speculate that the residual complement of IP3Rs following siRNA might be sufficient to mediate calcium elevation in dexamethasone-treated cells. Therefore, a model system in which all three IP3R isoforms are knocked out would theoretically be ideal for investigating the role of IP3Rs in glucocorticoid-induced apoptosis. The only such model system currently available is the chicken DT40 B-cell line in which all three IP3R isoforms have been deleted (33). However, wild-type DT40 cells, which express all three IP3R isoforms, proliferate rapidly without loss of viability in the presence of 1 μm dexamethasone (Fig. 7A). To investigate the mechanism of this glucocorticoid resistance, whole-cell binding assays using [3H]dexamethasone were performed in both DT40 wild-type and IP3R triple-knockout (TKO) cells, comparing the amount of dexamethasone binding to that in WEHI7.2 cells (Fig. 7B). The specific binding of dexamethasone was much lower in DT40 cells compared with WEHI7.2 cells, suggesting either that DT40 cells have a low level of glucocorticoid receptor expression or that their glucocorticoid receptors are defective. Therefore, to resensitize DT40 cells to dexamethasone-induced apoptosis, wild-type and IP3R TKO cells were transiently transfected with a GFP-tagged rat glucocorticoid receptor (GR-GFP). To test whether the transfected receptor was functional in regulating gene expression, Dual-Luciferase reporter assays were conducted. DT40 wild-type and IP3R TKO cells transfected with GR-GFP or the GFP empty vector were cotransfected with the Renilla luciferase control vector phRG-TK and pTAT3-Luc, in which firefly luciferase expression is driven by three tandem glucocorticoid-response elements. Transfected cells were treated with 1 μm dexamethasone for 18 h, and normalized firefly luciferase activity was quantified. Expression of GR-GFP enhanced the TAT3 promoter activity following dexamethasone treatment in both cell lines (Fig. 7C), indicating that the transfected glucocorticoid receptor is functional. Next, to test whether IP3R TKO cells are resistant to dexamethasone-induced apoptosis, DT40 wild-type and IP3R TKO cells, transfected with GR-GFP or GFP, were treated with 1 μm dexamethasone, and sub-G1 DNA was quantified 72 h after treatment. Assessing apoptosis by flow cytometry allowed for the gating on GFP- or GR-GFP-expressing cells, thus limiting the analysis to positive transfectants. There was an increase in sub-G1 DNA in the dexamethasone-treated GR-GFP-expressing cells but not in the GFP alone-expressing cells, indicating that sensitivity to glucocorticoid-induced apoptosis was partially restored by GR-GFP transfection. IP3R TKO cells showed equivalent levels of sub-G1 DNA accumulation to wild-type cells (Fig. 7D), indicating that knockout of all three IP3R subtypes did not protect DT40 B-cells from glucocorticoid-induced apoptosis.
FIGURE 7.
DT40 cells lacking all three IP3R isoforms are not more resistant to dexamethasone-induced apoptosis than wild-type DT40 cells. A, wild-type DT40 cells were treated with (black bars) or without (white bars)1 μm dexamethasone (DEX), and cells were counted 24, 48, 72, and 96 h after treatment. The percentage of viable cells remained ∼100% in both treated and untreated cells at each time point. This experiment is representative of seven independent experiments. VEH, ethanol vehicle. B, a [3H]dexamethasone binding assay was performed on WEHI7.2 cells, wild-type DT40 (WT) cells, and DT40 cells that lacked all three IP3R subtypes (IP3R TKO). Specific binding is expressed in cpm. Error bars represent the mean ± S.E. (n = 3). C, DT40 wild-type cells and IP3R TKO cells were transfected with GFP or GR-GFP, as indicated, as well as the pTAT3-Luc firefly luciferase reporter plasmid and the phRG-TK Renilla luciferase control plasmid. 24 h following transfection, cells were treated with 1μm dexamethasone for 18 h, and Dual-Luciferase reporter assays were performed on the cells. TAT3 promoter activity is expressed as firefly luciferase luminescence divided by Renilla luciferase luminescence. Error bars represent the mean ± S.E. (n = 4). D, DT40 wild-type and IP3R TKO cells were transfected with GFP or GR-GFP, as indicated, and cells were treated with 1 μm dexamethasone. Apoptosis was assessed at 72 h by quantifying sub-G1 DNA accumulation by live cell flow cytometry and gating on GFP-positive cells. Error bars represent the mean ± S.E. (n = 3).
DISCUSSION
IP3Rs are IP3-gated calcium channels located primarily in the ER membrane (24–26). Here they release calcium ions from the ER lumen to the cytoplasm, thus generating calcium signals that regulate a wide range of cellular processes (36). Each IP3R channel is a tetramer of four subunits, and each subunit is composed of three major domains: an amino-terminal IP3-binding domain, a carboxyl-terminal channel-forming domain, and in the middle a regulatory and coupling domain (24–26). The function of IP3Rs is highly regulated by ATP, phosphorylation, and interaction with a variety of accessory proteins (37). The three different IP3R isoforms share considerable sequence homology as well as common gating and conductance properties, although they differ somewhat in terms of their affinities for IP3, ATP, and calcium (24–26). Most cells express all three IP3R isoforms, with the exception of neurons, in which IP3R1 predominates. IP3R expression patterns are dynamically regulated at many levels, including transcription, mRNA stability, translation, protein degradation, and protein trafficking (24, 25).
As described in this work, the unexpected discovery that dexamethasone up-regulates IP3R isoforms 1 and 2 resulted from oligonucleotide microarray analysis intended to identify glucocorticoid-induced genes in two glucocorticoid-sensitive murine T-cell lymphoma lines, WEHI7.2 and S49.A2. The dexamethasone-induced up-regulation of IP3R1 and IP3R2 was highly consistent in numerous experiments performed by several different investigators in our laboratory. Dexamethasone-induced elevation of IP3R3 was to a lesser degree and not as consistent among repeated experiments, although IP3R3 was readily detected in both the WEHI7.2 and S49.A2 cell lines.
To our knowledge, there are only two previous reports regarding regulation of IP3Rs by glucocorticoids. A recent study found that stressing rats by immobilization induced glucocorticoid-dependent elevation of IP3R1 and IP3R2 in cardiac cells (38), whereas an earlier report concluded that dexamethasone selectively up-regulated IP3R3 in lymphocytes while down-regulating IP3R1 and IP3R2 (39). Notably, the latter report employed the S49 murine T-cell line, which was also employed in the work described here. The difference between our current findings and those provided in this earlier report is puzzling, but several potential explanations can be offered. First, although both studies employed derivatives of the S49 cell line, it is possible that these derivatives were actually quite different in their patterns of IP3R expression or their responsiveness to dexamethasone. Second, a more intriguing hypothesis is that patterns of IP3R expression and their regulation by various factors, including glucocorticoids, may vary according to culture conditions. This concept is based in part on experimental evidence that endothelial cells switch from predominantly isoform 1 to isoform 3IP3R expression after several days in culture (40). The third explanation is technical, in that differences in findings may relate to the use of different antibodies having different degrees of specificity in the two studies. In the present study, the elevation of IP3R1 and IP3R2 following dexamethasone treatment was marked, consistent, and confirmed not only using two different antibodies in immunoblots of each isoform but also using Northern hybridization at the mRNA level.
A central question addressed in this study is whether or not the up-regulation of IP3Rs by dexamethasone plays a critical role in mediating dexamethasone-induced apoptosis. It had been concluded previously that IP3R3 induction by dexamethasone is an important step in glucocorticoid-induced apoptosis, based on evidence that antisense RNA-mediated inhibition of IP3R3 elevation prevented glucocorticoid-induced calcium elevation and apoptosis (39). To us this was a very attractive concept, but it is not supported by the experimental findings reported here. First, we did not find a strong correlation between IP3R elevation and either calcium perturbation or apoptosis in terms of either the kinetics or dose-response relationship of these events. Second, knocking down all three IP3R isoforms by antisense RNA or siRNA did not have a detectable effect on dexamethasone-induced calcium alterations or cell death. Although it was reported that antisense RNA-mediated knockdown of IP3R1 inhibits dexamethasone-induced calcium elevation and apoptosis in the Jurkat T-cell line (41), in the present study, knocking down individual IP3R isoforms by siRNA did not inhibit dexamethasone-induced calcium alterations or apoptosis. Our finding is consistent with studies conducted using IP3R1–/– mouse T-cells that found that eliminating IP3R1 does not inhibit glucocorticoid-induced apoptosis (42). Third, the induction of apoptosis by dexamethasone was not inhibited by knocking out expression of all three IP3R isoforms in DT40 cells. Thus, in our view, the question of how glucocorticoid treatment induces disturbances in intracellular calcium homeostasis remains unanswered.
Although the results presented here are “negative” in terms of suggesting that IP3R elevation is not required for dexamethasone-induced apoptosis, they are counterbalanced by “positive” findings in the same cell lines using similar technical approaches. For example, siRNA-mediated reduction of IP3R levels in WEHI7.2 cells did inhibit calcium elevation induced by T-cell receptor activation (43), a process that is clearly mediated through IP3R (reviewed in Ref. 44). Also, gene expression analysis in WEHI7.2 and S49.A2 cells led to the discovery that the pro-apoptotic protein Bim is induced by dexamethasone (15), and siRNA-mediated Bim down-regulation inhibited dexamethasone-induced apoptosis in WEHI7.2 cells,3 consistent with evidence that siRNA-mediated Bim down-regulation inhibits dexamethasone-induced apoptosis in leukemia and lymphoma cell lines (19, 20).
If IP3R elevation is not responsible for dexamethasone-induced alterations in calcium homeostasis, then what is? Maintenance of intracellular calcium homeostasis is a complex process that involves the coordinated action of a variety of calcium pumps and channels, as well as mitochondrial buffering (45, 46). Thus, potentially a number of homeostatic mechanisms may be perturbed by glucocorticoid treatment, thereby altering calcium homeostasis. One possibility is caspase-mediated IP3R cleavage following dexamethasone treatment, causing the IP3R channels to leak calcium from the ER. This theory is based on evidence that caspase-3, activated during apoptosis, cleaves IP3Rs, thereby producing a leaky channel (31, 32). However, dexamethasone-induced calcium alterations in WEHI7.2 cells clearly precede caspase activation, and IP3R cleavage is not detected in dexamethasone-treated cells.4 Another potential mechanism responsible for dexamethasone-induced calcium alterations is oxidative stress, suggested earlier by Fernandez et al. (47). This theory is consistent with evidence that glucocorticoid-induced changes in redox status contribute to glucocorticoid-induced cell death (48). However, reactive oxygen would likely affect the function of multiple proteins involved in maintaining calcium homeostasis; hence, identifying a single target responsible for altered calcium homeostasis in glucocorticoid-treated lymphocytes may prove difficult.
In summary, we report here that the glucocorticoid hormone dexamethasone significantly and reproducibly up-regulates levels of IP3R1 and IP3R2 and, somewhat less consistently, up-regulates IP3R3 in two murine T-cell lines that are commonly employed models of glucocorticoid-induced apoptosis. However, there was not a close correlation, on either a kinetic or dose-response basis, between IP3R up-regulation and dexamethasone-mediated alterations in either intracellular calcium homeostasis or apoptosis, and knocking down IP3R levels did not inhibit dexamethasone-induced alterations in either calcium homeostasis or apoptosis. Although these findings do not exclude a contributing role for disrupted calcium homeostasis in the process of glucocorticoid-induced apoptosis, they raise the question of how these calcium alterations are mediated.
Acknowledgments
We thank George Dubyak, William Schilling, John Mieyal, David Schultz, and Anthony Berdis (Case Western Reserve University) for valuable insights and advice; R. Mike Sramkoski and Tammy Stefan for advice and assistance with flow cytometry; the members of the Distelhorst laboratory for valuable discussion and support; Christina Carleton (Case Western Reserve University) for editing assistance; Suresh Joseph and Jean-François Dufour for IP3R expression vectors; and Richard Wojcikiewicz for antibody to IP3R2.
This work was supported by National Institutes of Health Grants R01 CA042755 (to C. W. D.) and T32 HL07147 (to M. C. D.). The costs of publication of this article were defrayed in part by the payment of page charges. This article must therefore be hereby marked “advertisement” in accordance with 18 U.S.C. Section 1734 solely to indicate this fact.
Footnotes
The abbreviations used are: IP3R, inositol 1,4,5-trisphosphate receptor; GFP, green fluorescent protein; GR, glucocorticoid receptor; ER, endoplasmic reticulum; siRNA, small interfering RNA; PBS, phosphate-buffered saline; TKO, triple-knockout; TG, thapsigargin.
M. H. Malone, M. C. Davis, and C. W. Distelhorst, unpublished data.
M. C. Davis and C. W. Distelhorst, unpublished data.
References
- 1.Rhen, T., and Cidlowski, J. A. (2005) N. Engl. J. Med. 353 1711–1723 [DOI] [PubMed] [Google Scholar]
- 2.Ashwell, J. D., Lu, F. W., and Vacchio, M. S. (2000) Annu. Rev. Immunol. 18 309–345 [DOI] [PubMed] [Google Scholar]
- 3.Jondal, M., Pazirandeh, A., and Okret, S. (2004) Trends Immunol. 25 595–600 [DOI] [PubMed] [Google Scholar]
- 4.Distelhorst, C. W. (2002) Cell Death Differ. 9 6–19 [DOI] [PubMed] [Google Scholar]
- 5.Wyllie, A. H. (1980) Nature 284 555–556 [DOI] [PubMed] [Google Scholar]
- 6.Pui, C. H., and Evans, W. E. (2006) N. Engl. J. Med. 354 166–178 [DOI] [PubMed] [Google Scholar]
- 7.Kumar, R., and Thompson, E. B. (2005) J. Steroid Biochem. Mol. Biol. 94 383–394 [DOI] [PubMed] [Google Scholar]
- 8.Sibley, C. H., and Tompkins, G. M. (1974) Cell 2 213–220 [DOI] [PubMed] [Google Scholar]
- 9.Thompson, E. B., and Harmon, J. M. (1986) Adv. Exp. Med. Biol. 196 111–127 [DOI] [PubMed] [Google Scholar]
- 10.Schmidt, S., Rainer, J., Ploner, C., Presul, E., Riml, S., and Kofler, R. (2004) Cell Death Differ. 11 Suppl. 1, S45-S55 [DOI] [PubMed] [Google Scholar]
- 11.Obexer, P., Certa, U., Kofler, R., and Helmberg, A. (2001) Oncogene 20 4324–4336 [DOI] [PubMed] [Google Scholar]
- 12.Tonko, M., Ausserlechner, M. J., Bernard, D., Helmberg, A., and Kofler, R. (2001) FASEB J. 15 693–699 [DOI] [PubMed] [Google Scholar]
- 13.Chauhan, D., Auclair, D., Robinson, E. K., Hideshima, T., Li, G., Podar, K., Gupta, D., Richardson, P., Schlossman, R. L., Krett, N., Chen, L. B., Munshi, N. C., and Anderson, K. C. (2002) Oncogene 21 1346–1358 [DOI] [PubMed] [Google Scholar]
- 14.Yoshida, N. L., Miyashita, T., U, M., Yamada, M., Reed, J. C., Sugita, Y., and Oshida, T. (2002) Biochem. Biophys. Res. Commun. 293 1254–1261 [DOI] [PubMed] [Google Scholar]
- 15.Wang, Z., Malone, M. H., He, H., McColl, K. S., and Distelhorst, C. W. (2003) J. Biol. Chem. 278 23861–23867 [DOI] [PubMed] [Google Scholar]
- 16.Medh, R. D., Webb, M. S., Miller, A. L., Johnson, B. H., Fofanov, Y., Li, T., Wood, T. G., Luxon, B. A., and Thompson, E. B. (2003) Genomics 81 543–555 [DOI] [PMC free article] [PubMed] [Google Scholar]
- 17.Schmidt, S., Rainer, J., Rimi, S., Ploner, C., Jesacher, S., Achmuller, C., Presul, E., Skvortsov, S., Crazzolara, R., Fiegl, M., Raivio, T., Janne, O. A., Geley, S., Meister, B., and Kofler, R. (2006) Blood 107 2061–2069 [DOI] [PubMed] [Google Scholar]
- 18.Tissing, W. J., den Boer, M. L., Meijerink, J. P., Menezes, R. X., Swagemakers, S., van der Spek, P. J., Sallan, S. E., Armstrong, S. A., and Pieters, R. (2007) Blood 109 3929–3935 [DOI] [PubMed] [Google Scholar]
- 19.Zhang, L., and Insel, P. A. (2004) J. Biol. Chem. 279 20858–20865 [DOI] [PubMed] [Google Scholar]
- 20.Abrams, M. T., Robertson, N. M., Yoon, K., and Wickstrom, E. (2004) J. Biol. Chem. 279 55809–55817 [DOI] [PubMed] [Google Scholar]
- 21.Wang, Z., Malone, M. H., Thomenius, M. J., Zhong, F., Xu, F., and Distelhorst, C. W. (2003) J. Biol. Chem. 278 27053–27058 [DOI] [PubMed] [Google Scholar]
- 22.Malone, M. H., Wang, Z., and Distelhorst, C. W. (2004) J. Biol. Chem. 279 52850–52859 [DOI] [PubMed] [Google Scholar]
- 23.Wang, Z., Rong, Y. P., Malone, M. H., Davis, M. C., Zhong, F., and Distelhorst, C. W. (2006) Oncogene 25 1903–1913 [DOI] [PubMed] [Google Scholar]
- 24.Patel, S., Joseph, S. K., and Thomas, A. P. (1999) Cell Calcium 25 247–264 [DOI] [PubMed] [Google Scholar]
- 25.Taylor, C. W., Genazzani, A. A., and Morris, S. A. (1999) Cell Calcium 26 237–251 [DOI] [PubMed] [Google Scholar]
- 26.Bezprozvanny, I. (2005) Cell Calcium 38 261–272 [DOI] [PubMed] [Google Scholar]
- 27.Joseph, S. K., and Hajnoczky, G. (2007) Apoptosis 12 951–968 [DOI] [PubMed] [Google Scholar]
- 28.Orrenius, S., Zhivotovsky, B., and Nicotera, P. (2003) Nat. Rev. Mol. Cell Biol. 4 552–565 [DOI] [PubMed] [Google Scholar]
- 29.Bootman, M. D., Taylor, C. W., and Berridge, M. J. (1992) J. Biol. Chem. 267 25113–25119 [PubMed] [Google Scholar]
- 30.Boehning, D., Patterson, R. L., Sedaghat, L., Glebova, N. O., Kurosaki, T., and Snyder, S. H. (2003) Nat. Cell Biol. 5 1051–1061 [DOI] [PubMed] [Google Scholar]
- 31.Hirota, J., Furuichi, T., and Mikoshiba, K. (1999) J. Biol. Chem. 274 34433–34437 [DOI] [PubMed] [Google Scholar]
- 32.Assefa, Z., Bultynck, G., Szlufcik, K., Kasri, N. N., Vermassen, E., Goris, J., Missiaen, L., Callewaert, G., Parys, J. B., and De Smedt, H. (2004) J. Biol. Chem. 279 43227–43236 [DOI] [PubMed] [Google Scholar]
- 33.Sugawara, H., Kurosaki, M., Takata, M., and Kurosaki, T. (1997) EMBO J. 16 3078–3088 [DOI] [PMC free article] [PubMed] [Google Scholar]
- 34.Chen, R., Valencia, I., Zhong, F., McColl, K. S., Roderick, H. L., Bootman, M. D., Berridge, M. J., Conway, S. J., Holmes, A. B., Mignery, G. A., Velez, P., and Distelhorst, C. W. (2004) J. Cell Biol. 166 193–203 [DOI] [PMC free article] [PubMed] [Google Scholar]
- 35.Lam, M., Dubyak, G., and Distelhorst, C. W. (1993) Mol. Endocrinol. 7 686–693 [DOI] [PubMed] [Google Scholar]
- 36.Berridge, M. J., Lipp, P., and Bootman, M. D. (2000) Nat. Rev. Mol. Cell Biol. 1 11–21 [DOI] [PubMed] [Google Scholar]
- 37.Roderick, H. L., and Bootman, M. D. (2003) Biochem. Soc. Trans. 31 950–953 [DOI] [PubMed] [Google Scholar]
- 38.Lencesova, L., Ondrias, K., Micutkova, L., Felipenko, M., Kvetnansky, R., and Krizanova, O. (2002) FEBS Lett. 531 432–436 [DOI] [PubMed] [Google Scholar]
- 39.Khan, A. A., Soloski, M. J., Sharp, A. H., Schilling, G., Sabatini, D. M., Li, S.-H., Ross, C. A., and Snyder, S. H. (1996) Science 273 503–507 [DOI] [PubMed] [Google Scholar]
- 40.Mountian, I., Manolopoulos, V. G., De Smedt, H., Parys, J. B., Missiaen, L., and Wuytack, F. (1999) Cell Calcium 25 371–380 [DOI] [PubMed] [Google Scholar]
- 41.Jayaraman, T., and Marks, A. R. (1997) Mol. Cell. Biol. 17 3005–3012 [DOI] [PMC free article] [PubMed] [Google Scholar]
- 42.Hirota, J., Baba, M., Matsumoto, M., Furuichi, T., Takatsu, K., and Mikoshiba, K. (1998) Biochem. J. 333 615–619 [DOI] [PMC free article] [PubMed] [Google Scholar]
- 43.Zhong, F., Davis, M. C., McColl, K. S., and Distelhorst, C. W. (2006) J. Cell Biol. 172 127–137 [DOI] [PMC free article] [PubMed] [Google Scholar]
- 44.Lewis, R. S. (2001) Annu. Rev. Immunol. 19 497–521 [DOI] [PubMed] [Google Scholar]
- 45.Carafoli, E. (2002) Proc. Natl. Acad. Sci. U. S. A. 99 1115–1122 [DOI] [PMC free article] [PubMed] [Google Scholar]
- 46.Berridge, M. J., Bootman, M. D., and Roderick, H. L. (2003) Nat. Rev. Mol. Cell Biol. 4 517–529 [DOI] [PubMed] [Google Scholar]
- 47.Fernandez, A., Kiefer, J., Fosdick, L., and McConkey, D. J. (1995) J. Immunol. 155 5133–5139 [PubMed] [Google Scholar]
- 48.Tome, M. E., Baker, A. F., Powis, G., Payne, C. M., and Briehl, M. M. (2001) Cancer Res. 61 2766–2773 [PubMed] [Google Scholar]


