Abstract
Erythropoietin (Epo) stimulates a significant increase in the intracellular calcium concentration ([Ca2+]i) through activation of the murine transient receptor potential channel TRPC2, but TRPC2 is a pseudogene in humans. TRPC3 expression increases on normal human erythroid progenitors during differentiation. Here, we determined that erythropoietin regulates calcium influx through TRPC3. Epo stimulation of HEK 293T cells transfected with Epo receptor and TRPC3 resulted in a dose-dependent increase in [Ca2+]i, which required extracellular calcium influx. Treatment with the phospholipase C (PLC) inhibitor U-73122 or down-regulation of PLCγ1 by RNA interference inhibited the Epo-stimulated increase in [Ca2+]i in TRPC3-transfected HEK 293T cells and in primary human erythroid precursors, demonstrating a requirement for PLC. TRPC3 associated with PLCγ, and substitution of predicted PLCγ Src homology 2 binding sites (Y226F, Y555F, Y648F, and Y674F) on TRPC3 reduced the interaction of TRPC3 with PLCγ and inhibited the rise in [Ca2+]i. Substitution of Tyr226 alone with phenylalanine significantly reduced the Epo-stimulated increase in [Ca2+]i but not the association of PLCγ with TRPC3. PLC activation results in production of inositol 1,4,5-trisphosphate (IP3). To determine whether IP3 is involved in Epo activation of TRPC3, TRPC3 mutants were prepared with substitution or deletion of COOH-terminal IP3 receptor (IP3R) binding domains. In cells expressing TRPC3 with mutant IP3R binding sites and Epo receptor, interaction of IP3R with TRPC3 was abolished, and Epo-modulated increase in [Ca2+]i was reduced. Our data demonstrate that Epo modulates TRPC3 activation through a PLCγ-mediated process that requires interaction of PLCγ and IP3R with TRPC3. They also show that TRPC3 Tyr226 is critical in Epo-dependent activation of TRPC3. These data demonstrate a redundancy of TRPC channel activation mechanisms by widely different agonists.
Erythropoietin (Epo)2 is a glycoprotein that is required for proliferation and differentiation of erythroid cells (1, 2). The erythropoietin receptor (Epo-R) is a member of the cytokine receptor superfamily, members of which share many signal transduction pathways (3). Epo has been shown to stimulate a dose-dependent increase in [Ca2+]i that is mediated through a voltage-independent ion channel (4–6). In electrophysiological studies of normal human erythroid progenitor-derived cells, Epo stimulation increased calcium channel mean open time 2.5-fold and open probability 10-fold (5). To identify specific channels activated by erythropoietin, members of the transient receptor potential (TRP) protein superfamily were studied, because these channels have characteristics similar to those observed in electrophysiological studies of human erythroblasts (5). We determined that TRPC2, TRPC3, and TRPC6 are expressed on primary erythroid cells and that erythropoietin stimulated calcium influx through murine TRPC2 but not TRPC6 (7–9). Erythropoietin modulated calcium influx through TRPC2 through signaling mechanisms dependent on complex formation between TRPC2, Epo-R, phospholipase Cγ (PLCγ), and the inositol 1,4,5-trisphosphate receptor (IP3R), activation of PLCγ, and interaction of TRPC2 with IP3R (10). However, because TRPC2 is a pseudogene in humans (11), we hypothesized that the function of TRPC2 is provided by a different calcium-permeable channel in human erythroid cells.
Calcium is a universal intracellular second messenger that influences many cell functions and in erythroid cells has an important role in colony growth and in terminal stages of differentiation (6, 12–14). The erythropoietin receptor also has been shown to activate Ca2+ influx in other cell types. In myoblasts, Epo stimulated expansion of the progenitor population during differentiation and an increase in [Ca2+]i dependent on extracellular calcium influx (15). In neuronal cell lines, Epo stimulated an increase in cell viability and an increase in 45Ca2+ uptake (16, 17). Determination of the mechanisms through which the erythropoietin receptor modulates Ca2+ influx is important in understanding regulation of erythroid proliferation and differentiation as well as the role of Epo-R expression in nonerythroid tissues and is likely to be applicable to other cytokine receptor pathways.
The TRP protein superfamily is a diverse group of voltage-independent Ca2+-permeable cation channels expressed on nonexcitable mammalian cells that are related to the archetypal Drosophila TRP (18–21). The TRP superfamily has been divided into six subfamilies. Many members of the TRPC subfamily are activated after stimulation of receptors, and most of these receptors activate different isoforms of PLC (20, 22) Activation of PLC results in hydrolysis of phosphatidylinositol 4,5-bisphosphate to inositol 1,4,5-trisphosphate (IP3) and diacyclglycerol. Several mechanisms of TRPC regulation through PLC-mediated pathways have been proposed. One mechanism is through IP3 interaction with its receptor (IP3R), resulting in release of Ca2+ from the endoplasmic reticulum and depletion of calcium from internal stores, triggering calcium entry across the plasma membrane through TRPC (23). Alternatively, high concentrations of IP3 in the vicinity of IP3R, resulting from close association of IP3R with PLC-coupled receptors, may directly activate IP3R and the associated TRPC, whereas calmodulin binding inhibits TRPC activation (24). Epo stimulation of its receptor induces activation of both PLCγ1 and PLCγ2 (25–27). Because the TRPC subfamily shares a number of activation mechanisms and PLCγ has previously been shown to be involved in modulation of cell surface expression of TRPC3 (28), we explored whether Epo could modulate Ca2+ influx in human erythroid cells through the TRPC family member TRPC3. We determined that TRPC3 is expressed on primary human erythroblasts, that Epo modulates extracellular calcium influx through TRPC3 in a dose-dependent manner, and that PLC activation and interaction with TRPC3 are required. TRPC3 with substitutions of predicted PLCγ SH2 binding sites (Tyr226, Tyr555, Tyr648, and Tyr674) showed decreased association with PLCγ. In contrast, substitution of TRPC3 Tyr226 was sufficient to reduce Epo-modulated calcium influx but not PLCγ/TRPC3 interaction. Epo failed to stimulate a significant increase in [Ca2+]i through TRPC3 with mutations of IP3R binding sites, demonstrating that downstream of PLCγ activation, IP3R interaction with TRPC3 is required in Epo-induced calcium influx.
EXPERIMENTAL PROCEDURES
Tissues and Cell Lines—Human embryonic kidney (HEK) 293T cells were cultured in Dulbecco's modified Eagle's medium with 10% fetal calf serum. UT-7 cells were cultured in minimal essential medium with 10% fetal calf serum and 0.5 units/ml erythropoietin (Amgen, Thousand Oaks, CA). TF-1 cells were cultured in RPMI 1640 medium with 10% fetal calf serum with 5 units/ml Epo (Amgen) or 1–2 ng/ml granulocyte-macrophage colony-stimulating factor (29). Peripheral blood from volunteer donors was obtained under protocols approved by the institution's institutional review board. Human erythroid precursors were obtained from cultures of peripheral blood progenitors (BFU-E) using two methods. 1) Human BFU-E-derived erythroblasts were harvested from methyl-cellulose culture at days 10 and 14 as previously described (30). 2) Human erythroid progenitors/precursors were cultured using a two-phase liquid culture system (31, 32). Cells harvested at day 8 of Phase II were predominantly proerythroblasts and basophilic normoblasts. CD34+ cells were purchased from AllCells, LLC (Emeryville, CA).
Transfection of Human TRPC3 and Epo-R into HEK 293T Cells—Human TRPC3 (gift of Dr. Lutz Birnbaumer) and human TRPC3 with mutations of the PLCγ SH2 or IP3R binding site were subcloned into pQBI50 (QBiogene, Carlsbad, CA) or pcDNA 3.1/V5-His (Invitrogen). HEK 293T cells at 50–70% confluence were transfected with these vectors and/or pTracer-CMV expressing Epo-R using Lipofectamine Plus (Invitrogen) or Lipofectamine 2000 in accordance with the manufacturer's recommended protocols. HEK 293T cells were routinely studied 48 h after transfection.
Measurement of [Ca2+]i with Digital Video Imaging—HEK 293T cells were transfected with empty pQBI50 vector, pQBI50 vector expressing wild type or mutant TRPC3, and pTracer-CMV expressing Epo-R. In some experiments, PLCγ was down-modulated with small interfering RNA (siRNA) (see below). Successful transfection of individual HEK 293T cells with pQBI50 vectors was verified by detection of BFP (excitation, 380 nm; emission, 435 nm) and transfection of pTracer-CMV by detection of green fluorescent protein (excitation, 478 nm; emission, 535 nm) with our fluorescence microscopy-coupled digital video imaging system (5, 33). To study changes in [Ca2+]i in transfected cells, we were not able to use Fura-2 as the detection fluorophore, because its excitation and emission wavelengths overlap with green fluorescent protein. Instead, we used the fluorescent indicator Fura Red (excitation, 440 and 490 nm; emission, 600 nm long pass), a dual wavelength excitation probe (34, 35). At 48 h post-transfection, HEK 293T cells were loaded with 5 μm Fura Red-AM (Molecular Probes, Inc., Eugene, OR) for 20–25 min at 37 °C in the presence of Pluronic F-127. The extracellular buffer routinely contained 0.68 mm CaCl2. Experiments to look at the role of external calcium depletion were performed with the addition of 2 mm EGTA to the extracellular buffer. In some experiments, calcium (3 mm) was added to the medium at 10 min. In other experiments, cells were pretreated during Fura Red loading with active (U-73122, 5 μm; Sigma) or inactive (U-73343) PLCγ inhibitors. HEK 293T cells were then treated with 0–40 units/ml Epo. [Ca2+]i was measured in individual cells at base line and at 5-s to 2-min intervals for 20 min by determining the fluorescence intensity ratio R (F440/F490). The constants Sf2 and Sb2 and the KD′ of Fura Red were calibrated, and Rmin and Rmax were measured for Fura Red as described previously (8). [Ca2+]i was calculated using the formula, [Ca2+]i = KD′((R – Rmin)/(Rmax – R))(Sf2/Sb2).
Primary human erythroblasts were removed from methylcellulose culture of peripheral blood BFU-E at day 10, adhered to fibronectin-coated glass coverslips, and loaded with Fura Red for experiments to measure [Ca2+]i.
Immunoblotting and Immunoprecipitation—For Western blotting, whole cell lysates or immunoprecipitates were separated on 8% polyacrylamide gels, followed by transfer to Hybond-C Extra membranes (Amersham Biosciences). Western blotting was performed as previously described (8). Blots were incubated with anti-V5-horseradish peroxidase (HRP) (1:10,000; Invitrogen), anti-Epo-R (SC697; diluted 1:1000; Santa Cruz Biotechnology, Inc., Santa Cruz, CA), anti-PLCγ (1:1000; SC-81; Santa Cruz Biotechnology), anti-IP3R II (1:500; SC 7278; Santa Cruz Biotechnology), anti-actin (1:10,000; Sigma), anti-tubulin (1:10,000; Sigma), or anti-TRPC3 (1:400; Alomone Laboratories, Jerusalem, Israel) antibodies. Blots were washed and incubated with the appropriate HRP-conjugated antibodies (1:2000). ECL was used for detection of signal.
To examine the interaction of TRPC3 with PLCγ, IP3R, or Epo-R, immunoprecipitation was performed. Cells were washed in ice-cold Hanks' balanced salt solution and lysed in buffer (50 mm Tris, pH 7.5, 150 mm NaCl, 1 mm EDTA, 1% Triton X-100) supplemented with Complete protease inhibitor mixture (Roche Applied Science). To determine whether TRPC3 associates with Epo-R, PLCγ, or IP3R, HEK 293T cells were transfected with human TRPC3 (in pcDNA3.1/V5-His), hEpo-R (in pcDNA3), rat PLCγ1 (in pcDNA3), rat IP3R type II (in pcDNA3, gift of G. Mignery) (36), or combinations of these vectors. Protein lysates were incubated with preimmune rabbit serum, anti-V5 (Invitrogen), anti-Epo-R, anti-PLCγ1, or anti-IP3R type II antibodies for 4–6 h at 4 °C. For immunoprecipitation of TRPC3 in human primary cells, a rabbit polyclonal antibody was raised to a human TRPC3 C-terminal peptide, as previously described (37). Protein A/G PLUS-agarose beads (Santa Cruz Biotechnology) were then added for 1–2 h at 4 °C with mixing, and immunoprecipitates were washed three times. Sample buffer (3×) was added to the pellets, and the samples were heated at 60 °C for 30 min. Western blotting was performed as described above, and blots were probed with anti-V5-HRP or anti-Epo-R, anti-PLCγ1, anti-IP3R type II, anti-TRPC3, or anti-actin antibodies, followed by the appropriate HRP-conjugated secondary antibodies and ECL.
Down-regulation of PLCγ with RNA Interference—To reduce endogenous expression of PLCγ, PLCγ1 siRNA reagent (SC-29457; Santa Cruz Biotechnology) targeted to human PLCγ1 (38) was transfected into HEK 293T cells. Nonspecific control siRNA reagent (SC-37007; Santa Cruz Biotechnology) was transfected in control cells. siRNA reagents were transfected using the manufacturer's recommended protocol at a final concentration of 80 pmol/35-mm dish, with Lipofectamine 2000 used as the transfection reagent. Twenty-four hours later, cells were transfected with Epo-R in pTracer-CMV and TRPC3 in pQB150. At 48 h, down-regulation of PLCγ was documented with Western blotting, and cells were used in digital video imaging studies of [Ca2+]i.
Biotinylation of Cell Surface Proteins—HEK 293T cells transfected for 48 h with wild type or mutant V5-tagged TRPC3 and Epo-R were washed three times with ice-cold PBS (pH 8.0). Cells were then incubated for 30 min at 4 °C with 1 mm sulfosuccinimidobiotin (Pierce) (39). The biotinylation reaction was terminated by washing cells three times with PBS containing 100 mm glycine to quench and remove excess biotin. Cells were then lysed, and immunoprecipitation was performed with anti-V5 antibody as described previously (8). Western blotting was performed with lysates or immunoprecipitation pellets, and blots were probed with streptavidin-HRP or anti-V5-HRP antibodies. ECL was used for detection of signal.
RESULTS
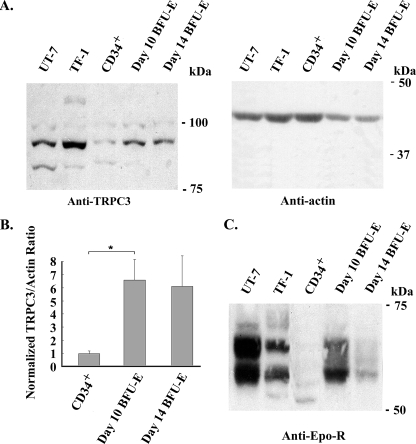
Erythropoietin Stimulates Calcium Influx through TRPC3—To examine whether human erythroid cells express TRPC3 channel protein, we performed Western blotting on lysates from the human Epo-responsive cell lines UT-7 and TF-1. Primary human erythroid cells were also studied at different stages of differentiation, including CD34+ cells (immature hematopoietic progenitors), day 10 BFU-E-derived erythroblasts from methyl-cellulose culture (primarily proerythroblasts and basophilic normoblasts), and day 14 BFU-E-derived erythroblasts (polychromatic and orthochromatic normoblasts). Western blotting demonstrated expression of TRPC3 in all hematopoietic cells, which was also observed by reverse transcription-PCR (not shown). An increase in expression of TRPC3 was seen in primary cells during erythroid differentiation (Fig. 1A). TRPC3 expression at different stages of normal human erythroid differentiation (CD34+, day 10 and day 14 BFU-E-derived erythroblasts) was quantitated with densitometry. These results showed a significant increase in TRPC3 expression relative to actin in day 10 erythroblasts compared with CD34+ cells (Fig. 1B; p < 0.02). Epo-R expression was also examined and peaked in day 10 BFU-E-derived cells (Fig. 1C). The multiple bands observed for endogenous Epo-R probably represent phosphorylated receptor in cells exposed to Epo (1, 2).
FIGURE 1.
Endogenous expression of TRPC3 in human hematopoietic cells. Western blotting was performed on lysates from UT-7 and TF-1 Epo-responsive cell lines, from CD34+ cells and from day 10 and 14 BFU-E-derived erythroblasts. Equivalent amounts of protein were loaded in each lane. A, immunoblotting with anti-TRPC3 antibody demonstrated increased expression of TRPC3 in primary human erythroid cells during erythroid differentiation. Blots were probed with anti-actin antibody to compare loading of lanes. Representative results of four experiments are shown. B, densitometry was used to quantitate TRPC3 and actin bands from four experiments of lysates from CD34+ cells and day 10 and 14 BFU-E-derived erythroblasts. The TRPC3/actin ratio was calculated and normalized to CD34+ cells to allow comparison between experiments, and the mean normalized ratio ± S.E. was determined. TRPC3 expression was significantly less in CD34+ cells than in day 10 erythroblasts (p < 0.02). C, immunoblotting with anti-Epo-R antibody demonstrated greatest Epo-R expression in day 10 primary erythroblasts. Representative results of three experiments are shown.
To investigate the ability of Epo to regulate [Ca2+]i through TRPC channels expressed on human erythroid cells, HEK 293T cells were transfected with Epo-R subcloned into pTracer-CMV and human TRPC3 or TRPC6 subcloned into pQB150. pTracer-CMV contains a CMV promoter utilized to drive expression of Epo-R and an SV40 promoter driving expression of green fluorescent protein. The pQBI50 vector contains a CMV promoter to drive expression of BFP fused to TRPC3 or TRPC6. Endogenous TRPC3 and TRPC6 are expressed at very low levels in HEK 293T cells. Successful transfection of Epo-R was verified by fluorescence microscopy in single cells by detection of green fluorescent protein, and successful transfection of TRPC3 or TRPC6 was confirmed by detection of BFP in the same cells. In HEK 293T cells cotransfected with Epo-R and TRPC3, Epo stimulated a large and sustained increase in [Ca2+]i above base line (242 ± 10%; Table 1), which peaked at 10–20 min. This was significantly greater than that observed in cells transfected with Epo-R alone (107 ± 12%) or in cells cotransfected with Epo-R and TRPC6 (125 ± 14%). The increase in [Ca2+]i in cells expressing Epo-R alone is probably due to Epo-R activation of endogenous channels, which include low levels of TRPC3. The increase in [Ca2+]i in Epo-treated cells cotransfected with Epo-R and TRPC6 was not statistically different from that in cells expressing Epo-R alone, consistent with previous studies (8). These results demonstrate that Epo-R modulates [Ca2+]i through TRPC3 but not TRPC6.
TABLE 1.
Epo stimulation of [Ca2+]i in HEK 293T cells transfected with Epo-R, TRPC3, or TRPC6
Fura Red-loaded HEK 293T cells transfected with BFP-TRPC3 or BFP-TRPC6 and Epo-R were treated with 40 units/ml Epo. [Ca2+]i (mean ± S.E. in nm) was measured at base line, and the peak measurement was obtained after monitoring over 20 min of Epo stimulation (40 units/ml). Percentage increase (% Inc) above base line (mean ± S.E.) = peak [Ca2+]i/base-line [Ca2+]i × 100%, minus 100% (base line). n, number of individual cells studied.
|
Transfection
|
Stimulation
|
[Ca2+]i
|
% Inc
|
n
|
||
|---|---|---|---|---|---|---|
| Base line | Peak | |||||
| nm | % | |||||
| BFP-TRPC3 + Epo-R | PBS | 37 ± 3 | 51 ± 8 | 39 ± 24a | 8 | |
| BFP-TRPC3 | Epo | 33 ± 2 | 60 ± 5 | 82 ± 11a | 22 | |
| BFP-TRPC6 | Epo | 33 ± 2 | 56 ± 4 | 72 ± 10a | 31 | |
| Epo-R | Epo | 32 ± 2 | 65 ± 4 | 107 ± 12a | 18 | |
| BFP-TRPC3 + Epo-R | Epo | 35 ± 1 | 116 ± 3 | 242 ± 10 | 45 | |
| BFP-TRPC6 + Epo-R | Epo | 32 ± 1 | 67 ± 3 | 125 ± 14a | 41 | |
A significant difference from Epo-stimulated cells expressing Epo-R and TRPC3 (p < 0.001).
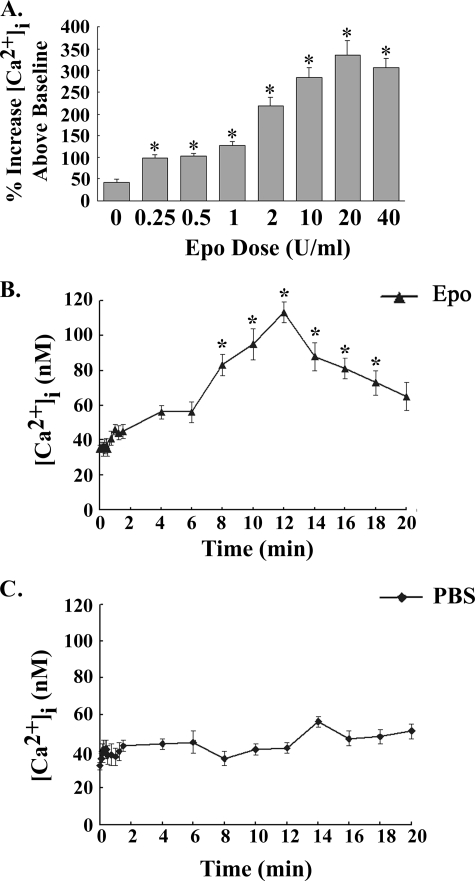
To examine erythropoietin regulation of [Ca2+]i through TRPC3 and TRPC6 (Table 1), an Epo concentration of 40 units/ml was utilized, which is on the plateau for the Epo-stimulated rise in [Ca2+]i in cells expressing TRPC2. To characterize the increase in [Ca2+]i stimulated by Epo through TRPC3, an Epo dose-response curve was generated using HEK 293T cells heterologously expressing TRPC3 and Epo-R. At an Epo concentration of 0.25 units/ml, the peak increase in [Ca2+]i above base line was significantly greater than that of cells treated with diluent (PBS) (Fig. 2A; p < 0.0001). The peak increase in [Ca2+]i plateaued at an Epo dose of 10 units/ml or greater (Fig. 2A). The time course of the rise in [Ca2+]i was then characterized in HEK 293T cells transfected with TRPC3 and Epo-R and stimulated with 40 units/ml Epo or diluent (PBS). [Ca2+]i was measured at base line, at 5-s intervals for the first 30 s, at 15-s intervals for the next minute, and then at 2-min intervals to 20 min to minimize photobleaching. [Ca2+]i did not significantly increase above base line for the first 90 s after Epo stimulation. [Ca2+]i became significantly greater in cells stimulated with Epo compared with PBS starting at 8 min (Fig. 2B; p < 0.0001).
FIGURE 2.
Dose response and time course of [Ca2+]i after Epo stimulation of HEK 293T cells transfected with TRPC3 and Epo-R. A, Epo dose response. HEK 293T cells transfected with TRPC3 and Epo-R were stimulated with 0–40 units/ml Epo. [Ca2+]i was measured at 2–5-min intervals for 20 min. The peak percentage increase of [Ca2+]i above base line was calculated for each cell. Mean ± S.E. of the peak percentage increase above base line at each Epo dose is shown. 13–20 individual cells were studied at each dose in two experiments. *, a significant increase in [Ca2+]i compared with cells treated for 20 min with PBS (p < 0.0001). B and C, time course. HEK 293T cells transfected with TRPC3 and Epo-R were stimulated with 40 units/ml Epo. [Ca2+]i was measured at 5-s intervals for the first 30 s, at 15-s intervals for the next 60 s, and then at 2-min intervals for 20 min after simulation with Epo (B) or PBS (C). Mean ± S.E. [Ca2+]i (nm) of 20 (Epo) or 15 (PBS) cells measured at each time point is shown. *, a significant increase in [Ca2+]i in Epo-treated cells compared with those stimulated with PBS.
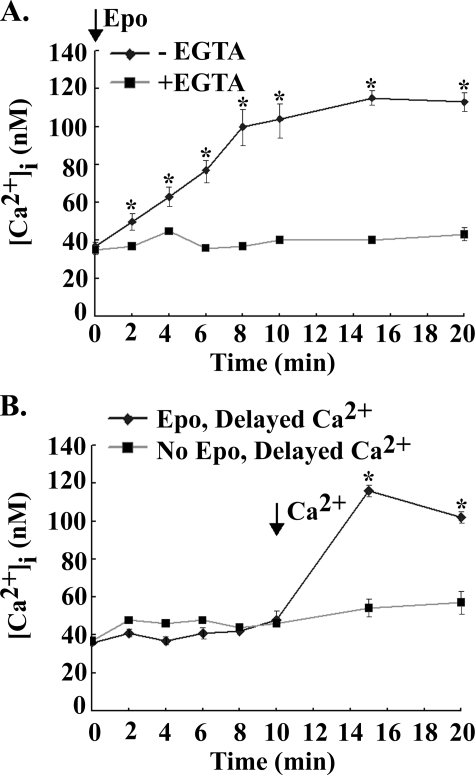
The absence of a significant increase in [Ca2+]i during the first minutes of Epo stimulation (Fig. 2B) suggested that the increase in [Ca2+]i is not due to intracellular calcium release. To examine whether the rise in [Ca2+]i in response to Epo originated primarily from external calcium influx or internal Ca2+ store release, HEK 293T cells transfected with Epo-R and TRPC3 were stimulated by Epo in the presence of extracellular calcium (0.68 mm) or its absence (2 mm EGTA). [Ca2+]i was measured over 20 min in Fura Red-loaded cells (Fig. 3A). A significant increase in [Ca2+]i in Epo-treated cells was not observed in the absence of extracellular calcium, in contrast to the significant increase observed in Epo-treated cells in the presence of extracellular calcium (Fig. 3A, p < 0.01). When CaCl2 (3 mm) was added at 10 min to cells treated with Epo at time 0 in the presence of EGTA, there was a prompt and significant increase in [Ca2+]i (p < 0.02) (Fig. 3B). The increase in [Ca2+]i after the addition of CaCl2 was significantly greater in cells treated with Epo compared with cells not treated with Epo (Fig. 3B, p < 0.0001). These results suggest that Epo activated TRPC3, which remained open so that when extracellular free calcium became available, [Ca2+]i promptly increased.
FIGURE 3.
Requirement for external calcium in the Epo-stimulated calcium increase in HEK 293T cells. Fura Red-loaded HEK 293T cells were transfected with BFP-TRPC3 and Epo-R. A, cells were treated with 40 units/ml Epo in the presence (0.68 mm) or absence (2 mm EGTA) of extracellular calcium. B, cells were treated with or without 40 units/ml Epo in the presence of 2 mm EGTA, and 3 mm CaCl2 was added at 10 min. [Ca2+]i was measured at 2–5-min intervals for 20 min, and the peak percentage increase of [Ca2+]i above base line was calculated for each cell. Mean ± S.E. of the peak percentage increase in [Ca2+]i at different time points is shown. 21–38 individual cells were studied for each condition in two experiments. *, a significant increase in [Ca2+]i compared with cells treated for 20 min with PBS (p < 0.0001).
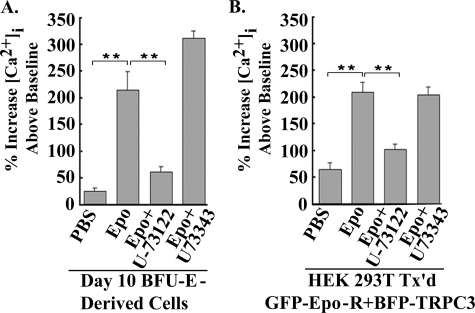
The Epo-modulated Increase in [Ca2+]i through TRPC3 Requires PLCγ Activation—Stimulation of primary human BFU-E-derived erythroblasts with Epo results in a significant increase in [Ca2+]i (5, 40, 41). Epo stimulation of erythroid cells also results in activation of PLCγ1 and -2 (25, 27, 42). To determine whether PLC is involved in the Epo-stimulated increase in [Ca2+]i in primary human erythroid cells, BFU-E-derived erythroblasts were removed from methyl-cellulose culture at day 10, pretreated with the active PLC inhibitor U-73122 or the inactive analog U-73343, loaded with Fura Red, and stimulated with Epo. Pretreatment with U-73122 but not U-73343 significantly inhibited the increase in [Ca2+]i observed in Epo-treated cells, suggesting a role for PLC in Epo-stimulated Ca2+ influx in primary erythroid cells (Fig. 4A; p < 0.0001). To determine specifically whether Epo-stimulated TRPC3 activation required PLC activity, HEK 293T cells transfected with TRPC3 and Epo-R were pretreated with the active PLC inhibitor U-73122 or the inactive analog U-73343 prior to Epo stimulation. The active PLC inhibitor U-73122 significantly blocked the Epo-stimulated increase in [Ca2+]i modulated through TRPC3 (Fig. 4B; p < 0.0001), whereas the inactive analog U-73343 did not, suggesting that Epo regulation of TRPC3 is PLC-dependent.
FIGURE 4.
U-73122 but not U-73343 inhibits the Epo-stimulated rise in [Ca2+]i in primary human erythroblasts and HEK cells. A, day 10 BFU-E-derived cells. BFU-E-derived erythroblasts were removed from methyl-cellulose culture on day 10 and loaded with Fura Red. Where indicated, some cells were pretreated with the active PLC inhibitor U-73122 or the inactive inhibitor U-73343 during Fura Red loading. B, HEK 293T cells transfected with TRPC3 and Epo-R. Transfected HEK 293T cells were pretreated with the active PLC inhibitor U-73122, the inactive inhibitor U-73343, or medium during Fura Red loading. For all experimental groups, base-line [Ca2+]i and the peak percentage increase in [Ca2+]i above base line were calculated for each cell following monitoring at 2-min intervals for 20 min with digital video imaging. Mean ± S.E. of the peak percentage increase for each experimental condition is shown. 7–28 individual cells were studied for each condition in two experiments. **, a significant difference in [Ca2+]i compared with cells treated with Epo (p < 0.0001).
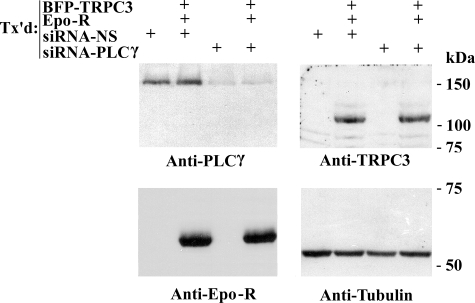
The specific role of PLCγ in Epo activation of TRPC3 was examined using RNA interference targeted to PLCγ. HEK 293T cells were transfected with siRNA targeted to PLCγ or nonspecific control siRNA as well as TRPC3 and Epo-R. The effectiveness of siRNA interference in reducing PLCγ expression was demonstrated by Western blotting. Transfection of HEK 293T cells with siRNA directed to PLCγ resulted in significant suppression of endogenous PLCγ protein, compared with cells transfected with control siRNA (Fig. 5), confirming previous results (10, 38). Expression of TRPC3, Epo-R, and tubulin was not affected in cells transfected with PLCγ siRNA or control siRNA, demonstrating the specificity of the siRNA directed to PLCγ (Fig. 5). In these experiments, the higher molecular mass of TRPC3 (∼125 kDa) compared with endogenous TRPC3 is secondary to linkage of TRPC3 to BFP. The functional consequences of suppression of endogenous PLCγ expression on Epo-induced [Ca2+]i increase through TRPC3 were studied using HEK 293T cells transfected with TRPC3, Epo-R, and either siRNA targeted to PLCγ or nonspecific siRNA. The Epo-stimulated rise in [Ca2+]i through TRPC3 was significantly inhibited in cells in which PLCγ was suppressed (Table 2; p < 0.0001) but not in cells cotransfected with nonspecific siRNA. These data demonstrate that PLCγ plays an important role in the Epo-stimulated rise in [Ca2+]i through TRPC3.
FIGURE 5.
Western blot of HEK 293T cells transfected with siRNA targeted to PLCγ. Lysates were prepared from HEK 293T cells transfected (Tx'd) with or without BFP-TRPC3 and Epo-R, and siRNA was targeted to PLCγ or control siRNA. Blots were probed with anti-PLCγ, anti-TRPC3, anti-Epo-R, and anti-tubulin antibodies, followed by ECL.
TABLE 2.
Inhibition of Epo-stimulated [Ca2+]i increase through TRPC3 by siRNAi targeted to PLCγ
HEK 293T cells were transfected with BFP-TRPC3 and Epo-R, with siRNA targeted to PLCγ or nonspecific control siRNA. Fura Red-loaded cells were treated with 40 units/ml Epo. [Ca2+]i (mean ± S.E. in nm) was measured at base line and by monitoring over 20 min after Epo stimulation. Percentage increase above base line (% Inc) (mean ± S.E.) = peak [Ca2+]i/base-line [Ca2+]i × 100%, minus 100% (base line). n, number of individual cells studied.
|
RNA interference
|
Stimulation
|
[Ca2+]i
|
% Inc
|
n
|
||
|---|---|---|---|---|---|---|
| Base line | Peak | |||||
| nm | % | |||||
| Control | PBS | 37 ± 2 | 55 ± 4 | 51 ± 10a | 11 | |
| Epo | 34 ± 1 | 122 ± 4 | 267 ± 15 | 19 | ||
| PLCγ 1 | PBS | 34 ± 3 | 57 ± 5 | 68 ± 6a | 10 | |
| Epo | 37 ± 1 | 92 ± 3 | 154 ± 7a | 21 | ||
A significant difference from Epo-stimulated cells expressing nonspecific control siRNA (p < 0.0001).
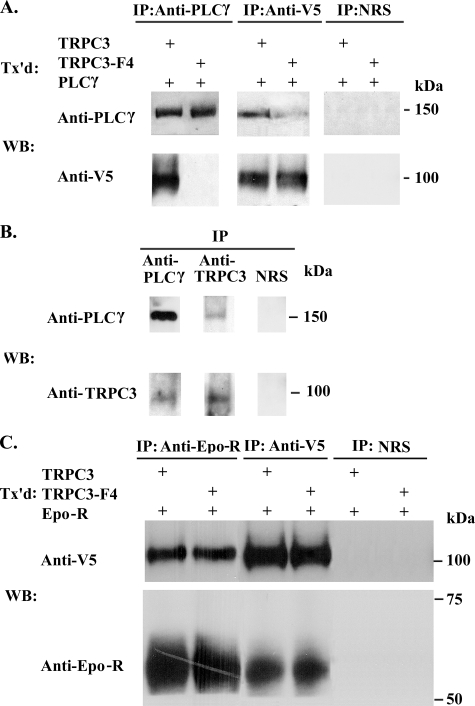
Four binding sites for PLCγ SH2 domains were predicted on TRPC3 (Tyr226 in the N terminus, Tyr555 and Tyr648 in the fourth and sixth transmembrane domains, and Tyr674 in the C terminus; available on the World Wide Web) (43). Two of these are predicted with medium stringency (Tyr226 and Tyr555) and two with low stringency (Tyr648 and Tyr674). The ability of TRPC3 to interact with PLCγ was examined, first using HEK 293T cells transfected with V5-tagged TRPC3 and PLCγ. Epo-R has been reported to interact directly with PLCγ, and in order to focus on the interaction of TRPC3 and PLCγ, Epo-R was not coexpressed. Immunoprecipitation was performed on lysates with anti-PLCγ and anti-V5 antibodies. Western blotting of precipitates demonstrated that anti-V5 antibody immunoprecipitated V5-TRPC3 as well as PLCγ, and anti-PLCγ antibodies reciprocally immunoprecipitated V5-TRPC3 (Fig. 6A). Immunoprecipitation with normal rabbit serum, used as a control for specificity, precipitated neither PLCγ nor V5-TRPC3 (Fig. 6A). To study the physiological relevance of the association of TRPC3 and PLCγ, immunoprecipitation with anti-PLCγ antibody was performed on lysates from primary erythroid cells collected at Phase II day 8 of liquid culture of human peripheral blood mononuclear cells. Anti-PLCγ antibody immunoprecipitated both endogenous PLCγ and TRPC3 (Fig. 6B). Anti-TRPC3 antibody (37) precipitated TRPC3 and PLCγ. In control studies with normal rabbit serum, neither PLCγ nor TRPC3 precipitated (Fig. 6B).
FIGURE 6.
Association of TRPC3 and TRPC3-F4 with PLCγ or Epo-R. A, PLCγ and V5-TRPC3 or V5-TRPC3-F4 were expressed in HEK 293T cells. Immunoprecipitation (IP) was performed on lysates with anti-PLCγ or anti-V5 antibodies or normal rabbit serum (NRS). Western blotting (WB) was performed after immunoprecipitation with anti-PLCγ or anti-V5 antibodies. Representative results of five experiments are shown. B, immunoprecipitation was performed on lysates from primary human erythroid cells at Phase II day 8 of liquid culture with anti-PLCγ or anti-TRPC3 antibodies or normal rabbit serum. Western blotting of eluates was performed with anti-PLCγ or anti-TRPC3 antibodies. C, Epo-R and V5-TRPC3 or V5-TRPC3-F4 were expressed in HEK 293T cells. Immunoprecipitation was performed on lysates with anti-Epo-R or anti-V5 antibodies or normal rabbit serum. Western blotting was performed with anti-Epo-R or anti-V5 antibodies. Representative results of three experiments are shown. Tx'd, transfected.
To determine whether PLCγ and TRPC3 interact through PLCγ SH2 binding sites on TRPC3, four tyrosines (Tyr226, Tyr555, Tyr648, and Tyr674) were mutated to phenylalanine (TRPC3-F4). V5-TRPC3-F4 and PLCγ were expressed in HEK 293T cells, and immunoprecipitation was performed with anti-PLCγ and anti-V5 antibodies. These experiments demonstrated that the interaction of TRPC3 and PLCγ was significantly reduced with the TRPC3-F4 mutant (Figs. 6A and Fig. 7). These data show that PLCγ SH2 binding sites on TRPC3 are important in TRPC3 and PLCγ interaction. We previously showed that Epo-R associated with TRPC2 (10). To determine whether Epo-R also interacts with TRPC3, HEK 293T cells were transfected with Epo-R and V5-TRPC3 or V5-TRPC3-F4. Immunoprecipitation was performed with anti-Epo-R or anti-V5 antibodies or normal rabbit serum. Western blotting of precipitates demonstrated that Epo-R and TRPC3 reciprocally precipitate (Fig. 6C). Neither Epo-R nor TRPC3 precipitated nonspecifically with normal rabbit serum. TRPC3-F4 also precipitated with Epo-R, demonstrating that elimination of TRPC3 PLCγ SH2 binding sites affected TRPC3/PLCγ interaction but not the association of TRPC3 with Epo-R.
FIGURE 7.
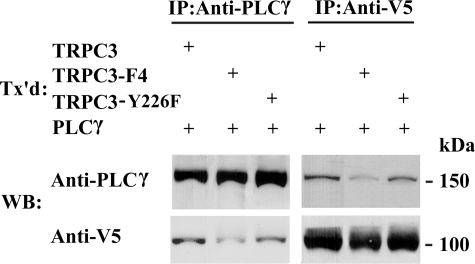
Interaction of TRPC3 with PLCγ SH2 binding site substitutions with PLCγ. PLCγ and V5-TRPC3, V5-TRPC3-F4, or V5-TRPC3-Y226F were expressed in HEK 293T cells. Immunoprecipitation (IP) was performed on lysates with anti-PLCγ or anti-V5 antibodies, followed by Western blotting (WB). Representative results of six experiments are shown. Tx'd, transfected.
To determine whether interaction with PLCγ is important in Epo activation of TRPC3, HEK 293T cells were cotransfected with Epo-R and BFP-TRPC3 or BFP-TRPC3-F4. In cells transfected with Epo-R and TRPC3-F4, the increase in [Ca2+]i observed in response to Epo was significantly reduced (Table 3; p < 0.0001). The percentage increase in [Ca2+]i above base line in cells expressing Epo-R and BFP-TRPC3-F4 was not different from that observed in cells expressing Epo-R alone (Table 1). Western blotting demonstrated that expression of BFP-TRPC3 and BFP-TRPC3-F4 was equivalent, and expression of Epo-R was not affected, indicating that a decrease in TRPC3-F4 or Epo-R expression was not responsible for the reduced rise in [Ca2+]i observed with the TRPC3-F4 mutant (results not shown).
TABLE 3.
Inhibition of Epo-stimulated increase in [Ca2+]i through TRPC3-F4
HEK 293T cells were transfected with BFP-TRPC3, BFP-TRPC3-F4 (Y226F/Y555F/Y648F/Y674F), BFP-TRPC3-Y674F, BFP-TRPC3-Y555F/Y648F, or BFP-TRPC3-Y226F and Epo-R. Fura Red-loaded cells were treated with 40 units/ml Epo. [Ca2+]i (mean ± S.E. in nm) was measured at base line and by monitoring over 20 min after Epo stimulation. Percentage increase (% Inc) above base line (mean ± S.E.) = peak [Ca2+]i/base-line [Ca2+]i × 100%, minus 100% (base line). n, number of individual cells studied.
|
Transfection
|
Stimulation
|
[Ca2+]i
|
% Inc
|
n
|
||
|---|---|---|---|---|---|---|
| Base line | Peak | |||||
| nm | % | |||||
| TRPC3 + Epo-R | PBS | 33 ± 2 | 47 ± 2 | 43 ± 5a | 16 | |
| Epo | 34 ± 1 | 113 ± 4a | 243 ± 15 | 23 | ||
| TRPC3-F4 + Epo-R | PBS | 36 ± 2 | 52 ± 2 | 44 ± 5a | 16 | |
| Epo | 36 ± 1 | 75 ± 3 | 108 ± 6a | 27 | ||
| TRPC3-Y674F + Epo-R | PBS | 30 ± 1 | 43 ± 1 | 43 ± 6a | 6 | |
| Epo | 31 ± 1 | 105 ± 2 | 238 ± 10 | 9 | ||
| TRPC3-Y555F Y648F + Epo-R | PBS | 30 ± 1 | 41 ± 2 | 37 ± 3a | 6 | |
| Epo | 32 ± 1 | 102 ± 3 | 215 ± 10 | 8 | ||
| TRPC3-Y226F + Epo-R | PBS | 32 ± 1 | 45 ± 3 | 41 ± 6a | 6 | |
| Epo | 34 ± 2 | 62 ± 2 | 86 ± 7a | 9 | ||
A significant difference from Epo-stimulated cells expressing wild type TRPC3 (p < 0.0001).
To identify the specific tyrosines required for Epo-modulated calcium influx through TRPC3, individual substitutions of TRPC3-F4 mutant tyrosines (TRPC3-Y674F, TRPC3-Y555F Y648F, and TRPC3-Y226F) were prepared in pQBI50 vectors. HEK 293T cells were cotransfected with Epo-R and BFP-TRPC3, BFP-TRPC3-Y674F, BFP-TRPC3-Y555F Y648F, or BFP-TRPC3-Y226F. In cells transfected with Epo-R and BFP-TRPC3-Y226F, the increase in [Ca2+]i observed in response to Epo was significantly reduced (Table 3; p < 0.0001). In contrast, the Epo-stimulated rise in [Ca2+]i in cells expressing BFP-TRPC3-Y674F or BFP-TRPC3-Y555F/Y648F was not different from wild type BFP-TRPC3. We performed Western blotting on cells transfected to express Epo-R and BFP-TRPC3, BFP-TRPC3-Y674F, BFP-TRPC3-Y555F/Y648F, or BFP-TRPC3-Y226F. Expression of all constructs was similar (not shown).
To determine if TRPC3 binding to PLCγ was reduced in TRPC3 with the single substitution of Y226F, HEK 293T cells were transfected with V5-TRPC3, V5-TRPC3-F4, or V5-TRPC3-Y226F and PLCγ. Immunoprecipitation was performed with anti-PLCγ and anti-V5 antibodies. These experiments demonstrated that the interaction of TRPC3 and PLCγ was significantly reduced with V5-TRPC3-F4 but not with the V5-TRPC3-Y226F mutant (Fig. 7). These data show that TRPC3 Y226 is critical for TRPC3 activation by Epo but not for TRPC3 and PLCγ interaction.
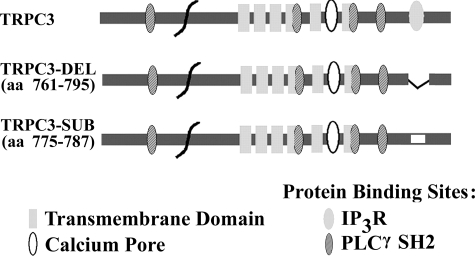
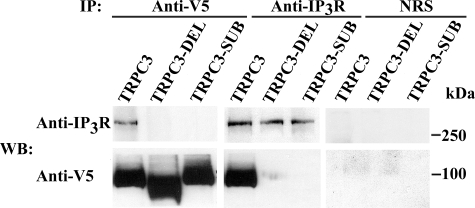
IP3 Receptors Are Involved in Epo Activation of TRPC3—PLC activation results in the production of IP3, and direct interaction of TRPCs with IP3R is a common activation mechanism for TRP channels (24, 44). TRPC3 has a conserved calmodulin/IP3R binding domain (amino acids 761–795), which binds to all IP3R (24). To examine the requirement for IP3R binding to TRPC3 in Epo-modulated Ca2+ influx, we prepared 1) a deletion mutant of the TRPC3 IP3R binding site from amino acids 761–795 (TRPC3-DEL) and 2) a substitution mutant of amino acids 775–787, replacing the sequence YQQIMKRLIKRYV with AQQIAARAAKAAA (TRPC3-SUB) (Fig. 8). To demonstrate that IP3R binding to TRPC3 is abolished with these two mutants, immunoprecipitation was performed on lysates from HEK 293T cells transfected with V5-TRPC3, V5-TRPC3-DEL, or V5-TRPC3-SUB and IP3R type II. Immunoprecipitation was performed with antibodies to V5 or IP3R. Western blotting demonstrated that in HEK cells transfected with wild type V5-TRPC3 and IP3R, TRPC3 and IP3R precipitated reciprocally (Fig. 9). In contrast, IP3R was not precipitated with anti-V5 antibody in cells expressing V5-TRPC3-DEL or V5-TRPC3-SUB; nor was V5-TRPC3-DEL or V5-TRPC3-SUB precipitated by IP3R antibody. The absence of precipitation with normal rabbit serum demonstrated the specificity of results (Fig. 9). These studies confirmed that direct association of IP3R with TRPC3 was abolished in these two mutants.
FIGURE 8.
Schematic model of TRPC3 transmembrane domains and protein binding sites. Predicted transmembrane domains, calcium entry pore, IP3R, and PLCγ SH2 binding sites and deleted and substituted sites in TRPC3-DEL and TRPC3-SUB are shown. aa, amino acids.
FIGURE 9.
Association of TRPC3 IP3R binding mutants with IP3R. IP3R type II and V5-TRPC3, V5-TRPC3-DEL, or V5-TRPC3-SUB were expressed in HEK 293T cells. Immunoprecipitation (IP) was performed on lysates with anti-V5 or anti-IP3R antibodies or normal rabbit serum (NRS). Western blotting (WB) of precipitated protein was performed with anti-IP3R or anti-V5 antibodies. Representative results of three experiments are shown.
To determine whether the association of IP3R with TRPC3 is important in Epo-stimulated Ca2+ influx through TRPC3, HEK 293T cells were transfected with Epo-R and BFP-TRPC3, BFP-TRPC3-DEL, BFP-TRPC3-SUB, or empty pQBI50 vector. In cells transfected with Epo-R and BFP-TRPC3-DEL, the mean percentage increase in [Ca2+]i above base line was 127 ± 5% after Epo stimulation, significantly less than in cells transfected with Epo-R and wild type TRPC3 (percentage increase = 266 ± 12%; Table 4; p < 0.0001). Similarly, the increase in [Ca2+]i seen with BFP-TRPC3-SUB (150 ± 6%) was also significantly less than wild type TRPC3 (p < 0.0001). The [Ca2+]i increase in Epo-stimulated cells expressing Epo-R and BFP-TRPC3-DEL or BFP-TRPC3-SUB was not significantly different from cells expressing empty pQBI50 vector. These data demonstrate a requirement for the TRPC3 IP3R binding domain in the Epo-modulated increase in [Ca2+]i.
TABLE 4.
Epo activation of TRPC3 IP3R binding mutants
HEK 293T cells were transfected with BFP-TRPC3, BFP-TRPC3-DEL, BFP-TRPC3-SUB, or empty pQBI50 vector and Epo-R. Fura Red-loaded cells were treated with 40 units/ml Epo. [Ca2+]i (mean ± S.E. in nm) was measured at base line and by monitoring over 20 min of Epo stimulation. Percentage increase (% Inc) above base line (mean ± S.E.) = peak [Ca2+]i/base-line [Ca2+]i × 100%, minus 100% (base line). n, number of individual cells studied.
|
TRPC3
|
Stimulation
|
[Ca2+]i
|
% Inc
|
n
|
||
|---|---|---|---|---|---|---|
| Base line | Peak | |||||
| nm | % | |||||
| Wild type | PBS | 40 ± 1 | 62 ± 2 | 54 ± 5a | 11 | |
| Epo | 35 ± 1 | 128 ± 4 | 266 ± 12 | 20 | ||
| TRPC3-DEL | Epo | 38 ± 1 | 86 ± 2 | 127 ± 5a | 27 | |
| TRPC3-SUB | Epo | 33 ± 1 | 83 ± 3 | 150 ± 6a | 21 | |
| Empty vector | Epo | 33 ± 2 | 77 ± 5 | 136 ± 15a | 15 | |
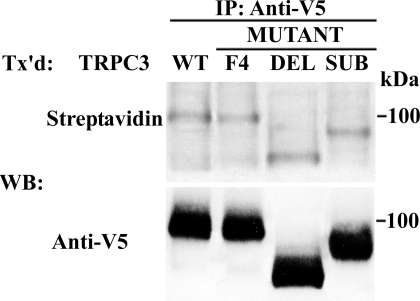
To confirm that mutation of TRPC3 IP3R binding sites did not affect TRPC3 insertion into the plasma membrane, HEK 293T cells were transfected with wild type V5-TRPC3, V5-TRPC3-DEL, or V5-TRPC3-SUB. Externalization of TRPC3 was assessed by biotinylation of cell surface proteins. No significant difference in the cell surface expression of TRPC3 was detectable with biotinylation of TRPC3 IP3R binding site mutants (Fig. 10). The lower molecular weight of V5-TRPC3-DEL is a result of the deletion of 35 amino acids, and the reduced weight of V5-TRPC3-SUB may result from differences in charge densities in the substituted protein. Also, no difference in cell surface expression of TRPC3-F4 was observed (Fig. 10).
FIGURE 10.
Plasma membrane externalization of TRPC3 detected by cell surface biotinylation. Cell surface biotinylation was performed with HEK 293T cells expressing V5-TRPC3, V5-TRPC3-DEL, V5-TRPC3-SUB, or V5-TRPC3-F4 and Epo-R. Lysates were prepared, and immunoprecipitation (IP) was performed with anti-V5 antibody. Western blotting (WB) was performed on immunoprecipitation pellets with streptavidin-HRP to detect biotinylation and anti-V5-HRP to detect total TRPC3. Representative results of two experiments are shown. Tx'd, transfected.
DISCUSSION
Erythropoietin has been reported to stimulate an increase in [Ca2+]i in normal human erythroid cells through a voltage-independent ion channel (4, 5). The identity of the Epo-regulated channel in human erythroid cells was unknown. We previously showed by reverse transcription-PCR and Western blotting that TRPC2 and TRPC6 are expressed in murine erythroblasts and erythroleukemia cell lines and that Epo modulates [Ca2+]i through murine TRPC2 (7, 8). However, TRPC2 is a pseudogene in humans (11). Here, we report the presence of TRPC3 and TRPC6 in primary human erythroid cells and cell lines by Western blotting and reverse transcription-PCR. The major finding of this report is that the TRPC3 channel is regulated by Epo, through a mechanism requiring PLCγ activation and interaction of TRPC3 with PLCγ and IP3R.
The first finding is that TRPC3 is expressed on normal human erythroid precursors and that the level of TRPC3 expression increases during erythroid differentiation. Using HEK 293T cells heterologously expressing TRPC3, we demonstrated that Epo stimulates a dose-dependent increase in [Ca2+]i with a time course similar to the rise in [Ca2+]i observed after Epo stimulation of cells expressing Epo-R and murine TRPC2. This finding suggests that TRPC3 and TRPC2 have a redundant function in Epo signaling in mice and that in human erythroid cells, TRPC3 is a channel through which Epo regulates [Ca2+]i. The Epo-stimulated increase in [Ca2+]i through TRPC3 was slow but sustained. Quantitative fluorescent imaging measures [Ca2+]i, and the rate of the increase in [Ca2+]i is dependent on a number of factors, including rates of Ca2+ influx, rates of Ca2+ efflux (by the plasma membrane Ca2+-ATPase), rates of sequestration by intracellular organelles (endoplasmic reticulum with the Ca2+-ATPase and mitochondria with the Ca2+ uniporter), and rates of Ca2+ leak from intracellular organelles. The rates of [Ca2+]i rise measured by digital video imaging are often slower and the amplitudes smaller when compared with unidirectional Ca2+ influx measured with whole cell current patch clamp. The slow but sustained rise in [Ca2+]i reported here is similar to that which we observed in Epo-stimulated BFU-E-derived cells (41) despite single channel measurements showing increased channel mean open times and open probability with Epo (5).
The mechanisms through which Epo regulates [Ca2+]i through TRPC3 were explored in this study. We examined the importance of PLC activation in Epo-stimulated calcium influx through TRPC3 using three independent approaches: disruption of PLC activity with inhibitors, reduction in PLCγ expression levels with siRNA, and interference with PLCγ binding to TRPC3. All three fundamentally different approaches resulted in significant inhibition of the rise in [Ca2+]i following Epo stimulation. Thus, the second major finding of this report is that PLCγ activity is essential in Epo-stimulated TRPC3 activation and that TRPC3 PLCγ SH2 binding sites are important. Although the lack of complete inhibition of the rise in [Ca2+]i by PLCγ-targeted siRNA probably resulted from incomplete suppression of PLCγ expression (Fig. 5), we cannot eliminate the possibility that other PLC members also expressed on primary erythroid cells and inhibited by U-73122, such as PLCβ family members (45), have a role. The lack of complete elimination of TRPC3 and PLCγ binding with the TRPC3-F4 mutant is consistent with previous observations that other PLCγ binding sites exist on TRPC3 (28).
An important finding is that we identified Tyr226 as an essential tyrosine required in Epo-dependent calcium influx through TRPC3. Previous studies with the muscarinic M5 acetylcholine receptor and the type 1a vasopression receptor (46) have also identified Tyr226 as a critical tyrosine in TRPC3 agonist-dependent activation. Although the function of Tyr226 in TRPC3 activation by Epo is not known, our biotinylation experiments confirmed that Tyr226 is not required for TRPC3 cell surface externalization. We hypothesize that Epo stimulation results in phosphorylation of Tyr226 and potentially other tyrosine residues on TRPC3. The mechanism of TRPC3 phosphorylation by Epo and its functional significance in channel gating are currently under investigation.
PLCγ activation results in production of diacylglycerol and IP3. TRPC3 can be directly activated by diacylglycerol (47–49) or by several mechanisms involving IP3, including calcium store depletion (50–52) or a change in the conformational coupling between the TRPC channel and IP3R after IP3 binding (53, 54). We previously have shown that calcium store release does not appear to play a key role in modulation of [Ca2+]i following Epo activation of TRPC2 (10). As observed with TRPC2, the Epo-stimulated rise in [Ca2+]i in cells expressing TRPC3 did not become significant until after 2 min of Epo stimulation, and the sustained increase in [Ca2+]i was dependent on extracellular calcium entry. Although we could not rule out a local increase of Ca2+ from calcium store release that was effectively buffered, our experiments strongly suggest that the plateau increase in [Ca2+]i observed after Epo stimulation was mediated primarily through Ca2+ influx.
Epo modulates TRPC2 opening through a mechanism requiring PLCγ activation and involving a signaling complex, including Epo-R, TRPC2, PLCγ, and IP3R (10). We confirm here that TRPC3 interacts with IP3R and that this interaction is required in Epo modulation, because when IP3R binding sites on TRPC3 are mutated or deleted, Ca2+ influx in response to Epo is significantly reduced. Our laboratory (4) and others (55) were unable to detect a global rise in IP3 in human erythroid cells in response to erythropoietin stimulation. However, since IP3R and PLCγ both directly interact with TRPC3, a small localized increase in IP3 could be produced near the cell membrane that activates IP3R and TRPC3 but would be difficult to detect using currently available biochemical techniques. A number of mechanisms have been proposed through which IP3R may activate TRPC3, including displacement of inhibitory calmodulin from a common binding domain (24, 56) as well as through interaction with the scaffold protein Homer 1 (53). Our experiments do not rule out a role for diacylglycerol in Epo activation of TRPC3; for other receptors, whether diacyclglycerol- or IP3R-dependent pathways are utilized is dependent on a number of factors, including the level of TRPC3 expression, the cell type, and the presence of interacting proteins (54, 57).
We previously showed that coexpression of TRPC6 with TRPC2 and Epo-R inhibited the increase in [Ca2+]i observed after Epo stimulation of TRPC2 and that TRPC2 and TRPC6 coassociate (9). Here, we confirm that TRPC6 does not respond to Epo stimulation, unlike the homologous TRPC3. Since both TRPC3 and TRPC6 are expressed on normal human erythroid precursors and TRPC3 and TRPC6 are reported to form heterotetramers (37, 58), we hypothesize that another pathway of TRPC3 regulation is the ability of TRPC6 to inhibit TRPC3 activation by Epo when these channels are coexpressed endogenously. Experiments are currently under way to identify the sequence differences between TRPC3 and TRPC6 that explain the different responses and to understand the downstream mechanisms that result in the activation of TRPC3 but not TRPC6 by Epo. Of note, three of the four TRPC3 PLCγ SH2 binding sites were preserved on TRPC6, but the equivalent amino acid to TRPC3 Tyr674 on TRPC6 is substituted with phenylalanine (Phe734). However, this is unlikely to explain the functional differences between TRPC3 and TRPC6, since the mutant channel TRPC3 Y674F showed an Epo-dependent rise in [Ca2+]i that was similar to that observed with wild type TRPC3.
Here, we demonstrate that Epo-R modulates TRPC3 activation through PLCγ utilizing a mechanism requiring complex formation between TRPC3, PLCγ, and Epo-R and TRPC3 and IP3R. Based on data presented here, we hypothesize that Epo stimulation results in activation of PLCγ, which interacts with TRPC3 at multiple sites, including PLCγ SH2 binding domains. Localized production of IP3 binds to IP3R, which associates with TRPC3, leading to a change in the conformation of TRPC3, contributing to channel pore opening. Activation of both TRPC2 and TRPC3 by Epo is an example of several TRP channels sharing similar function and activation by the same agonist, raising questions about how the specificity of response may be regulated. Similarly, Tyr226 is involved in TRPC3 gating following activation of receptors including Epo-R, the muscarinic M5 acetylcholine receptor, and the type 1a vasopression receptor. Some of the specificity of regulation may derive from differences in expression of specific agonist receptors and channels in different cell types and tissues. In human erythroid cells, TRPC3 is the only TRPC expressed that has been shown to be Epo-responsive, and expression of TRPC3 increases during differentiation of primary erythroid cells. No other agonist receptors are thus far known to be expressed that activate TRPC3. It has recently been demonstrated that epidermal growth factor regulates TRPC3 trafficking to the plasma membrane and that the mechanism may involve prevention of reinternalization of constitutively cycling channels (59), raising the possibility that Epo may also regulate TRPC3 channel cycling in and out of the plasma membrane. Identification of the mechanisms regulating TRPC3 activation, membrane expression, and physiological function in erythroid cells will further elucidate novel signaling pathways of erythropoietin and may lead to the identification of new approaches for therapeutic intervention in diseases involving abnormal erythropoiesis.
This work was supported by National Institutes of Health Grants R01 DK46778 (to B. A. M.), R01 HL58672 (to J. Y. C.), and R01 HL74854 (to J. Y. C.) and by the Four Diamonds Fund of the Pennsylvania State University College of Medicine and the Canadian Institute for Health Research (to D. L. B.). The costs of publication of this article were defrayed in part by the payment of page charges. This article must therefore be hereby marked “advertisement” in accordance with 18 U.S.C. Section 1734 solely to indicate this fact.
Footnotes
The abbreviations used are: Epo, erythropoietin; Epo-R, Epo receptor; TRP, transient receptor potential; PLCγ, phospholipase Cγ; IP3, inositol 1,4,5-trisphosphate; IP3R, IP3 receptor(s); SH2, Src homology 2; HEK, human embryonic kidney; siRNA, small interfering RNA; HRP, horseradish peroxidase; PBS, phosphate-buffered saline; CMV, cytomegalovirus.
References
- 1.Richmond, T. D., Chohan, M., and Barber, D. L. (2005) Trends Cell Biol. 15 146–155 [DOI] [PubMed] [Google Scholar]
- 2.Cheung, J. Y., and Miller, B. A. (2001) Nephron 87 215–222 [DOI] [PubMed] [Google Scholar]
- 3.Kaushansky, K. (2006) N. Engl. J. Med. 354 2034–2045 [DOI] [PubMed] [Google Scholar]
- 4.Cheung, J. Y., Elensky, M. B., Brauneis, U., Scaduto, R. C., Jr., Bell, L. L., Tillotson, D. L., and Miller, B. A. (1992) J. Clin. Invest. 90 1850–1856 [DOI] [PMC free article] [PubMed] [Google Scholar]
- 5.Cheung, J. Y., Zhang, X. Q., Bokvist, K., Tillotson, D. L., and Miller, B. A. (1997) Blood 89 92–100 [PubMed] [Google Scholar]
- 6.Gillo, B., Ma, Y. S., and Marks, A. R. (1993) Blood 81 783–792 [PubMed] [Google Scholar]
- 7.Chu, X., Cheung, J. Y., Barber, D. L., Birnbaumer, L., Rothblum, L. I., Conrad, K., Abrasonis, V., Chan, Y. M., Stahl, R., Carey, D. J., and Miller, B. A. (2002) J. Biol. Chem. 277 34375–34382 [DOI] [PubMed] [Google Scholar]
- 8.Chu, X., Tong, Q., Cheung, J. Y., Wozney, J., Conrad, K., Mazack, V., Zhang, W., Stahl, R., Barber, D. L., and Miller, B. A. (2004) J. Biol. Chem. 279 10514–10522 [DOI] [PubMed] [Google Scholar]
- 9.Chu, X., Tong, Q., Wozney, J., Zhang, W., Cheung, J. Y., Conrad, K., Mazack, V., Stahl, R., Barber, D. L., and Miller, B. A. (2005) Cell Calcium 37 173–182 [DOI] [PubMed] [Google Scholar]
- 10.Tong, Q., Chu, X., Cheung, J. Y., Conrad, K., Stahl, R., Barber, D. L., Mignery, G., and Miller, B. A. (2004) Am. J. Physiol. 287 C1667–C1678 [DOI] [PubMed] [Google Scholar]
- 11.Vannier, B., Peyton, M., Boulay, G., Brown, D., Qin, N., Jiang, M., Zhu, X., and Birnbaumer, L. (1999) Proc. Natl. Acad. Sci. U. S. A. 96 2060–2064 [DOI] [PMC free article] [PubMed] [Google Scholar]
- 12.Misiti, J., and Spivak, J. L. (1979) J. Clin. Invest. 64 1573–1579 [DOI] [PMC free article] [PubMed] [Google Scholar]
- 13.Hensold, J. O., Dubyak, G., and Housman, D. E. (1991) Blood 77 1362–1370 [PubMed] [Google Scholar]
- 14.Berridge, M. J., Lipp, P., and Bootman, M. D. (2000) Nat. Rev. Mol. Cell. Biol. 1 11–21 [DOI] [PubMed] [Google Scholar]
- 15.Ogilvie, M., Yu, X., Nicolas-Metral, V., Pulido, S. M., Liu, C., Ruegg, U. T., and Noguchi, C. T. (2000) J. Biol. Chem. 275 39754–39761 [DOI] [PubMed] [Google Scholar]
- 16.Masuda, S., Nagao, M., Takahata, K., Konishi, Y., Gallyas, F., Jr., Tabira, T., and Sasaki, R. (1993) J. Biol. Chem. 268 11208–11216 [PubMed] [Google Scholar]
- 17.Ghosh, A., and Greenberg, M. E. (1995) Science 268 239–247 [DOI] [PubMed] [Google Scholar]
- 18.Venkatachalam, K., and Montell, C. (2007) Annu. Rev. Biochem. 76 387–417 [DOI] [PMC free article] [PubMed] [Google Scholar]
- 19.Nilius, B., Owsianik, G., Voets, T., and Peters, J. A. (2007) Physiol. Rev. 87 165–217 [DOI] [PubMed] [Google Scholar]
- 20.Harteneck, C., Plant, T. D., and Schultz, G. (2000) Trends Neurosci. 23 159–166 [DOI] [PubMed] [Google Scholar]
- 21.Clapham, D. E. (2003) Nature 426 517–524 [DOI] [PubMed] [Google Scholar]
- 22.Montell, C., Birnbaumer, L., and Flockerzi, V. (2002) Cell 108 595–598 [DOI] [PubMed] [Google Scholar]
- 23.Montell, C. (2001) Sci. STKE 2001, RE1. [DOI] [PubMed]
- 24.Tang, J., Lin, Y., Zhang, Z., Tikunova, S., Birnbaumer, L., and Zhu, M. X. (2001) J. Biol. Chem. 276 21303–21310 [DOI] [PMC free article] [PubMed] [Google Scholar]
- 25.Boudot, C., Petitfrere, E., Kadri, Z., Chretien, S., Mayeux, P., Haye, B., and Billat, C. (1999) J. Biol. Chem. 274 33966–33972 [DOI] [PubMed] [Google Scholar]
- 26.Marrero, M. B., Venema, R. C., Ma, H., Ling, B. N., and Eaton, D. C. (1998) Kidney Int. 53 1259–1268 [DOI] [PubMed] [Google Scholar]
- 27.Ren, H. Y., Komatsu, N., Shimizu, R., Okada, K., and Miura, Y. (1994) J. Biol. Chem. 269 19633–19638 [PubMed] [Google Scholar]
- 28.van Rossum, D. B., Patterson, R. L., Sharma, S., Barrow, R. K., Kornberg, M., Gill, D. L., and Snyder, S. H. (2005) Nature 434 99–104 [DOI] [PubMed] [Google Scholar]
- 29.Wakao, H., Harada, N., Kitamura, T., Mui, A. L., and Miyajima, A. (1995) EMBO J. 14 2527–2535 [DOI] [PMC free article] [PubMed] [Google Scholar]
- 30.Zhang, M. Y., Harhaj, E. W., Bell, L., Sun, S. C., and Miller, B. A. (1998) Blood 92 1225–1234 [PubMed] [Google Scholar]
- 31.Bony, V., Gane, P., Bailly, P., and Cartron, J. P. (1999) Br. J. Haematol. 107 263–274 [DOI] [PubMed] [Google Scholar]
- 32.Pope, S. H., Fibach, E., Sun, J., Chin, K., and Rodgers, G. P. (2000) Eur. J. Haematol. 64 292–303 [DOI] [PubMed] [Google Scholar]
- 33.Miller, B. A., Barber, D. L., Bell, L. L., Beattie, B. K., Zhang, M. Y., Neel, B. G., Yoakim, M., Rothblum, L. I., and Cheung, J. Y. (1999) J. Biol. Chem. 274 20465–20472 [DOI] [PubMed] [Google Scholar]
- 34.Kurebayashi, N., Harkins, A. B., and Baylor, S. M. (1993) Biophys. J. 64 1934–1960 [DOI] [PMC free article] [PubMed] [Google Scholar]
- 35.Wu, Y., and Clusin, W. T. (1997) Am. J. Physiol. 273 H2161–H2169 [DOI] [PubMed] [Google Scholar]
- 36.Ramos-Franco, J., Bare, D., Caenepeel, S., Nani, A., Fill, M., and Mignery, G. (2000) Biophys. J. 79 1388–1399 [DOI] [PMC free article] [PubMed] [Google Scholar]
- 37.Goel, M., Sinkins, W. G., and Schilling, W. P. (2002) J. Biol. Chem. 277 48303–48310 [DOI] [PubMed] [Google Scholar]
- 38.Kwon, Y. K., Jang, H. J., Kole, S., He, H. J., and Bernier, M. (2003) J. Cell Biol. 163 375–384 [DOI] [PMC free article] [PubMed] [Google Scholar]
- 39.Cayouette, S., Lussier, M. P., Mathieu, E. L., Bousquet, S. M., and Boulay, G. (2004) J. Biol. Chem. 279 7241–7246 [DOI] [PubMed] [Google Scholar]
- 40.Miller, B. A., Scaduto, R. C., Jr., Tillotson, D. L., Botti, J. J., and Cheung, J. Y. (1988) J. Clin. Invest. 82 309–315 [DOI] [PMC free article] [PubMed] [Google Scholar]
- 41.Miller, B. A., Cheung, J. Y., Tillotson, D. L., Hope, S. M., and Scaduto, R. C., Jr. (1989) Blood 73 1188–1194 [PubMed] [Google Scholar]
- 42.Liao, H. J., Kume, T., McKay, C., Xu, M. J., Ihle, J. N., and Carpenter, G. (2002) J. Biol. Chem. 277 9335–9341 [DOI] [PubMed] [Google Scholar]
- 43.Obenauer, J. C., Cantley, L. C., and Yaffe, M. B. (2003) Nucleic Acids Res. 31 3635–3641 [DOI] [PMC free article] [PubMed] [Google Scholar]
- 44.Boulay, G., Brown, D. M., Qin, N., Jiang, M., Dietrich, A., Zhu, M. X., Chen, Z., Birnbaumer, M., Mikoshiba, K., and Birnbaumer, L. (1999) Proc. Natl. Acad. Sci. U. S. A. 96 14955–14960 [DOI] [PMC free article] [PubMed] [Google Scholar]
- 45.di Giacomo, V., Matteucci, A., Stellacci, E., Battistini, A., Di Baldassarre, A., Capitani, S., Alfani, E., Migliaccio, A. R., Cocco, L., and Migliaccio, G. (2005) J. Cell. Physiol. 202 831–838 [DOI] [PubMed] [Google Scholar]
- 46.Kawasaki, B. T., Liao, Y., and Birnbaumer, L. (2006) Proc. Natl. Acad. Sci. U. S. A. 103 335–340 [DOI] [PMC free article] [PubMed] [Google Scholar]
- 47.Liu, X., Singh, B. B., and Ambudkar, I. S. (2003) J. Biol. Chem. 278 11337–11343 [DOI] [PubMed] [Google Scholar]
- 48.Hofmann, T., Obukhov, A. G., Schaefer, M., Harteneck, C., Gudermann, T., and Schultz, G. (1999) Nature 397 259–263 [DOI] [PubMed] [Google Scholar]
- 49.Gudermann, T., Hofmann, T., Mederos y Schnitzler, M., and Dietrich, A. (2004) Novartis Found. Symp. 258 103–118 [PubMed] [Google Scholar]
- 50.Trebak, M., Bird, G. S., McKay, R. R., and Putney, J. W., Jr. (2002) J. Biol. Chem. 277 21617–21623 [DOI] [PubMed] [Google Scholar]
- 51.Kiselyov, K., Xu, X., Mozhayeva, G., Kuo, T., Pessah, I., Mignery, G., Zhu, X., Birnbaumer, L., and Muallem, S. (1998) Nature 396 478–482 [DOI] [PubMed] [Google Scholar]
- 52.Vazquez, G., Lievremont, J. P., St, J. B. G., and Putney, J. W., Jr. (2001) Proc. Natl. Acad. Sci. U. S. A. 98 11777–11782 [DOI] [PMC free article] [PubMed] [Google Scholar]
- 53.Kim, J. Y., Zeng, W., Kiselyov, K., Yuan, J. P., Dehoff, M. H., Mikoshiba, K., Worley, P. F., and Muallem, S. (2006) J. Biol. Chem. 281 32540–32549 [DOI] [PubMed] [Google Scholar]
- 54.Vazquez, G., Wedel, B. J., Trebak, M., St. John Bird, G., and Putney, J. W., Jr. (2003) J. Biol. Chem. 278 21649–21654 [DOI] [PubMed] [Google Scholar]
- 55.Mason-Garcia, M., Clejan, S., Tou, J. S., and Beckman, B. S. (1992) Am. J. Physiol. 262 C1197–C1203 [DOI] [PubMed] [Google Scholar]
- 56.Wedel, B. J., Vazquez, G., McKay, R. R., St. John Bird, G., and Putney, J. W., Jr. (2003) J. Biol. Chem. 278 25758–25765 [DOI] [PubMed] [Google Scholar]
- 57.Dietrich, A., Kalwa, H., Rost, B. R., and Gudermann, T. (2005) Pflugers Arch. 451 72–80 [DOI] [PubMed] [Google Scholar]
- 58.Hofmann, T., Schaefer, M., Schultz, G., and Gudermann, T. (2002) Proc. Natl. Acad. Sci. U. S. A. 99 7461–7466 [DOI] [PMC free article] [PubMed] [Google Scholar]
- 59.Smyth, J. T., Lemonnier, L., Vazquez, G., Bird, G. S., and Putney, J. W., Jr. (2006) J. Biol. Chem. 281 11712–11720 [DOI] [PubMed] [Google Scholar]


