Abstract
Domain hierarchy and closed loops (DHcL) (http://sitron.bccs.uib.no/dhcl/) is a web server that delineates energy hierarchy of protein domain structure and detects domains at different levels of this hierarchy. The server also identifies closed loops and van der Waals locks, which constitute a structural basis for the protein domain hierarchy. The DHcL can be a useful tool for an express analysis of protein structures and their alternative domain decompositions. The user submits a PDB identifier(s) or uploads a 3D protein structure in a PDB format. The results of the analysis are the location of domains at different levels of hierarchy, closed loops, van der Waals locks and their interactive visualization. The server maintains a regularly updated database of domains, closed loop and van der Waals locks for all X-ray structures in PDB. DHcL server is available at: http://sitron.bccs.uib.no/dhcl.
INTRODUCTION
Interest in the connection between protein structure and its stability and function has a long history starting from the Svedberg's ‘multiplicity hypothesis’ (1). The limited proteolysis of proteins (2) was the next step towards an invention of the concept of protein globule as conglomerate of domains: stable, semi-independent and functionally distinct parts (3). Eventually, domain decomposition became a routine in the analysis of newly crystallized proteins and several manual and automatic methods were developed during last 20 years (4). While the human experts disagree in ∼10% of cases, the automatic methods can not reach even this level of performance (5). Most of the current domain assignments are based on structural characteristics, such as Cα–Cα distance maps, the decrease in accessible surface area, the number of intra-/inter-domain contacts (6) all of which are used to estimate compactness of the structure. Compactness-based approaches disregard, however, physical, evolutionary and functional origins of domains. Different physical factors govern domain formation and stabilizing effect of some of them depends on the factors connected with alteration of charge distributions (7). Evolution and protein function contribute their own specificity in domain definition (8).
A hierarchical approach to domain decomposition employs van der Waals model of domains and polymer nature of polypeptide chains, and results in alternative domain decompositions at different levels of energy hierarchy (6,9). To explore energy hierarchy of protein domain structure, it is necessary to start from the analysis of a distribution of van der Waals interaction in a protein globule for the following reasons. Van der Waals interactions is the only energy term for which analytical approximation using distribution of the electron density is possible (10), contrary to other non-bonded interactions (such as hydrogen bonds, ion pairs) stabilizing protein structure. Electrostatic interactions and hydrogen bonds can be shielded by water and counter ions, they can even be a cause of structure destabilization processes as a consequence of variations of pH, hydration or other factors of the environment (7). On the contrary, van der Waals interactions are not shielded at all and occur in every pair of atoms in the structure. It was theoretically shown long before the first protein structure was solved that van der Waals contacts between hydrophobic side chains in the protein core ‘must play a decisive role in the processes of the formation of a globula and in the determination of its final configuration’ (11). The polymer nature of the polypeptide chain returns is another aspect of protein physics invoked in our approach. It was discovered that there is a common basic element of protein structure (12) closed loops (returns of the protein backbone) of nearly standard size 25–30 amino acid residues. It was further shown that closed loops also play a role of elementary units of protein domains (9). The domains consist of one to several such loops, and variety of domain decompositions at different levels of energy hierarchy is a result of regrouping of closed loops (9).
This work presents an automated server, which provides a fast analysis of the hierarchy of protein domain structure, outputs domain decompositions at different levels of this hierarchy and detects closed loops and van der Waals locks. The server helps to analyze alteration of the domain structure and conformational changes. The hierarchical approach to domain decomposition used in the server was recognized as ‘a logical reconciliatory approach that allows the user to choose appropriate level of resolution’ in the recent analysis of domain assignment methods (8).
IMPLEMENTATION
Domain structure and its hierarchy
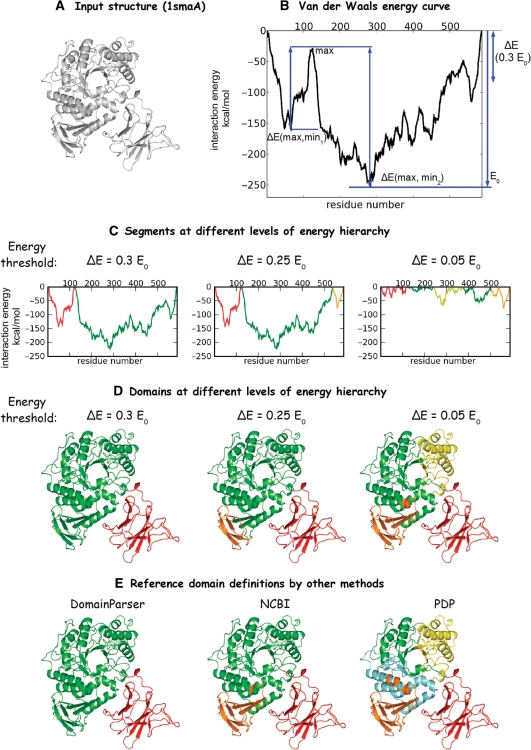
Figure 1 shows major steps in the analysis of the domain hierarchy and the comparison of the server output with those of other methods for the maltogenic amylase (1sma, chain A, Figure 1A). First, van der Waals interaction energies are calculated for contacting atoms, which belong to amino acids separated by at least two residues along the polypeptide chain. Only the contact distances between 2.5 and 5.0 Å are considered, the Lennard-Jones 6–12 potential and the standard Scheraga parameters for different atom types are used (6). Figure 1B contains a van der Waals ‘energy walk’, where every point of the curve is an interaction energy between parts of the globule separated by a given amino acid residue. Thus, van der Waals interaction energy between parts of the native globule can be determined, and its minimal value (E0) can be found (Figure 1B). Second, ‘energy barriers’ 0.3E0 (Figure 1B) 0.25E0, 0.2E0, 0.15E0, 0.1E0, 0.05E0, are set according to the value of E0 (the lowest minimum) on the initial curve. Third, for a given energy barrier maxima and minima on the van der Waals energy curve are analyzed. Any maximum on the curve is considered to be a point of structural separation if the differences between this maximum and neighboring deep minima exceed the value of a chosen barrier (Figure 1B, note that there can be several minima between maximum and minimum, which satisfy the barrier's condition). Points of structural separation split a structure into number of segments corresponding to the level of energy barrier (Figure 1C). Fourth, for each level of energy barrier internal energies of segments (total interaction energy between residues within one and the same segment) and external energies (interaction energy between residues of a particular segment and residues of other segments) are analyzed in order to identify domain structure at this level. If the internal energy of the segment is at least 2.5 times lower than the external one the segment is defined as an independent domain. Any two segments with their internal energies 2.5–1.5 times lower than their external energies are combined in one independent domain if one of the following conditions is satisfied: (i) the interaction energy between these segments is higher than the rest of external interaction energies in each segment, or (ii) more than 0.7 of the external interaction energy of one segment pertains to the interaction with a second segment. Any segment with the internal interaction energy less than 1.5 times lower than the external one is joined with domains/segments with which it has the lowest interaction energy. The procedure results in domains determined for each energy barrier, which delineates energy hierarchy of domain structure for a given protein (Figure 1D). The current implementation of current Domain Hierarchy and closed Loops (DHcL) delineates a domain hierarchy for six energy levels (0.3E0, 0.25E0, 0.2E0, 0.15E0, 0.1E0 and 0.05E0). Additionally, if any large (more than 150 residues) segments exist at 0.05E0 level, the domain structure is also calculated for 0.02E0 level.
Figure 1.
The hierarchy of domain structure in maltogenic amylase (1smaA). (A) The on-plane projection of maltogenic amylase; (B) the initial van der Waals energy curve; (C) decomposition into segments at 0.3E0, 0.25E0 and 0.05E0 energy barrier levels; (D) domain structures obtained at 0.3E0, 0.25E0 and 0.05E0 energy barrier levels; (E) Domain Parser, NCBI and PDP domain decomposition match best to the decompositions at 0.3E0, 0.25E0 and 0.05E0 energy barrier levels in DHcL, respectively.
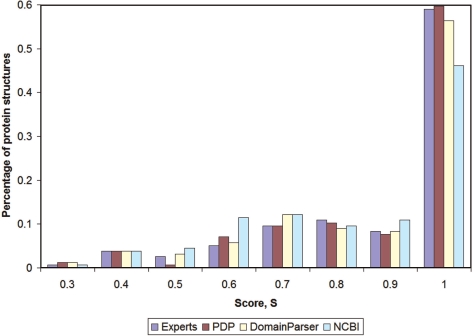
We found alternative domain decompositions at different levels of the energy barrier (hierarchy of domain structure) in many analyzed proteins. Alternatively, some of the structures yield one and the same domain decomposition for all energy levels. The latter case raises a question about comparison of domain decomposition obtained by our approach with other methods. We used our results obtained at the intermediate level of the energy barrier (0.2E0) for the comparison with domain decompositions in the Balanced_Domain_Benchmark_2 [(8), http://pdomains.sdsc.edu/dataset.php]. The histogram in Figure 2 shows that DHcL completely agrees in most of the cases with PDP approach (13) and Experts [a consensus between domain assignments, which involves human expertise, CATH (14), SCOP (15) and authors (8)]. Supplementary Table 1 contains a complete data on domain decompositions at all levels of energy hierarchy. It is important to note, that if there is a hierarchy of domain structure with alternative domain decompositions at different levels, DHcL approach usually reconciles different algorithms of domain partitioning. Examples of structures (in addition to 1sma in Figure 1), where DHcL results at different level of energy hierarchy are similar to the domain decompositions obtained by distinct methods are given in the Supplementary Figures [selection of structures was done based on the Figures 5–10 in ref. (8)].
Figure 2.
Results of the comparison of DHcL domain decompositions at the energy level 0.2E0 with other methods (8).
Closed loops
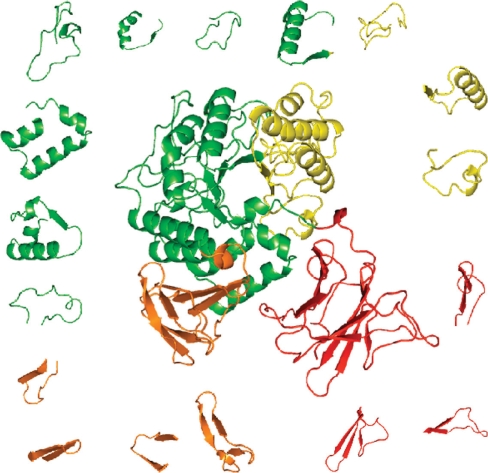
Figure 3 shows an example of closed loop decomposition for maltogenic amylase (1sma, chain A). The closed loops [continuous returns of the protein chain trajectory (12)] are identified in the following five-step procedure. First, Cα–Cα distances for all pairs of residues separated in the protein chain by 15–45 residues are measured. Second, returns of the trajectory with Cα–Cα distances between their ends within the 2.5–12Å interval are selected for further consideration and enumerated. Third step is a mapping of closed loops. It starts from the tightest loops (i.e. returns with the shortest Cα–Cα distances between their ends), and at each iteration sequence region corresponding to the mapped loop is excluded from further consideration. If there is a partial overlap between two loops (more than five amino acid residues) the tighter one is accepted. The mapping ends when the whole sequence is covered by a unique set of tightest loops, and no new loops can be added to improve the sequence's total coverage or all 15–45 residues-long loops with Cα–Cα distances up to 12 Å were considered. Fourth, large loops (more than 39 residues) with surrounding linker regions (noncovered by closed loops parts of the chain) are reconsidered. The procedure checks if combination of relatively tight (Cα–Cα distance up to 4–5Å) shorter loops (up to 30 residues) can provide better coverage of the sequence. Fifth, adjustment of terminal loops is performed. N- and C-terminal loops are extended providing better coverage if: (i) they were not modified in the previous step and (ii) Cα–Cα distance will not exceed 1.15 of the original one. The maximal overlap between loops allowed in all steps of the procedure is five residues.
Figure 3.
Closed loops in maltogenic amylase, 1smaA. The coloring, according to 0.05 domain hierarchy level, demonstrates the correspondence between loops and domains at this hierarchy level. Loops are (starting from top yellow—clockwise): (271–298), (324–353), (356–374), (6–29), (38–58), (83–116), (545–572), (532–546), (520–535), (508–524), (462–483), (426–466), (380–420), (146–177), (175–198), (200–216), (212–244).
Van der Waals locks
The van der Waals lock is defined as a pair of 3- to 5-residue long segments, which have maximal number of contacts between strongly interacting parts of the structures (minimum 100 contact per residue) they belong to. Segments forming van der Waals lock are separated from each other by at least five consecutive residues, which weakly interact with the rest of the structure (less than 40 contacts per residue). Below is the step by step procedure for determining a van der Waals lock. First, a matrix of residue–residue van der Waals contacts [all atom model, distance: 2.5-5Å; (16)] is calculated. Continuous fragments of strongly interacting residues are extracted from the matrix using a minimum cutoff of 100 contacts per residue. A stretch of at least five residues scoring below the threshold (40 contacts per residues) is required to separate neighboring segments. The van der Waals lock is defined for each segment as continuous 3–5 residues, which make maximal number of contacts with continuous 3–5 residues in one of the other segments. The length of the lock (3, 4 or 5 residues) is chosen according to the maximal average number of contacts per pair of residues in the lock.
SERVER: INPUT, OUTPUT AND OPTIONS
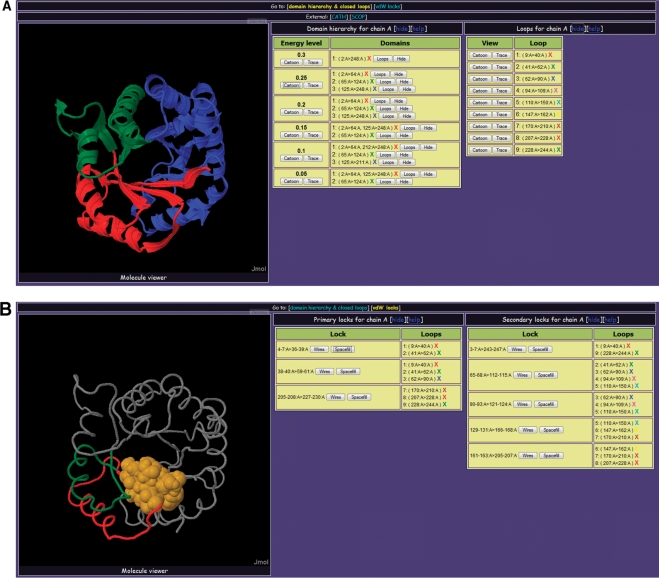
As an input, the server accepts one or several PDB identifiers (separate protein chain can be requested, e.g. 1abcA), a structure file (in PDB format), or the content of the file in PDB format (as pasted text). If user provides a list of PDB IDs (or one ID), the server checks its internal database which contains precalculated and regularly updated data for all X-ray structures in PDB. If DHcL database does not contain data on query structure and user provided valid a PDB identifier, the server provides a link to RCSB PDB page for manual downloading and submission of the structure. If user wants to analyze a structure which is not in DHcL repository yet (by uploading file or pasting its content), the query structure is sent to the processing queue. The page with a task identifier and a status of the job is returned to the user. User can use the job identifier to check the status of a current job (waiting, processing or failed with errors) or to access pages with results and their visualization when computations are completed. User is also suggested to provide and e-mail address, in order to be notified upon the job completion. It is specifically recommended to use an e-mail option for large structures with more than 30 000 atoms. Figure 4 presents typical output of the server. If the query structure has several chains, the report is provided for every chain separately. There are two summary pages for every chain in the structure. User can switch between these pages using links ‘domain hierarchy & closed loops’ and ‘vdW locks’. From any of summary pages user can also return to the main page using a link ‘return to main’. The first page shows the domain hierarchy and closed loops in the whole structure and individual domains (Figure 4A). Cartoon and ribbon-like modes are available for showing domains (accessible by clicking buttons ‘Cartoon’ and ‘Trace’, Figure 4A). The domain structure at a given level of hierarchy (buttons in the ‘Domain hierarchy’ section) or closed loops (buttons in the ‘Loops’ section) can be displayed. Filter options are provided to highlight the decomposition of a particular domain into loops (‘Loops’ button next to the domain coordinates) or hide other domains at a given hierarchy level (‘Hide’ button). The color scheme for individual structural domains/loops is indicated in the ‘X’ signs next to the coordinates of the corresponding domain/loop. There are also links to relevant pages in CATH (14) and SCOP (15) databases, in case of structure files valid PDB identifiers. The second summary page shows primary and secondary van der Waals locks and their location in closed loops (Figure 4B). Primary (located within the loop ends ±5 residues) and secondary (stabilizing contact between different loops and/or linker regions) locks are shown separately in the sections ‘Primary locks’ and ‘Secondary locks’. For each lock, the report lists loops with ends within five residues from the lock. In this section, the entire structure of the protein chain is visualized as ribbon-like trace, and structure of the lock can be displayed in wireframe or filled spheres representation using corresponding buttons. The locks are colored dark orange, and the color scheme for the closed loops which contain these locks is given by ‘X’ signs near the loop coordinates.
Figure 4.
Overview of the DHcL server for domain decomposition at different levels of energy hierarchy and loop-n-lock structure. (A) Domain decomposition at different levels of hierarchy; (B) primary and secondary van der Waals locks.
SERVER: IMPLEMENTATION
The server is implemented in Python, using the open-source Django web framework (http://www.djangoproject.com). Computationally intensive parts of domain hierarchy calculation are written in C++. BioPDB package from BioPython (http://biopython.org) is used to parse PDB structures (17).
Java-based Jmol (http://jmol.sourceforge.net/) software package is used as molecule viewer for visualizing domains at different levels of energy hierarchy, closed loops and van der Waals locks. The example reports shown in Figure 4 (7tim, a triosephosphate isomerase TIM barrel protein) can be also accessed and interacted with via the following link: http://sitron.bccs.uib.no/dhcl/database/single/domains_loops/7tim/chain/A/.
DATABASE: STATISTICS OF THE DOMAIN ASSIGNMENTS
The current internal database of X-ray structures contains results for total 98 403 chains in 40 315 PDB files. Table 1 shows that the same structure partitioning was reached at different levels of energy hierarchy for 35 040 chains, two alternatives were observed for 31 170 chains, three variants of partitioning were found for 21 089 chains, etc. The numbers of protein chains decomposed into one, two or more domains at different level of the energy barrier are shown in Table 2. Comparison with other methods was done for the energy barrier level 0.2E0 using the following formula adapted from ref. (9):
 |
where  is the number of residues assigned to the same domain both by our program and another method or author definition, Ntot is the total number of residues in the protein chain, M is the number of domains under comparison. If the number of domains assigned by our method is not equal to the number of domains assigned by others, then M is the maximal number of domains in the compared assignments.
Table 1.
Number of protein chains with different numbers of domain decomposition at different levels of energy hierarchy
| Number of domain decompositions | 1 | 2 | 3 | 4 | 5 | 6 |
|---|---|---|---|---|---|---|
| Number of chains | 35 040 | 31 170 | 21 089 | 8568 | 2241 | 295 |
Of total 98 403 chains in 40 315 proteins present in the server's database, the 35 040 chains yield identical domain structure at all levels of the potential barrier, 31 170 shows two variants of domain decomposition, etc.
Table 2.
Statistics of protein chains with different number of domains at 0.3E0–0.05E0 levels of the energy barrier
| Energy barrier level | Number of protein chains with | ||||
|---|---|---|---|---|---|
| 1 | 2 | 3 | 4 | 5+ domains | |
| 0.3E0 | 62 631 | 31 337 | 3512 | 634 | 289 |
| 0.25E0 | 54 769 | 37 086 | 5048 | 1006 | 494 |
| 0.2E0 | 47 406 | 41 337 | 7504 | 1409 | 747 |
| 0.15E0 | 42 881 | 42 148 | 9785 | 2437 | 1152 |
| 0.1E0 | 41 123 | 40 004 | 11 823 | 3638 | 1815 |
| 0.05E0 | 37 467 | 34 111 | 16 660 | 6149 | 4016 |
CONCLUSIONS AND OUTLOOK
The energy hierarchy of domains structure establishes a framework for the analysis of a relationship between structurally, functionally and evolutionary distinct parts of protein molecules. It is important to note that the hierarchical approach to domain decomposition is a ‘reconciliatory’ one (8), because it eliminates contradiction between the results of different methods for domain decomposition (Figure 1D and E).
The results of the analysis provided by DHcL server can be used by the researches in the fields as different as biophysics, enzymology, structural biology, bioinformatics, etc. In particular, DHcL output will help for the detecting cooperative units in protein microcalorimetry (18), and for the predicting conformational changes in allosteric regulation and protein function.
SUPPLEMENTARY DATA
Supplementary Data are available at NAR Online.
ACKNOWLEDGEMENTS
This work was supported by the Research Council of Norway through its allocation to the Bioinformatics Technology Platform under the functional genomics program FUGE. Funding to pay the Open Access publication charges for this article was provided by the FUGE project.
Conflict of interest statement. None declared.
REFERENCES
- 1.Svedberg T. Mass and Size of protein molecules. Nature. 1929;123:871. [Google Scholar]
- 2.Porter RR. The hydrolysis of rabbit y-globulin and antibodies with crystalline papain. Biochem. J. 1959;73:119–126. doi: 10.1042/bj0730119. [DOI] [PMC free article] [PubMed] [Google Scholar]
- 3.Richardson JS. The anatomy and taxonomy of protein structure. Adv. Protein Chem. 1981;34:167–339. doi: 10.1016/s0065-3233(08)60520-3. [DOI] [PubMed] [Google Scholar]
- 4.Jones S, Stewart M, Michie A, Swindells MB, Orengo C, Thornton JM. Domain assignment for protein structures using a consensus approach: characterization and analysis. Protein Sci. 1998;7:233–242. doi: 10.1002/pro.5560070202. [DOI] [PMC free article] [PubMed] [Google Scholar]
- 5.Veretnik S, Bourne PE, Alexandrov NN, Shindyalov IN. Toward consistent assignment of structural domains in proteins. J. Mol. Biol. 2004;339:647–678. doi: 10.1016/j.jmb.2004.03.053. [DOI] [PubMed] [Google Scholar]
- 6.Berezovsky IN, Namiot VA, Tumanyan VG, Esipova NG. Hierarchy of the interaction energy distribution in the spatial structure of globular proteins and the problem of domain definition. J. Biomol. Struct. Dyn. 1999;17:133–155. doi: 10.1080/07391102.1999.10508347. [DOI] [PubMed] [Google Scholar]
- 7.Hendsch ZS, Tidor B. Do salt bridges stabilize proteins? A continuum electrostatic analysis. Protein Sci. 1994;3:211–226. doi: 10.1002/pro.5560030206. [DOI] [PMC free article] [PubMed] [Google Scholar]
- 8.Holland TA, Veretnik S, Shindyalov IN, Bourne PE. Partitioning protein structures into domains: why is it so difficult? J. Mol. Biol. 2006;361:562–590. doi: 10.1016/j.jmb.2006.05.060. [DOI] [PubMed] [Google Scholar]
- 9.Berezovsky IN. Discrete structure of van der Waals domains in globular proteins. Protein Eng. 2003;16:161–167. doi: 10.1093/proeng/gzg026. [DOI] [PubMed] [Google Scholar]
- 10.Berezovsky IN, Esipova NG, Tumanyan VG, Namiot VA. A new approach for the calculation of the energy of van der Waals interactions in macromolecules of globular proteins. J. Biomol. Struct. Dyn. 2000;17:799–809. doi: 10.1080/07391102.2000.10506569. [DOI] [PubMed] [Google Scholar]
- 11.Bresler SE, Talmud DL. On the nature of globular proteins. Comptes Rendus de l'Academie des Sciences de l'USSR. 1944;43:310–314. [Google Scholar]
- 12.Berezovsky IN, Grosberg AY, Trifonov EN. Closed loops of nearly standard size: common basic element of protein structure. FEBS Lett. 2000;466:283–286. doi: 10.1016/s0014-5793(00)01091-7. [DOI] [PubMed] [Google Scholar]
- 13.Alexandrov N, Shindyalov I. PDP: protein domain parser. Bioinformatics. 2003;19:429–430. doi: 10.1093/bioinformatics/btg006. [DOI] [PubMed] [Google Scholar]
- 14.Orengo CA, Michie AD, Jones S, Jones DT, Swindells MB, Thornton JM. CATH—a hierarchic classification of protein domain structures. Structure. 1997;5:1093–1108. doi: 10.1016/s0969-2126(97)00260-8. [DOI] [PubMed] [Google Scholar]
- 15.Murzin AG, Brenner SE, Hubbard T, Chothia C. SCOP: a structural classification of proteins database for the investigation of sequences and structures. J. Mol. Biol. 1995;247:536–540. doi: 10.1006/jmbi.1995.0159. [DOI] [PubMed] [Google Scholar]
- 16.Berezovsky IN, Trifonov EN. Van der Waals locks: loop-n-lock structure of globular proteins. J. Mol. Biol. 2001;307:1419–1426. doi: 10.1006/jmbi.2001.4554. [DOI] [PubMed] [Google Scholar]
- 17.Hamelryck T, Manderick B. PDB file parser and structure class implemented in Python. Bioinformatics. 2003;19:2308–2310. doi: 10.1093/bioinformatics/btg299. [DOI] [PubMed] [Google Scholar]
- 18.Protasevich II, Platonov AL, Pavlovsky AG, Esipova NG. Distribution of charges in Bacillus intermedius 7P ribonuclease determines the number of cooperatively melting regions of the globule. J. Biomol. Struct. Dyn. 1987;4:885–893. doi: 10.1080/07391102.1987.10507685. [DOI] [PubMed] [Google Scholar]
Associated Data
This section collects any data citations, data availability statements, or supplementary materials included in this article.


