


Abstract
The gene co-expression analysis toolbox (GeneCAT) introduces several novel microarray data analyzing tools. First, the multigene co-expression analysis, combined with co-expressed gene networks, provides a more powerful data mining technique than standard, single-gene co-expression analysis. Second, the high-throughput Map-O-Matic tool matches co-expression pattern of multiple query genes to genes present in user-defined subdatabases, and can therefore be used for gene mapping in forward genetic screens. Third, Rosetta combines co-expression analysis with BLAST and can be used to find ‘true’ gene orthologs in the plant model organisms Arabidopsis thaliana and Hordeum vulgare (Barley). GeneCAT is equipped with expression data for the model plant A. thaliana, and first to introduce co-expression mining tools for the monocot Barley. GeneCAT is available at http://genecat.mpg.de
INTRODUCTION
The ability to measure the activity of several thousands of genes simultaneously has revolutionized the way we currently view biological processes. Substantial amounts of such expression data that represent experiments from a variety of tissues, developmental stages and stimuli, are currently publicly available for different organisms. Widely used public microarray data repositories are ArrayExpress (1) and Gene Expression Omnibus (GEO). As each microarray experiment often generates large amounts of expression data, it is often difficult for researchers without background in bioinformatics to extract the information they seek. Several web-based tools that analyze collections of publicly available microarray data for the plant model organism Arabidopsis thaliana have therefore been developed including Genevestigator (2), Arabidopsis Co-expression Tool (3), Botany Array Resource (4), CSB.DB (5) and ATTED-II (6). These tools provide comparative gene analyses including cis-element prediction, expression profiling and co-expression analysis. In addition, a tool that combines co-expression and predicted protein–protein interactions has recently been developed (7). It therefore appears that future webtools will combine different types of data to facilitate a more complex and multidimensional view of organisms such as Arabidopsis.
Several studies exploit the fact that genes which are functionally related may be transcriptionally coordinated (8,9). Recent studies have shown that this is also the case in plants (10–13). Consequently, most of the current web-based tools are mainly focused on retrieving expression and/or co-expression patterns for individual genes. We have extended and refined this process and produced several new tools under the banner gene co-expression analysis toolbox (GeneCAT). This platform provides the user with both standard co-expression tools, such as gene clustering and expression profiling, and also includes tools that use multiple bait genes and makes functional inferences across different organisms by combining BLAST and co-expression. GeneCAT is pre-loaded with datasets for two plant model organisms, Arabidopsis and Barley, and dataset from other species can readily be added. To increase the accessibility to the tools we have made GeneCAT accessible via the web (http://genecat.mpg.de).
MATERIALS AND METHODS
Implementation and calculation
GeneCAT is running on Apache server using cgi to link html forms with Python scripts. PhyFi (14) and Graphviz (www.graphviz.org) are used for visualization of ExpressionTree and co-expressed gene network, respectively. Calculations are performed on the fly by Python scripts.
Microarray data sources and processing
Databases for Arabidopsis and Barley use Affymetrix ATH1 (22 810 probe sets) and Barley1 (22 840 probe sets) GeneChips, respectively. Arabidopsis thaliana microarray datasets consisting of 351 RMA normalized ATH1 microarray data were obtained from TAIR (15). Separate A. thaliana tissue atlas dataset of 121 microarrays used for ExpressionProfiling was generated by the AtGenExpress project (16) and obtained from TAIR. For the Barley tissue, atlas 64 MAS5 normalized microarray datasets were obtained from the BarleyBase (17) and was created by (18).
RESULTS AND DISCUSSION
GeneCAT provides expression analyzing tools for two major model organisms in plant biology; Arabidopsis and Barley. To provide an easy introduction to the application of the GeneCAT tools, we present them individually and give biological example for how each tool may be used. A more detailed description of the different tools can be found on http://genecat.mpg.de FAQ section.
Expression profiling and tree view—cellulose synthases
The ExpressionProfiling tool generates line plots of expression profiles across different tissues for specified genes in Arabidopsis and Barley. The ExpressionTree tool uses these data to generate dendrograms corresponding to the tightness of co-expression for the same set of genes. Since tools similar to the ExpressionProfiling tool are also present at other co-expression databases we chose to exemplify only the ExpressionTree tool using the cellulose synthase (CESA) genes in Arabidopsis and Barley. There are 10 and at least 8 members of the CESA families in Arabidopsis and Barley, respectively. The current model for cellulose synthesis proposes that at least three different CESA proteins are assembled into a functional complex (19). Mutant analyses have shown that AtCESA1, 3 and 6, and AtCESA4, 7 and 8 are necessary for primary and secondary cell wall cellulose synthesis in Arabidopsis, respectively (20–23). A similar divergence of the CESA genes is also predicted in Barley (24).
The 10 CESA genes from Arabidopsis were analyzed using the ExpressionTree tool (Supplementary Figure S1A). Two tight clusters were evident; one consisting of AtCESA4, 7 and 8 and the other including AtCESA1, 3 and 6 corresponding to secondary and primary cell wall biosynthesis, respectively (20–23). Interestingly, AtCESA2 and AtCESA5 are tightly associated with the primary cell wall AtCESAs, and have recently been implicated to be functionally redundant to AtCESA6 (22,25). Similar results using co-expression analysis were also obtained by ref. (26). Analogous to Arabidopsis, the expression of the eight Barley HvCESAs create two tight clusters consisting of HvCESA1, 2 and 6, and HvCESA5/7, 4 and 8 (Supplementary Figure S1B), suggesting that these groups of HvCESAs form functional complexes in Barley. These data are consistent with results obtained by q-RT-PCR (24). The high sequence similarity of HvCESA5 and HvCESA7 makes it impossible to distinguish between these homologs (24). This type of analysis may thus provide researchers with a platform to infer functionally related gene products in Arabidopsis and Barley.
Co-expression using multiple bait genes—suberin biosynthesis
Genes that are involved in related processes are often co-expressed (17). Co-expression analyses therefore generally use a bait gene with a known function to target transcriptionally coordinated genes. This approach typically returns a list of genes that appear co-expressed with the bait gene. However, it is difficult to prioritize genes that are most relevant to the process that the bait gene is involved in. It therefore appears that an enrichment of such genes would be highly appreciated by biologists. GeneCAT utilizes two approaches to enrich genes for a given function. First, two or more genes that are involved in functionally related processes may be used as bait genes to more accurately identify target genes. Second, target genes that are true positives should in general also exhibit significant transcriptional coordination to each other, thus forming clusters of co-expressed genes (27). Several other tools provide the opportunity to apply such approaches, but GeneCAT is first to relate network information to the list of co-expressed genes. This process is done in three steps. In the first step an average co-expressed gene list is calculated for the bait genes. In the second step, a co-expressed gene network is created by measuring mutual co-expression ranks between the top 50 genes from the list in a pair-wise manner. Any two nodes (genes) that are connected with bold, normal or dashed lines display mutual ranks smaller than 10, 20 or 50, respectively. Blue nodes indicate bait genes and genes connected to these baits are colored green, orange and red if they are linked to any of the bait genes with bold, normal or dashed lines, respectively. The third step implements the color codes from the network to the co-expressed gene list, thus highlighting genes that exhibit high transcriptional connectivity to the bait genes and other genes in the list.
Since genes that are co-expressed tend to be functionally related, a typical co-expression list includes genes with overlapping annotations. This implies that the gene products may be functionally redundant. Consequently, any phenotypic traits may be masked by functional compensation if one gene is deleted. To identify genes that may be functionally redundant cross-wise BLAST analyses are performed for the top 150 genes in the co-expressed gene list. This analysis may thus give biologists information about functionally redundant genes and therefore candidates for additional mutant analyses.
To illustrate how the co-expression tool works we use a multigene co-expression approach for the suberin biosynthesis pathway from l-phenylalanine at AraCyc (http://www.arabidopsis.org/biocyc/index.jsp) as an example. Suberin is a waxy, polymeric plant cell wall constituent that regulates water transport and protects against pathogen attacks (28). We used one of the genes directly associated with the pathway, OMT1 (At5g54160) as an initial bait gene. Supplementary Table S1 shows that several other genes in the pathway are co-expressed with OMT1 such as PAL1 (At2g37040), PAL2 (At3g53260), C4H (At2g30490) and a caffeoyl-CoA-methyltransferase (At4g34050). To enrich for other genes associated with suberin biosynthesis, we then used these genes together with the OMT1 gene as bait genes for the multiple-bait gene co-expression analysis (Table 1; Figure 1). Several genes that are connected to shikimate, phenylpropanoid and chorismate biosynthesis are among the most highly ranked genes in the table. For example, two genes annotated as 4-coumarate-CoA-ligases (At1g51680 and At3g21240) are among the top-ranked genes (Table 1). These genes convert 4-coumarate into coumaryl-CoA linking the suberin biosynthesis and phenylpropanoid biosynthesis pathways. In addition, the crosswise BLAST analysis of the top 150 genes identified several putative homologs associated with suberin biosynthesis (Supplementary Table S2). These genes may consequently perform similar functions and may be considered as prime candidates for multiple mutant analyses. By using several connected bait genes for a given process it is therefore apparent that functionally associated genes may be enriched.
Table 1.
aCo-expression analysis using multiple bait genes involved in suberin synthesis
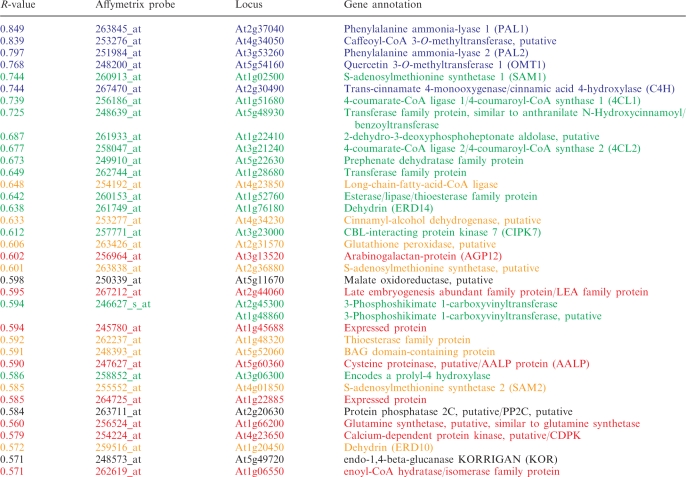 |
Five genes associated with suberin biosynthesis (blue color) were used as bait genes for the co-expression tool at GeneCAT.
aThe table is truncated to comply with the journal format.
Figure 1.

Co-expression network for multiple bait genes involved in suberin biosynthesis. Cropped co-expression network generated by the co-expression tool at GeneCAT using At2g37040, At4g34050, At3g53260, At5g54160 and At2g30490 as bait genes. Blue rectangular nodes indicate the bait genes for the analysis. Green diamonds, orange octagons and red ellipses indicate decreasing strength between node and the bait genes, respectively. Similarly, black, grey and dashed lines indicate decreasing strength between any two nodes.
Forward genetics predictions using Map-O-Matic—photosynthesis
Identification of genes that correspond to phenotypic traits through forward genetic screens is typically time and resource consuming. The Map-O-Matic tool may be used to find genes that are likely to harbor mutations based on phenotypic similarities. The tool uses similar assumptions as regular co-expression approaches, namely, those genes involved in a specific biological process tend to be co-expressed.
To show how the Map-O-Matic tool works (Supplementary Figure S2) we have included an example based on photosynthesis. A mutant that is defective in photosynthesis was identified in Arabidopsis and the mutation was mapped to a genomic region of ∼190 kb (29). This region is predicted to hold 57 genes, of which 49 were included on the ATH1 chip. To assess which of these genes that may be linked to the phenotypic trait we identified 47 genes that are associated with the keyword term ‘*photosystem’. We subsequently compiled a subdatabase using the 47 genes associated with the photosystem search term, and ran cross-wise co-expression analyses between the 49 candidate genes and the 47 photosystem-associated genes using Map-O-Matic. The output from the Map-O-Matic analysis is displayed as a graph with the average co-expression for each of the 49 candidate genes against the 47 photosystem-associated genes (Figure 2). The top 5 genes of the 49 candidate genes are all highly co-expressed with most of the photosystem-associated genes (Figure 2). The gene that corresponded to the phenotypic trait was mapped to At2g01590 (29), which also was the gene that ranked as the most highly co-expressed gene with the photosystem genes of the 49 genes in the region. The gene ranked second in the analysis, At2g01870, is annotated as ‘expressed protein’. Based on its high co-expression with the photosystem genes we suggest that this gene product may also play a direct role in photosynthetic processes. We believe that the Map-O-Matic tool is a powerful way to predict genes that are likely to be involved in specified biological processes.
Figure 2.

Map-O-Matic analysis of a photosynthesis mutant. Forty-nine genes corresponding to a genomic region of ∼190 kb that was mapped for a photosynthetic defect was crosswise compared for co-expression with 47 genes associated with the keyword photosystem. Each of the 49 bait genes on the graph is ranked by average coefficient of correlation across the comparison with the 47 photosystem genes. The bait genes are displayed in descending order from left to right, according to average correlation coefficient (depicted as a black dot). Circle sizes are proportional to fraction of database genes correlating with r-values in given interval to a bait gene. Circles depicting r-values >0.6 are colored red, r < −0.4 are colored blue, while 0.6 > r > −0.4 are colored green.
Combining BLAST and co-expression using Rosetta—cellulose synthases
Orthologs in different species can be inferred through BLAST analyses and sequence comparison. These orthologs are then predicted to perform similar molecular functions in the different organisms. If they do perform similar functions we would also expect that other genes involved in the same process would have corresponding orthologs in the different species. Combining BLAST and co-expression analyses may consequently reveal ‘true’ orthologous processes that are conserved in different organisms.
Plant species typically contain comparatively large gene families (30). This implies that several gene products may perform similar functions in different organs, tissues and/or developmental stages. It may therefore also be relevant to compare co-expression lists between these homologs to investigate functional conservation within a single species.
To demonstrate the application of the Rosetta tool (Supplementary Figure S3), we compared the cellulose synthesis machineries both in Arabidopsis and between Arabidopsis and Barley. Primary cell wall CESA1 and secondary cell wall CESA4 in Arabidopsis were used as bait and target (i.e. Arabidopsis versus Arabidopsis), respectively, for the Rosetta analysis. Using this bait and target, Rosetta identified AtCESA1, AtCESA3, AtCESA6 and AtCESA4, AtCESA7, AtCESA8 as being associated with primary and secondary cell wall synthesis, respectively, based on the individual genes co-expression profiles (Table 2). Present in the co-expression lists were also genes that are common between the two processes. These include COBRA (At5g60920) and CTL1 (At1g05850) and COBRA-like 4 (At5g15630) and CTL2 (At3g16920) that are associated with primary and secondary cellulose synthesis, respectively (Table 2). The COBRA and CTL gene products affect primary and secondary cell wall biosynthesis, although their specific functions are unclear (19). Several other genes, such as glucanases, family 8 glycosyltransferases and arabinogalactan proteins, also appear to have homologs associated with primary and secondary cellulose production, respectively.
Table 2.
aRosetta analysis comparing primary and secondary cellulose biosynthesis in A. thaliana
| Bait: At4g32410 | Target 1: At5g44030 |
|---|---|
| At4g32410 cellulose synthase AtCesA1 | At5g17420 cellulose synthase AtCesA7 |
| At5g64740 cellulose synthase AtCesA6 | At5g44030 cellulose synthase AtCesA4 |
| At5g05170 cellulose synthase AtCesA3 | At4g18780 cellulose synthase AtCesA8 |
| At5g09870 cellulose synthase AtCesA5 | |
| At4g39350 cellulose synthase AtCesA2 | |
| At5g60920 phytochelatin synthetase (COBRA) | At5g15630 COBRA-like 4 |
| At1g05850 chitinase-like protein 1 (CTL1) | At3g16920 CTL2 |
| At5g49720 endo-1, 4-beta-glucanase (KOR) | At1g19940 glycosyl hydrolase family 9 protein |
| At3g23820 NAD-dependent epimerase/dehydratase | At2g28760 NAD-dependent epimerase/dehydratase |
| At5g59290 UDP-glucuronic acid decarboxylase (UXS3) | |
| At4g12880 plastocyanin-like domain-containing protein | At5g26330 plastocyanin-like domain-containing protein |
| At3g27200 plastocyanin-like domain-containing protein | |
| At1g72230 plastocyanin-like domain-containing protein | |
| At1g22480 plastocyanin-like domain-containing protein | |
| At5g03040 calmodulin-binding family protein | At2g33990 similar to calmodulin-binding protein |
| At3g59690 calmodulin-binding family protein | |
| At3g15050 calmodulin-binding family protein | |
| At3g16850″glycoside hydrolase family 28 protein | At3g42950 glycoside hydrolase family 28 protein |
| At1g80170 polygalacturonase, putative | |
| At1g75500 nodulin MtN21 family protein | At3g45870 integral membrane family protein/nodulin |
| At3g15480 expressed protein | At4g27435 expressed protein |
| At1g41830 multicopper oxidase type I family protein | At5g03260 laccase, putative |
| At2g38080 laccase, putative | |
| At5g01190 similar to laccase | |
| At5g05390 laccase, putative | |
| At2g29130 laccase, putative | |
| At5g60020 laccase, putative | |
| At3g02350 glycosyl transferase family 8 protein | At5g54690 glycosyl transferase family 8 protein |
| At1g19300 glycosyl transferase family 8 protein | |
| At5g12250 tubulin beta-6 chain (TUB6) | At5g12250 tubulin beta-6 chain (TUB6) |
| At1g20010 tubulin beta-5 chain (TUB5) | At5g23860 tubulin beta-8 chain (TUB8) |
Probe sets displaying BLAST score e ≤ 10−7 are placed in the same row by Rosetta.
aThe table is truncated to comply with the journal format.
To identify genes associated with secondary cell wall biosynthesis in Barley we used AtCESA4 from Arabidopsis as bait gene and used BLAST to identify targets in Barley (i.e. Arabidopsis versus Barley). Rosetta identified 14 probe sets in Barley that have similar sequences compared to AtCESA4 in Arabidopsis (Supplementary Table S3). Similar to above, Rosetta recognized genes that are common between the co-expressed gene list for AtCESA4 and the co-expressed gene lists for the 14 Barley probe sets. The comparison of the co-expression profiles revealed that three of the Barley probe sets, corresponding to Contig9658_at, Contig20165_at and Contig_15116_at, had the most similar co-expression profiles to AtCESA4 in Arabidopsis (Supplementary Table S3). BLAST analysis revealed that these probe sets correspond to secondary cell wall HvCESA4, HvCESA7 and HvCESA5/7, respectively. Similar to the analysis in Arabidopsis, Rosetta also identified putative COBRA-like 4 and CTL2 orthologs associated with the secondary HvCESAs in Barley (Supplementary Table S4). Thus, Rosetta may rapidly identify homologs that are involved in similar biological processes within and across different organisms and may therefore be used to infer ‘true’ orthologs.
CONCLUDING REMARKS
Several tools use transcriptional coordination of genes to prioritize genes associated with a specific biological function. However, combining gene expression analyses with other data sources may give researchers additional information. GeneCAT combines sequence homology and co-expression and therefore provides a multidimensional platform for exploring gene co-expression and functional redundancies between homologs within and across different species such as Arabidopsis and Barley. Rapid advances in other large-scale approaches, such as protein–protein interactions and metabolomics, may in the near future be combined with the tools presented here to generate a more in depth view of cellular processes in higher plants. To facilitate an easily accessible exploratory platform for plant biologists we have linked web interfaces for several other genome tools through the GeneCAT FAQs page.
SUPPLEMENTARY DATA
Supplementary Data are available at NAR Online.
ACKNOWLEDGEMENTS
We would like to thank Ann Loraine, Bjorn Usadel and Peter Ulvskov for their useful comments on the article. Financial support was provided by the Max-Planck Society to M.M. and S.P. Funding to pay the Open Access publication charges for this article was provided by Max Planck Society; Max Planck Institute of Molecular Plant Physiology.
Conflict of interest statement. None declared.
REFERENCES
- 1.Parkinson H, Kapushesky M, Shojatalab M, Abeygunawardena N, Coulson R, Farne A, Holloway E, Kolesnykov N, Lilja P, Lukk M, et al. ArrayExpress—a public database of microarray experiments and gene expression profiles. Nucleic Acids Res. 2007;35(Database issue):D747–D750. doi: 10.1093/nar/gkl995. [DOI] [PMC free article] [PubMed] [Google Scholar]
- 2.Zimmermann P, Hirsch-Hoffmann M, Hennig L, Gruissem W. GENEVESTIGATOR. Arabidopsis microarray database and analysis toolbox. Plant Physiol. 2004;136:2621–2632. doi: 10.1104/pp.104.046367. [DOI] [PMC free article] [PubMed] [Google Scholar]
- 3.Manfield IW, Jen CH, Pinney JW, Michalopoulos I, Bradford JR, Gilmartin PM, Westhead DR. Arabidopsis co-expression tool (ACT): web server tools for microarray-based gene expression analysis. Nucleic Acids Res. 2006;34(Web Server issue):W504–W509. doi: 10.1093/nar/gkl204. [DOI] [PMC free article] [PubMed] [Google Scholar]
- 4.Toufighi K, Brady SM, Austin R, Ly E, Provart NJ. The Botany array resource: e-Northerns, expression angling, and promoter analyses. Plant J. 2005;43:153–163. doi: 10.1111/j.1365-313X.2005.02437.x. [DOI] [PubMed] [Google Scholar]
- 5.Steinhauser D, Usadel B, Luedemann A, Thimm O, Kopka J. CSB.DB: a comprehensive systems-biology database. Bioinformatics. 2004;20:3647–3651. doi: 10.1093/bioinformatics/bth398. [DOI] [PubMed] [Google Scholar]
- 6.Obayashi T, Kinoshita K, Nakai K, Shibaoka M, Hayashi S, Saeki M, Shibata D, Saito K, Ohta H. ATTED-II: a database of co-expressed genes and cis elements for identifying co-regulated gene groups in Arabidopsis. Nucleic Acids Res. 2007;35(Database issue):869. doi: 10.1093/nar/gkl783. [DOI] [PMC free article] [PubMed] [Google Scholar]
- 7.Geisler-Lee J, O'toole N, Ammar R, Provart NJ, Millar AH, Geisler M. A predicted interactome for Arabidopsis. Plant Physiol. 2004;45:317–329. doi: 10.1104/pp.107.103465. [DOI] [PMC free article] [PubMed] [Google Scholar]
- 8.Stuart JM, Segal E, Koller D, Kim SK. A gene-coexpression network for global discovery of conserved genetic modules. Science. 2003;302:249–255. doi: 10.1126/science.1087447. [DOI] [PubMed] [Google Scholar]
- 9.Bergmann S, Ihmels J, Barkai N. Similarities and differences in genome-wide expression data of six organisms. PLoS Biol. 2004;2:E9. doi: 10.1371/journal.pbio.0020009. [DOI] [PMC free article] [PubMed] [Google Scholar]
- 10.Brown DM, Zeef LA, Ellis J, Goodacre R, Turner SR. Identification of novel genes in Arabidopsis involved in secondary cell wall formation using expression profiling and reverse genetics. Plant Cell. 2005;17:2281–2295. doi: 10.1105/tpc.105.031542. [DOI] [PMC free article] [PubMed] [Google Scholar]
- 11.Persson S, Wei H, Milne J, Page GP, Somerville CR. Identification of genes required for cellulose synthesis by regression analysis of public microarray data sets. Proc. Natl Acad. Sci. USA. 2005;102:8633–8638. doi: 10.1073/pnas.0503392102. [DOI] [PMC free article] [PubMed] [Google Scholar]
- 12.Wei H, Persson S, Mehta T, Srinivasasainagendra V, Chen L, Page GP, Somerville C, Loraine A. Transcriptional coordination of the metabolic network in Arabidopsis. Plant Physiol. 2006;142:762–774. doi: 10.1104/pp.106.080358. [DOI] [PMC free article] [PubMed] [Google Scholar]
- 13.Hirai MY, Sugiyama K, Sawada Y, Tohge T, Obayashi T, Suzuki A, Araki R, Sakurai N, Suzuki H, Aoki K, et al. Omics-based identification of Arabidopsis Myb transcription factors regulating aliphatic glucosinolate biosynthesis. Proc. Natl Acad. Sci. USA. 2007;104:6478–6483. doi: 10.1073/pnas.0611629104. [DOI] [PMC free article] [PubMed] [Google Scholar]
- 14.Fredslund J. PHY.FI: fast and easy online creation and manipulation of phylogeny color figures. BMC Bioinform. 2006;7:315. doi: 10.1186/1471-2105-7-315. [DOI] [PMC free article] [PubMed] [Google Scholar]
- 15.Rhee S, Beavis W, Berardini T, Chen G, Dixon D, Doyle A, Garcia-Hernandez M, Huala E, Lander G, Montoya M. The Arabidopsis Information Resource (TAIR): a model organism database providing a centralized, curated gateway to Arabidopsis biology, research materials and community. Nucleic Acids Res. 2003;31:224–228. doi: 10.1093/nar/gkg076. [DOI] [PMC free article] [PubMed] [Google Scholar]
- 16.Schmid M, Davison TS, Henz SR, Pape UJ, Demar M, Vingron M, Scholkopf B, Weigel D, Lohmann JU. A gene expression map of Arabidopsis thaliana development. Nat. Genet. 2005;37:501–506. doi: 10.1038/ng1543. [DOI] [PubMed] [Google Scholar]
- 17.Shen L, Gong J, Caldo RA, Nettleton D, Cook D, Wise RP, Dickerson JA. BarleyBase—an expression profiling database for plant genomics. Nucleic Acids Res. 2005;33(Database issue):D614–D618. doi: 10.1093/nar/gki123. [DOI] [PMC free article] [PubMed] [Google Scholar]
- 18.Druka A, Muehlbauer G, Druka I, Caldo R, Baumann U, Rostoks N, Schreiber A, Wise R, Close T, Kleinhofs A, et al. An atlas of gene expression from seed to seed through Barley development. Funct. Integr. Genomics. 2006;6:202–211. doi: 10.1007/s10142-006-0025-4. [DOI] [PubMed] [Google Scholar]
- 19.Somerville C. Cellulose synthesis in higher plants. Annu. Rev. Cell Dev. Biol. 2006;22:53–78. doi: 10.1146/annurev.cellbio.22.022206.160206. [DOI] [PubMed] [Google Scholar]
- 20.Arioli T, Peng L, Betzner AS, Burn J, Wittke W, Herth W, Camilleri C, Hofte H, Plazinski J, Birch R, et al. Molecular analysis of cellulose biosynthesis in Arabidopsis. Science. 1998;279 doi: 10.1126/science.279.5351.717. [DOI] [PubMed] [Google Scholar]
- 21.Fagard M, Desnos T, Desprez T, Goubet F, Refregier G, Mouille G, McCann M, Rayon C, Vernhettes S, Hofte H. PROCUSTE1 encodes a cellulose synthase required for normal cell elongation specifically in roots and dark-grown hypocotyls of Arabidopsis. Plant Cell. 2000;12:2409–2424. doi: 10.1105/tpc.12.12.2409. [DOI] [PMC free article] [PubMed] [Google Scholar]
- 22.Persson S, Paredez A, Carroll A, Palsdottir H, Doblin M, Poindexter P, Khitrov N, Auer M, Somerville CR. Genetic evidence for three unique components in primary cell-wall cellulose synthase complexes in Arabidopsis. Proc. Natl Acad. Sci. USA. 2007;104:15566–15571. doi: 10.1073/pnas.0706592104. [DOI] [PMC free article] [PubMed] [Google Scholar]
- 23.Turner SR, Somerville CR. Collapsed xylem phenotype of Arabidopsis identifies mutants deficient in cellulose deposition in the secondary cell wall. Plant Cell. 1997;9:689–701. doi: 10.1105/tpc.9.5.689. [DOI] [PMC free article] [PubMed] [Google Scholar]
- 24.Burton RA, Shirley NJ, King BJ, Harvey AJ, Fincher GB. The CesA gene family of Barley. Quantitative analysis of transcripts reveals two groups of co-expressed genes. Plant Physiol. 2004;134:224–236. doi: 10.1104/pp.103.032904. [DOI] [PMC free article] [PubMed] [Google Scholar]
- 25.Desprez T, Juraniec M, Crowell EF, Jouy H, Pochylova Z, Parcy F, Hofte H, Gonneau M, Vernhettes S. Organization of cellulose synthase complexes involved in primary cell wall synthesis in Arabidopsis thaliana. Proc. Natl Acad. Sci. USA. 2007;104:15572–15577. doi: 10.1073/pnas.0706569104. [DOI] [PMC free article] [PubMed] [Google Scholar]
- 26.Jen CH, Manfield IW, Michalopoulos I, Pinney JW, Willats WG, Gilmartin PM, Westhead DR. The Arabidopsis co-expression tool (ACT): a WWW-based tool and database for microarray-based gene expression analysis. Plant J. 2006;46:336–348. doi: 10.1111/j.1365-313X.2006.02681.x. [DOI] [PubMed] [Google Scholar]
- 27.Aoki K, Ogata Y, Shibata D. Approaches for extracting practical information from gene coexpression networks in plant biology. Plant Cell Physiol. 2007;48:381–390. doi: 10.1093/pcp/pcm013. [DOI] [PubMed] [Google Scholar]
- 28.Franke R, Schreiber L. Suberin—a biopolyester forming apoplastic plant interfaces. Curr. Opin. Plant Biol. 2007;10:252–259. doi: 10.1016/j.pbi.2007.04.004. [DOI] [PubMed] [Google Scholar]
- 29.Muraoka R, Okuda K, Kobayashi Y, Shikanai T. A eukaryotic factor required for accumulation of the chloroplast NAD(P)H dehydrogenase complex in Arabidopsis. Plant Physiol. 2006;142:1683–1689. doi: 10.1104/pp.106.088682. [DOI] [PMC free article] [PubMed] [Google Scholar]
- 30.Cooke R, Raynal M, Laudie M, Delseny M. Identification of members of gene families in Arabidopsis thaliana by contig construction from partial cDNA sequences: 106 genes encoding 50 cytoplasmic ribosomal proteins. Plant J. 1997;11:1127–1140. doi: 10.1046/j.1365-313x.1997.11051127.x. [DOI] [PubMed] [Google Scholar]
Associated Data
This section collects any data citations, data availability statements, or supplementary materials included in this article.