

Abstract
Purpose
Use the meta-analytic approach to examine the effects of aerobic exercise on high-density lipoprotein two cholesterol (HDL2-C) in adults.
Study sources
(1) Computerized literature searches; (2) cross-referencing from retrieved articles; (3) hand-searching; and (4) expert review of our reference list.
Study selection
(1) Randomized controlled trials; (2) aerobic exercise ≥8 weeks; (3) adults ≥18 years of age; (4) studies published in journal, dissertation, or master's thesis format; (5) studies published in the English-language between January 1, 1955 and January 1, 2003; and (6) assessment of HDL2-C in the fasting state.
Data abstraction
All coding conducted by both authors, independent of each other. Discrepancies were resolved by consensus.
Results
Nineteen randomized controlled trials representing 20 HDL2-C outcomes from 984 males and females (516 exercise, 468 control) were pooled for analysis. Using random-effects modeling and bootstrap confidence intervals (BCI), a statistically significant increase of approximately 11% was observed for HDL2-C (X̄ ± S.E.M., 2.6±0.9 mg/dl, 95% BCI, 1.0–4.4 mg/dl). With each study deleted from the model once, results remained statistically significant. Increases in HDL2-C were independent of decreases in body weight, body mass index (kg/m2), and percent body fat.
Conclusion
Aerobic exercise increases HDL2-C in adults.
Keywords: Exercise, Physical Fitness, Cholesterol, Lipids, Lipoproteins, Meta-analysis
1. Introduction
High-density lipoprotein two cholesterol (HDL2-C) is one of the two major subclasses of high-density lipoprotein cholesterol (HDL-C). The major role of HDL2-C appears to be as a final receptor in the reverse cholesterol transport process [1]. This process involves the movement of cholesterol by HDL from the peripheral tissues and then back to the liver where it is broken down and excreted as bile [1]. The third report of the National Cholesterol Education Program Expert Panel on the Detection, Evaluation, and Treatment of High Blood Cholesterol in Adults (Adult Treatment Panel III) concluded that a low level of HDL-C is strongly and inversely related to coronary heart disease (CHD) [2]. Of the two major HDL-C subfractions, HDL2-C appears to provide greater protection against CHD than high-density lipoprotein three cholesterol (HDL3-C) [3].
Participation in aerobic exercise, a low-cost, nonpharmacologic intervention that is available to the vast majority of the general public, has been recommended as a therapeutic lifestyle change for improving lipids and lipoproteins in adults [2]. However, the results of previous randomized controlled trials dealing with the effects of aerobic exercise on HDL2-C have led to less than overwhelming results [4–22], with only 30% of HDL2-C outcomes reported as statistically significant. While this may lead one to question the utility of aerobic exercise for increasing HDL2-C in adults, such a conclusion would be based on the vote-counting approach (percentage of statistically significant results), a procedure that has been shown to be less accurate than the more quantitative meta-analytic approach [23]. Unfortunately, to the best of our knowledge, we are not aware of any previous meta-analytic research that has specifically examined the effects of aerobic exercise on HDL2-C in adults. Thus, given (1) the apparent protective effect of increasing levels of HDL2-C on CHD; (2) the less than overwhelming results from randomized controlled trials dealing with the effects of aerobic exercise on HDL2-C; and (3) the absence of any meta-analytic work on this topic, the purpose of this study was to use the meta-analytic approach to examine the effects of aerobic exercise on HDL2-C in adult humans.
2. Methods
2.1. Data sources
In order to examine for potentially eligible studies we used: (1) computerized literature searches (MEDLINE, EMBASE, SportDiscus, Current Contents, Dissertation Abstracts International); (2) cross-referenced from review articles as well as original trials; (3) hand-searched selected journals; and (4) had an expert review our reference list (Dr. William Haskell, personal communication). Key words used in our computerized literature searches included cholesterol, lipids, lipoproteins, exercise, fitness, physical activity, aerobic, adults, humans, and cardiovascular disease.
2.2. Study selection
The inclusion criteria for this study were: (1) randomized controlled trials with a comparative non-exercise group; (2) aerobic exercise ≥8 weeks; (3) adult humans ≥18 years of age; (4) studies published in journal, dissertation, or master's thesis format; (5) studies published in the English-language between January 1, 1955 and January 1, 2003; and (6) assessment of HDL2-C in the fasting state. Multiple publication bias was addressed by examining each potentially eligible study and only including data from the one study that provided the greatest amount of information. We did not include foreign-language articles because they were beyond the scope of this investigation. All studies were selected by both authors, independent of each other. Disagreements were resolved by consensus.
2.3. Data abstraction
Codebooks that could hold more than 200 items per study were used for this investigation. The major categories of variables that were coded included: (1) study characteristics (source, study quality, percent dropout, etc.); (2) subject characteristics (gender, age, body weight, etc.); (3) lipid assessment characteristics (position, number of hours fasted prior to assessment, etc.); (4) training program characteristics (length, frequency, intensity, duration, mode, etc.); and (5) primary (HDL2-C) and secondary (HDL3-C, HDL-C, body weight, body mass index (BMI) in kg/m2, percent body fat, maximum oxygen consumption in ml/kg/min) outcomes. All coding was conducted by both authors, independent of each other. The first two authors then reviewed every data point for accuracy and consistency. Discrepancies were resolved by consensus. Cohen's kappa for inter-rater agreement between the two coders prior to correcting discrepant items was 0.93.
2.4. Statistical analysis
2.4.1. Primary and secondary outcomes
The primary outcome in this study was baseline to final changes in HDL2-C in milligrams per deciliter (mg/dl). We used mg/dl versus mmol because this is the metric most commonly used to report lipid and lipoprotein values in the clinical setting in the United States. Net changes in lipids and lipoproteins were calculated as the difference (exercise minus control) of the changes (final minus initial) in the mean values from each study. Pooled treatment effects were calculated by assigning weights equal to the inverse of the variance for net changes in HDL2-C. Ninety-five percent confidence intervals were generated using bootstrap resampling, corrected for bias [24]. Bootstrap resampling is a non-parametric procedure in which the original data are resampled with replacement [24]. It provides more valid estimates than limiting oneself to the original data, avoids the rigidity of parametric statistics (for example, normality and equal variance), and is especially appropriate for meta-analytic datasets [25]. In addition, because resampling procedures in general use the actual data as opposed to ranks, they are more powerful than traditional nonparametric statistics [26]. For this study, bootstrap estimates were based on 5000 iterations since it has been shown that improvement of estimation accuracy beyond 5000 iterations is limited [27]. If the 95% bootstrap confidence intervals (BCI) did not cross zero (0.00) the results were considered to be statistically significant. A random-effects model was used for all analyses [28,29]. Statistical heterogeneity was examined using the Q statistic [30]. The alpha value for the statistical significance of Q was set at p ≤ 0.10 because this statistic tends to suffer from low power [31]. In addition, we examined the consistency of our overall results using a recently developed statistic (I2) that is an extension of Q [32]. I2 is calculated as 100% × (Q − d.f.)/Q, where Q is the heterogeneity statistic and d.f. the degrees of freedom. Values of 25%, 50%, and 75% are considered to be indicative of low, moderate, and high degrees of heterogeneity. Secondary outcomes (HDL3-C, HDL-C, body weight, BMI, percent body fat, maximum oxygen consumption in ml/kg/min) were analyzed using the same procedures as for primary outcomes.
Publication bias was assessed using regression analysis to detect funnel plot asymmetry [33]. In addition, we also estimated the number of studies that would be needed to reduce our findings from significance to nonsignificance using the recently developed approach of Rosenberg [34]. Study quality was assessed using a previously validated and reliable quality index developed by Jadad et al. [35]. This assessment is a three-item questionnaire designed to assess bias, specifically, randomization, blinding, and withdrawals/dropouts. The minimum number of points possible is 0 and the maximum 5, with the higher number representing greater study quality. However, since there is currently no “gold standard” for assessing the quality of a clinical trial, all such methods need to be interpreted with caution [36].
In order to examine the effects of each study on changes in HDL2-C, analyses were conducted with each study deleted from the model once.
2.4.2. Subgroup analyses
A priori subgroup analyses for changes in HDL2-C were accomplished using random effects ANOVA models for meta-analysis [31]. Similar to traditional ANOVA, these models provide statistics for between (Qb), within (Qw), and total (Qt) differences. Data were analyzed when HDL2-C outcomes were partitioned according to source (journal versus other), country (United States versus other), gender, drugs that could affect lipids and lipoproteins, cigarette smoking, alcohol consumption, menopausal status (pre versus post), whether all subjects were classified as healthy or not, whether all subjects had diabetes, and whether the exercise program was supervised or unsupervised. Resampling in the form of randomization tests (5000 iterations) was used to establish the statistical significance (p ≤ 0.05) of our subgroup analyses [26]. We conducted separate analyses for the aforementioned variables because of missing data for different variables from different studies.
In addition to our subgroup analyses, we also conducted sensitivity analyses in order to examine the effects of decreases in body composition (body weight, BMI, percent body fat) in the exercise groups on changes in HDL2-C. This was accomplished by running our analyses with those studies that reported statistically significant decreases in body composition deleted from the model.
2.4.3. Meta-regression
In order to examine the relationship between HDL2-C and selected continuous variables, simple, weighted, generalized least-squares random effects meta-regression was performed a priori. Meta-regression is analogous to simple and multiple regression for conventional datasets. Variables that were examined included initial lipid levels, year of publication, study quality, percent dropout, age, initial as well as changes in body weight, BMI, percent body fat, and maximum oxygen consumption in ml/kg/min, number of hours that exercise was avoided prior to lipid assessment, and the length, frequency, intensity, and duration of training as well as total minutes of training (length × frequency × duration) and compliance to the exercise protocol. In order to maximize the number of data points for each analysis, we did not try and conduct any type of multiple regression analysis because of missing data for different variables from different studies, a common occurrence with meta-analytic datasets [37]. Resampling in the form of randomization tests (5000 iterations) was used to establish the statistical significance (p ≤ 0.05) of our regression analyses [26].
2.4.4. Miscellaneous
We used the complete case approach in the handling of missing data. We did not adjust our alpha level for multiple subgroup and meta-regression analyses because of our general belief that such adjustments lead to an increased risk for errors in the interpretation of data, including an increased risk for Type II errors [38]. All tests were two-tailed. Descriptive statistics are reported as mean ± Standard deviation (X̄ ± S.D.) while primary and secondary outcomes are reported as mean ± Standard error of the mean (X̄ ± S.E.M.). All data were analyzed using MetaWin© (version 2.1) and SPSS© (version 13.0).
3. Results
3.1. Study characteristics
3.1.1. Studies included
Of the 3750 citations reviewed, 21 met our inclusion criteria [4–22,39,40]. However, we were unable to include two studies because of the inability to retrieve necessary data for HDL2-C [39,40]. Thus, our percent loss that met our inclusion criteria was approximately 9%, leaving us with a total of 19 studies for analysis [4–22]. A general description of the included studies is shown in Table 1.
Table 1.
Characteristics of included studies
| Study | Design | Subjects | Aerobic exercise program |
|---|---|---|---|
| [4] | RCT | 22 Sedentary women, 41–55 years of age, assigned to either an exercise (n = 11) or control (n = 11) group | 12 Weeks of walking, 2–7 days/week, 20–40 min/session, 63–86% of MHR |
| [5] | RCT | 42 Males, 19 exercise (age = 51.0 ± 5.2 years) and 23 control (age = 54.3 ± 6.2 years) | 24 Weeks of training following the Canadian Air Force 5BX plan |
| [6] | RCT | 204 Women assigned to either an exercise (n = 100, age = 57.95 ± 4.01 years) or control (n = 104, age = 57.39 ± 4.17 years) group | 104 Weeks of walking, 3 days/week |
| [7] | RCT | 34 Sedentary men, 35–76 years of age (mean = 58 ± 11), assigned to an exercise (n = 15) or control (n = 19) group | 16 Weeks of cycling, 3 days/week, 20–50 min/session, 60–80% of MHR |
| [8] | RCT | 45 Sedentary women assigned to an exercise (n = 25, age = 48.8 ± 5.5 years) or control (n = 20, age = 50.8 ± 5.4 years) group | 24 Weeks of walking/cycling, 3 days/week, 30 min/session, 70% of MHR |
| [9] | RCT | 61 Sedentary men assigned to an exercise (n = 39, age = 38.8 ± 8.9 years) or control (n = 22, age = 35.2 ± 7.3 years) group | 16 Weeks of jogging, 2 to 6 times per week, 120 min/week, 85% of heart rate at the anaerobic threshold. |
| [10] | RCT | 37 Sedentary women assigned to either a 750 kcals/week of exercise (n = 13), 1500 kcals/week (n = 14), or control (n = 10) group | 14 Weeks of walking, 5 days/week, expending either 750 or 1500 kcal/week, 50% of VO2max |
| [11] | RCT | 60 Men, 32–44 years of age (mean age = 37 ± 2 years), assigned to an exercise (n = 31) or control (n = 29) group | 8 Weeks of walking and jogging, 4–5 days/week, 45–60 min/session, 40–60% of MHRR |
| [12] | RCT | 55 Sedentary men, ages 24–26 years, assigned to either an exercise (n = 28, age = 24.7 ± 0.8 years) or control (n = 27, age = 25.0 ± 0.8 years) | 9 Weeks of jogging/aerobic circuit training/cycling/swimming, 3 days/week, 45–60 min/session, 70–85% of maximal capacity |
| [13] | RCT | 25 Men and women, 52.5 years of age, assigned to either an exercise (n = 13) or control (n = 12) group | 16 Weeks of walking, jogging, or skiing, 5–7 days/week, at least 45 min/session, approximately 70% of VO2max |
| [14] | RCT | 20 Men and women, 32 to 60 years of age, assigned to either an exercise (n = 10, age = 51 ± 9.48 years) or control (n = 10, age = 51 ± 9.48 years) group | 10 Weeks of cycling, 3 days/week, 30 min/session |
| [15] | RCT | 35 Sedentary women assigned to an exercise (n = 18, age = 62 ± 9 years) or no exercise and sodium restriction (n = 17, age = 65 ± 10 years) group | 13 Weeks of walking, 5.8 days/week, 40 min/session, 70% of MHR |
| [16] | RCT | 40 Men and women, 60 to 77 years of age (mean age = 67 ± 4 years), assigned to an exercise (n = 20) or control (n = 20) group | 20 Weeks of cycling, 2–4 days/week, 50% of VO2max |
| [17] | RCT | 32 Sedentary women, 25–55 years of age assigned to an exercise (n = 16, age = 38.20 ± 9.40 years) or control (n = 16, age = 42.20 ± 8.20 years) group | 16 Weeks of jogging, 2–6 days/week, 20–60 min session (120 total minutes per week), 75% to 87% of MHR |
| [18] | RCT | 29 Sedentary men, 25–52 years of age, assigned to either an exercise (n = 14, age = 37 ± 6 years), or control (n = 15, age = 36 ± 8 years) group | 16 Weeks of vigorous exercise to music and games, 2 days/week, 60 min/session. Subjects were also encouraged to increase their level of unsupervised aerobic activity. |
| [19] | RCT | 63 Men and women, ages 65–94 years of age, assigned to an exercise (n = 31, age = 77.9 ± 7.4 years) or control (n = 32, age = 77.8 ± 7.5 years) group | 32 Weeks of walking/jogging, cycling, rowing, arm cranking, 3 days/week, 50 min/session, 60–80% of MHRR |
| [20] | RCT | 13 Sedentary women assigned to either an exercise (n = 6, age = 36 ± 4.9 years) or control (n = 7, age = 35 ± 5.3 years) group | 20 Weeks of cycling, 5.2 days/week, 15 min/session, 60–90% of VO2max |
| [21] | RCT | 78 Sedentary men, 46 exercise (age = 45.3 years) and 32 control (age = 46.2 years) | 52 Weeks of running, 3–5 days/week, at least 25 min/session, 70–85% of VO2max |
| [22] | RCT | 89 Sedentary men, 30–59 years of age, assigned to an exercise (n = 47, age = 44.1 ± 7.8 years) or control (n = 42, age = 45.2 ± 7.2 years) group | 52 Weeks of walking and jogging, 3–5 days per week, 25–50 min/session, 60–80% of MHR. Subjects were also encouraged to increase their general activity by such things as walking, cycling, stair climbing, and recreational activities. |
Notes: Description of studies limited to those subjects and variables that met our inclusion criteria; RCT, randomized controlled trial; number of subjects limited to those in which pre- and post-assessment of lipids took place; data reported as mean ± S.D.; kcals, kilocalories; MHRR, maximum heart rate reserve; VO2max, maximum oxygen consumption; MHR, maximal heart rate.
3.1.2. Country of origin
Seven studies were conducted in the United States [6–8,10,15,21,22]. while another two each were conducted in either Finland [11,13], Japan [14,16], or Switzerland [9,17]. The remaining six studies were conducted in either Israel [12], New Zealand [18], Portugal [19], Scotland [5], Sweden [20], or the United Kingdom [4].
3.1.3. Study design
For studies in which there were dropouts, the majority (88%) used an analysis-by-protocol approach to analyze their data [4–8,10,13–16,18–22]. A total of 39 groups (20 exercise, 19 control) representing 984 subjects (516 exercise, 468 control) and 20 HDL2-C outcomes were available for pooling. The number of exercise groups exceeded the number of control groups because one study included more than one exercise group [10]. The percentage of subjects that were not available for follow-up ranged from 0% to 45% for the exercise groups (X̄ ± S.D., 10.1 ± 11.4%) and 0–30% for the control groups (X̄ ± S.D., 6.5 ± 9.1%). Median study quality was two out of a possible high of five. A general description of the studies is shown in Table 1.
3.2. Subject characteristics
3.2.1. Gender
Baseline characteristics of the subjects are shown in Table 2. Seven studies were limited to females [4,6,8,10,17,20]. while another eight were limited to males [5,7,11,12,18,21,22]. The remaining four studies included both males and females [13,14,16,19]. Of the 984 subjects, 462 were females and 522 were males. Four studies reported that all female subjects were postmenopausal [6,8,15,19] while another two studies reported that all female subjects were premenopausal [10,17].
Table 2.
Baseline characteristics of subjects
| Variable | N | Exercise (X̄ ± S.D.) | N | Control (X̄ ± S.D.) |
|---|---|---|---|---|
| Age (years) | 20 | 47.9 ± 12.4 | 19 | 48.6 ± 13.0 |
| Height (cm) | 6 | 170.0 ± 7.7 | 6 | 170.0 ± 8.4 |
| Body weight (kg) | 16 | 72.9 ± 11.5 | 15 | 73.5 ± 11.5 |
| BMI (kg/m2) | 14 | 25.0 ± 2.6 | 14 | 25.2 ± 2.7 |
| Body fat (%) | 8 | 28.6 ± 7.3 | 7 | 28.5 ± 7.0 |
| VO2max (ml/kg/min) | 13 | 30.2 ± 7.4 | 10 | 30.6 ± 7.4 |
| HDL2-C (mg/dl) | 20 | 23.4 ± 19.9 | 19 | 22.2 ± 14.5 |
| HDL3-C (mg/dl) | 18 | 46.6 ± 44.3 | 17 | 47.6 ± 46.2 |
| HDL-C (mg/dl) | 20 | 52.7 ± 10.8 | 19 | 52.0 ± 9.5 |
Notes: N, number of groups reporting data; X̄ ± S.D., mean ± Standard deviation; BMI, body mass index; VO2max, maximum oxygen consumption; HDL2-C, high density lipoprotein two cholesterol; HDL3-C, high density lipoprotein three cholesterol; HDL-C, high density lipoprotein cholesterol.
3.2.2. Race/ethnicity
Two studies reported that all subjects were Japanese [14,16], while one each reported that all subjects were either black [7] or white [6]. Another study reported that with the exception of one Asian, all subjects were white [15].
3.2.3. Medications
Eleven studies reported that none of the subjects were taking any medications that could affect lipid and lipoprotein levels [4,6–9,14–16,19,21,22] while another two reported that some subjects were taking medications that might affect lipid and lipoprotein levels [5,17].
3.2.4. Smoking/alcohol
Seven studies reported that none of the subjects smoked cigarettes [4,7,9,12,15,17,22] while another seven studies reported that some of the subjects smoked cigarettes [5,6,11,18–21]. For alcohol consumption, two studies reported that none of the subjects consumed alcohol [17,12] while another six reported that some of the subjects consumed alcohol [5,6,9,17,18,21].
3.2.5. Co-morbidities
One study reported that all subjects were hyperlipidemic [12] while another study reported that all subjects had cardiovascular disease [5]. Another two studies reported that all subjects had diabetes, one consisting of subjects with type 1 diabetes [20], and another consisting of subjects with type 2 diabetes [13]. One study reported that all subjects were overweight [22] while another two reported that some of the subjects were overweight [4,10].
3.2.6. Diet/physical activity
One study reported that there were changes in diet during the study [22] while another reported that some of the subjects were physically active prior to taking part in their study [6].
3.3. Lipid assessment characteristics
Three studies reported the assessment of lipids and lipoproteins in the sitting position [11,12,21] while one reported assessment in the supine position [22] Prior to the morning assessment of lipids, subjects fasted from 10 to 14 h (X̄ ± S.D., 12.2 ± 1.0 h). The number of hours that exercise was avoided ranged from 14 to 72 h (X̄ ± S.D., 35.4 ± 16.9 h). Seven studies provided information regarding the chemicals used for the precipitation of HDL2-C (five different compounds) [4–6,9,13,19,22].
3.4. Training program characteristics
Characteristics of the exercise training program are shown in Table 3. For training modality, four studies used walking [4,6,10,15], three used cycling [7,14,20], and one used jogging. The remaining studies used a combination of two or more of the following activities: (1) walking; (2) jogging; (3) cycling; (4) swimming; (5) stairclimbing; and (6) other miscellaneous activities [5,9,11–13,16–19,21,22]. Nine studies reported that the exercise training programs were supervised [5,7,8,10,12,14,18,19,21] while another two reported that the exercise programs were unsupervised [15,20]. Six other studies reported a combination of both supervised and unsupervised exercise [4,6,9,16,17,22]. As can be seen, complete compliance data, defined as the percentage of exercise sessions attended, was reported by only two studies [6,12].
Table 3.
Training program characteristics.
| Variable | N | X̄ ± S.D. | Range |
|---|---|---|---|
| Length (weeks) | 20 | 24.4 ± 22.4 | 8–104 |
| Frequency (times/week) | 19 | 4.0 ± 1.1 | 2–6 |
| Intensity (%VO2max) | 16 | 68.3 ± 11.9 | 50–85 |
| Duration (min/session) | 16 | 40.6 ± 12.7 | 15–60 |
| Compliance (%) | 2 | 66.0 ± 11.4 | 58–74 |
N, number of groups reporting data; X̄ ± S.D., mean ± Standard deviation; compliance, percentage of exercise sessions attended.
3.5. Primary and secondary outcomes
3.5.1. HDL2-C
Overall results for changes in HDL2-C are shown in Table 4 while outcomes from each study are shown in Fig. 1. As can be seen, results were statistically significant and equivalent to a relative increase of approximately 11% for HDL2-C. No statistically significant heterogeneity (Table 4) or publication bias (t = 0.15, p = 0.88) was observed. With each study deleted from the model once, results remained statistically significant. The number of studies yielding null results that would be needed to reverse our statistically significant findings for HDL2-C was estimated to be 35.
Table 4.
Primary and secondary outcomes
| Variable | N | X̄ ± S.E.M. | 95% BCI | Q | p | I2 (%) |
|---|---|---|---|---|---|---|
| Primary outcome (mg/dl) | ||||||
| HDL2-C | 20 | 2.6 ± 0.9 | 1.0 to 4.4a | 17.7 | 0.55 | 0 |
| Secondary outcomes | ||||||
| Body weight (kg) | 14 | −1.4 ± 0.5 | −2.4 to −0.5a | 9.5 | 0.74 | 0 |
| BMI (kg/m2) | 8 | −0.3 ± 0.2 | −0.8 to −0.03a | 4.6 | 0.71 | 0 |
| Body fat (%) | 7 | −2.3 ± 0.7 | −3.4 to −0.9a | 5.8 | 0.44 | 0 |
| VO2max (ml/kg/min) | 11 | 3.5 ± 0.7 | 2.3 to 5.2a | 10.0 | 0.44 | 0 |
| HDL3-C | 18 | −0.7 ± 0.7 | −2.2 to 0.8 | 18.5 | 0.36 | 0 |
| HDL-C | 20 | 1.7 ± 1.0 | −0.2 to 3.5 | 14.2 | 0.77 | 0 |
N, number of groups reporting data in which a treatment effect could be calculated; X̄ ± S.E.M., mean ± Standard error of the mean; BCI, bootstrap confidence interval 5000 iterations; Q, heterogeneity value; p, significance value for Q; I2, percent inconsistency of study results, calculated from Q statistic; HDL2-C, high density lipoprotein two cholesterol; BMI, body mass index; VO2max, maximum oxygen consumption; HDL-C, high-density lipoprotein cholesterol; HDL3-C, high density lipoprotein three cholesterol.
Significantly different from zero (0).
Fig. 1.
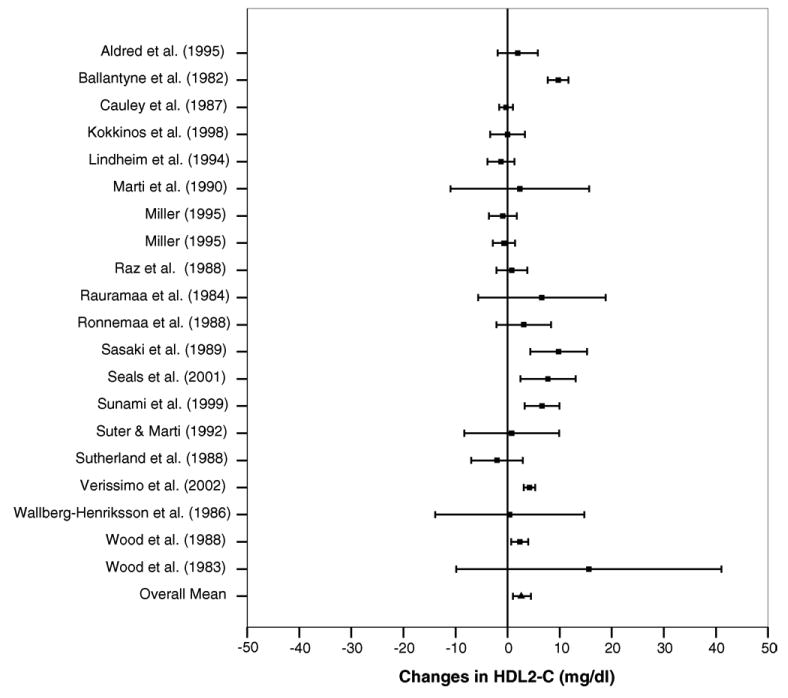
Forest plot for changes in HDL-C2 and 95% confidence intervals for each outcome from each study. The square represents the mean change while the left and right extremes of the square represent the lower and upper 95% confidence intervals for each outcome. The overall mean difference for all studies combined is shown by the middle of the diamond while the left and right extremes of the diamond represent the lower and upper 95% bootstrap confidence interval.
Subgroup analyses revealed that changes in HDL2-C were greater (Qb = 6.14, p = 0.03) for studies conducted in countries other than the United States (Other countries, X̄ ± S.E.M., 4.2 ± 1.0 mg/dl, 95% BCI, 2.0 to 6.7 mg/dl; USA, X̄ ± S.E.M., 0.7 ± 1.0 mg/dl, 95% BCI, −0.6 to 2.9 mg/dl). No other subgroup analyses were statistically significant. These included source of study, gender, drugs that could affect lipids and lipoproteins, cigarette smoking, alcohol consumption, menopausal status, presence of diabetes, whether all subjects were classified as apparently healthy, and whether the exercise program was supervised or unsupervised (p > 0.05 for all). Changes in HDL2-C remained statistically significant when studies that reported statistically significant decreases in body composition (body weight, BMI, percent body fat) were deleted from the model.
Meta-regression revealed no statistically significant relationships (p > 0.05) between changes in HDL2-C and initial HDL2-C, year of publication, study quality, percent dropout, age, initial body weight, changes in body weight, initial BMI, changes in BMI, initial percent body fat, changes in percent body fat, initial maximum oxygen consumption in ml/kg/min, and changes in maximum oxygen consumption in ml/kg/min. In addition, no statistically significant relationships were observed between HDL2-C and length of training in weeks, frequency of training, intensity of training, expressed as a percentage of maximum oxygen consumption, duration of training, and total minutes of training.
3.5.2. Secondary outcomes
Results for secondary outcomes are shown in Table 4. As can be seen, there were statistically significant decreases in body weight, BMI, and percent body fat, as well as a statistically significant increase in maximum oxygen consumption in ml/kg/min. Absolute changes were equivalent to relative reductions of approximately 2%, 1%, and 8%, respectively, for body weight, BMI, and percent body fat. An approximate 12% increase in maximum oxygen consumption in ml/kg/min was observed. While changes in HDL3-C and HDL-C were in the direction of benefit, these results were not statistically significant.
4. Discussion
The primary purpose of this study was to use the meta-analytic approach to examine the effects of aerobic exercise on HDL2-C in adults. Our findings support the efficacy of aerobic exercise for increasing HDL2-C in adults. While there were statistically significant decreases in body composition (body weight, BMI, percent body fat), none of these changes were significantly correlated with changes in HDL2-C. Thus, it appears that increases in HDL2-C as a result of aerobic exercise occur independent of changes in body weight. These findings are important because of the general belief that HDL2-C provides greater protection against CHD than HDL3-C [3]. In addition, the fact that we found statistically significant increases in HDL2-C but not HDL-C suggests that cardioprotective benefits can occur independent of changes in HDL-C. This is noteworthy because in the traditional clinical setting, the assessment of HDL-C is readily available while the assessment of HDL-C subfractions is not [2]. Consequently, the lack of an increase in HDL-C in the clinical setting may not be indicative of a lack of cardioprotection within this lipoprotein group.
The statistically significant increase in maximum oxygen consumption in ml/kg/min observed in our study suggests that the aerobic exercise programs were successful at improving cardiorespiratory fitness. Alternatively, the lack of a statistically significant change in HDL3-C suggests that aerobic exercise does not significantly change the level of this HDL-C subfraction.
An unexpected finding of this study was that increases in HDL2-C were greater in studies conducted in countries other than the United States. However, whether this reflects a true difference or is the result of some other potentially confounding factor(s) is not known. Furthermore, since we collapsed all countries other than the United States into one category because of sample size issues, caution is warranted in the interpretation of this finding.
The lack of a statistically significant relationship between increases in HDL2-C and any of the training program characteristics is not surprising given the fact that the vast majority of studies appeared to follow the general guidelines for exercise prescription as recommended by the American College of Sports Medicine [41]. Given such, it would seem appropriate to suggest that adherence to these guidelines would bring about the increases in HDL2-C observed in our study. Briefly, this includes aerobic activities such as walking, jogging, cycling, or swimming, performed 3–5 days per week for 20–60 min at an intensity equivalent to 55–90% of maximum heart rate [41]. Training at a lower versus higher intensity level may be preferable because of the potential for increased compliance as well as a reduced risk for injury [41].
Meta-analysis, like any type of review, is limited by the available evidence. With the former in mind, it is important that our results be viewed with regard to the following issues. First, it is important to not try and generalize our findings beyond the characteristics of the included studies. For example, it would probably be inappropriate to assume that the findings of our investigation in adults would be similar in children and adolescents. Second, the fact that we conducted multiple tests, for example, simple regression, because of missing data for missing variables, may have increased our risk for a Type I error. However, Rothman has clearly pointed out that while adjustment for multiple comparisons assumes that “chance” is the first-order explanation for one's observations, such an assumption is antagonistic to the basic principle of research in which nature follows regular laws that can be studied through observations [38]. Furthermore, limiting the number of tests conducted in order to reduce the risk for a Type I error limits one from exploring potentially important findings.
Missing data is a common occurrence with any meta-analytic investigation. For our investigation, less than half the studies reported data on race/ethnicity (26%), alcohol consumption (42%), and compliance to the exercise protocol (11%). Since these could influence lipid and lipoprotein outcomes, it is suggested that future studies report, and editors publish, complete information for these variables. In addition to missing data, only one study each reported that all subjects were either hyperlipidemic [12], had cardiovascular disease [5], or were overweight [22]. Since subjects with these conditions may have the most to gain in relation to increasing HDL2-C levels as a result of aerobic exercise, it would seem plausible to suggest that future studies limit inclusion of subjects to those with one or more of these conditions. Finally, there was a lack of complete reporting regarding the specific method used for the determination of HDL2-C. Since this could potentially alter the outcome, it is suggested that future studies provide more complete information for this. In conclusion, the results of our study suggest that aerobic exercise increases HDL2-C in adults.
Acknowledgments
The authors would like to thank William Haskell, Ph.D., Stanford University, for reviewing our reference list and providing suggestions for the coding of studies. This study was supported by a grant from the National Institutes of Health—National Heart, Lung and Blood Institute, Award #R01-HL069802 (G.A. Kelley, Principal Investigator).
References
- 1.Glomset JA. The plasma lecithin: cholesterol acyltransferase reaction. J Lipid Res. 1968;9:155–67. [PubMed] [Google Scholar]
- 2.National Cholesterol Education Program, National Heart Lung and Blood Institute, National Institutes of Health. Third Report of the National Cholesterol Education Program (NCEP) Expert Panel on Detection, Evaluation, and Treatment of High Blood Cholesterol in Adults (Adult Treatment Panel III) Final Report. Circulation. 2002;106:3143–3421. [PubMed] [Google Scholar]
- 3.Morgan J, Carey C, Lincoff A, et al. High-density lipoprotein subfractions and risk of coronary artery disease. Curr Atheroscler Rep. 2004;6:359–65. doi: 10.1007/s11883-004-0047-0. [DOI] [PubMed] [Google Scholar]
- 4.Aldred HE, Hardman AE, Taylor S. Influence of 12 weeks of training by brisk walking on postprandial lipemia and insulinemia in sedentary middle-aged women. Metabolism. 1995;44:390–7. doi: 10.1016/0026-0495(95)90172-8. [DOI] [PubMed] [Google Scholar]
- 5.Ballantyne FC, Clark RS, Simpson HS, et al. The effect of moderate physical exercise on the plasma lipoprotein subfractions of male survivors of myocardial infarction. Circulation. 1982;65:913–8. doi: 10.1161/01.cir.65.5.913. [DOI] [PubMed] [Google Scholar]
- 6.Cauley JA, Kriska AM, LaPorte RE, et al. A two year randomized exercise trial in older women: effects on HDL-cholesterol. Atherosclerosis. 1987;66:247–58. doi: 10.1016/0021-9150(87)90068-2. [DOI] [PubMed] [Google Scholar]
- 7.Kokkinos PF, Narayan P, Colleran JA, et al. Effects of moderate intensity exercise on serum lipids in African–American men with severe systemic hypertension. Am J Cardiol. 1998;81:732–5. doi: 10.1016/s0002-9149(97)01020-5. [DOI] [PubMed] [Google Scholar]
- 8.Lindheim SR, Notelovitz M, Feldman EB, et al. The independent effects of exercise and estrogen on lipids and lipoproteins in postmenopausal women. Obstet Gynecol. 1994;83:167–72. [PubMed] [Google Scholar]
- 9.Marti B, Suter E, Riesen WF, et al. Effects of long-term, self-monitored exercise on the serum lipoprotein and apolipoprotein profile in middle-aged men. Atherosclerosis. 1990;81:19–31. doi: 10.1016/0021-9150(90)90055-n. [DOI] [PubMed] [Google Scholar]
- 10.Miller CW. The effects of various caloric expenditures per week at moderate levels of exercise training intensity on coronary risk factors in women. University of Pittsburgh; 1995. [Google Scholar]
- 11.Rauramaa R, Salonen JT, Kukkonen-Harjula K, et al. Effects of mild physical exercise on serum lipoproteins and metabolites of arachidonic acid: a controlled randomised trial in middle aged men. Br Med J (Clin Res Ed) 1984;288:603–6. doi: 10.1136/bmj.288.6417.603. [DOI] [PMC free article] [PubMed] [Google Scholar]
- 12.Raz I, Israeli A, Rosenblit H, et al. Effect of moderate exercise on serum lipids in young men with low high density lipoprotein cholesterol. Arteriosclerosis. 1988;8:245–51. doi: 10.1161/01.atv.8.3.245. [DOI] [PubMed] [Google Scholar]
- 13.Ronnemaa T, Marniemi J, Puukka P, et al. Effects of long-term physical exercise on serum lipids, lipoproteins and lipid metabolizing enzymes in type 2 (non-insulin-dependent) diabetic patients. Diab Res. 1988;7:79–84. [PubMed] [Google Scholar]
- 14.Sasaki J, Urata H, Tanabe Y, et al. Mild exercise therapy increases serum high density lipoprotein 2 cholesterol levels in patients with essential hypertension. Am J Med Sci. 1989;297:220–3. doi: 10.1097/00000441-198904000-00004. [DOI] [PubMed] [Google Scholar]
- 15.Seals DR, Tanaka H, Clevenger CM, et al. Blood pressure reductions with exercise and sodium restriction in postmenopausal women with elevated systolic pressure: role of arterial stiffness. J Am Coll Cardiol. 2001;38:506–13. doi: 10.1016/s0735-1097(01)01348-1. [DOI] [PubMed] [Google Scholar]
- 16.Sunami Y, Motoyama M, Kinoshita F, et al. Effects of low-intensity aerobic training on the high-density lipoprotein cholesterol concentration in healthy elderly subjects. Metabolism. 1999;48:984–8. doi: 10.1016/s0026-0495(99)90194-4. [DOI] [PubMed] [Google Scholar]
- 17.Suter E, Marti B. Little effect of long-term, self-monitored exercise on serum lipids in middle-aged women. J Sports Med Phys Fitness. 1992;32:400–11. [PubMed] [Google Scholar]
- 18.Sutherland WH, Nye ER, Boulter CP, et al. Physical training plasma lipoproteins and faecal steroid excretion in sedentary men. Clin Physiol. 1988;8:445–52. doi: 10.1111/j.1475-097x.1988.tb00210.x. [DOI] [PubMed] [Google Scholar]
- 19.Verissimo MT, Aragao A, Sousa A, et al. Effect of physical exercise on lipid metabolism in the elderly. Rev Port Cardiol. 2002;21:1099–112. [PubMed] [Google Scholar]
- 20.Wallberg-Henriksson H, Gunnarsson R, Rossner S, et al. Long-term physical training in female type 1 (insulin-dependent) diabetic patients: absence of significant effect on glycaemic control and lipoprotein levels. Diabetologia. 1986;29:53–7. doi: 10.1007/BF02427281. [DOI] [PubMed] [Google Scholar]
- 21.Wood PD, Haskell WL, Blair SN, et al. Increased exercise level and plasma lipoprotein concentrations: a one-year, randomized, controlled study in sedentary, middle-aged men. Metabolism. 1983;32:31–9. doi: 10.1016/0026-0495(83)90152-x. [DOI] [PubMed] [Google Scholar]
- 22.Wood PD, Stefanick ML, Dreon DM, et al. Changes in plasma lipids and lipoproteins in overweight men during weight loss through dieting as compared with exercise. N Engl J Med. 1988;319:1173–9. doi: 10.1056/NEJM198811033191801. [DOI] [PubMed] [Google Scholar]
- 23.Hedges LV, Olkin I. Vote-counting methods in research synthesis. Psychol Bull. 1980;88:359–69. [Google Scholar]
- 24.Efron B, Tibshirani R, editors. An introduction to the bootstrap. London: Chapman & Hall; 1993. [Google Scholar]
- 25.Kelley GA. Bootstrap procedures for corroborating mean outcomes from meta-analytic data: a brief tutorial. Meas Phys Ed Exerc Sci. 1997;1:203–12. [Google Scholar]
- 26.Meta-win: statistical software for meta-analysis with resampling tests. Sunderland, MA: Sinauer Associates; 1997. [Google Scholar]
- 27.Zhu W. Making bootstrap statistical inferences: a tutorial. Res Q Exerc Sport. 1997;68:44–55. doi: 10.1080/02701367.1997.10608865. [DOI] [PubMed] [Google Scholar]
- 28.Dersimonian R, Laird N. Meta-analysis in clinical trials. Control Clin Trials. 1986;7:177–88. doi: 10.1016/0197-2456(86)90046-2. [DOI] [PubMed] [Google Scholar]
- 29.Hunter JE, Schmidt FL. Fixed effects vs. random effects meta-analysis models: implications for cumulative research knowledge. Int J Sel Assess. 2000;8:275–92. [Google Scholar]
- 30.Cochran WG. The combination of estimates from different experiments. Biometrics. 1954;10:101–29. [Google Scholar]
- 31.Hedges LV, Olkin I, editors. Statistical methods for meta-analysis. San Diego, CA: Academic Press; 1985. [Google Scholar]
- 32.Higgins JPT, Thompson SG, Deeks JJ, et al. Measuring inconsistency in meta-analyses. Br Med J. 2003;327:557–60. doi: 10.1136/bmj.327.7414.557. [DOI] [PMC free article] [PubMed] [Google Scholar]
- 33.Egger M, Davey Smith G, Schneider M, et al. Bias in meta-analysis detected by a simple graphical test. Br Med J. 1997;315:629–34. doi: 10.1136/bmj.315.7109.629. [DOI] [PMC free article] [PubMed] [Google Scholar]
- 34.Rosenberg MS. The file-drawer problem revisited: a general weighted method for calculating fail-safe numbers in meta-analysis. in press. [PubMed] [Google Scholar]
- 35.Jadad AR, Moore RA, Carroll D, et al. Assessing the quality of reports of randomized clinical trials: Is blinding necessary? Control Clin Trials. 1996;17:1–12. doi: 10.1016/0197-2456(95)00134-4. [DOI] [PubMed] [Google Scholar]
- 36.Alderson P, Green S, Higgins JPT. [31st January 2004];Cochrane Reviewers' Handbook 4.2.1. updated December 2003. [Google Scholar]
- 37.Kelley GA, Kelley KS, Tran ZV. Retrieval of missing data for meta-analysis: a practical example. Int J Technol Assess Health Care. 2004;20:296–9. doi: 10.1017/s0266462304001114. [DOI] [PMC free article] [PubMed] [Google Scholar]
- 38.Rothman KJ. No adjustments are needed for multiple comparisons. Epidemiology. 1990;1:43–6. [PubMed] [Google Scholar]
- 39.Fukahori M, Aono H, Saito I, et al. Program of exercise training as Total Health Promotion Plan and its evaluation. J Occup Health. 1999;41:76–82. [Google Scholar]
- 40.Katzel LI, Bleecker ER, Colman EG, et al. Effects of weight loss versus aerobic exercise training on risk factors for coronary disease in healthy, obese, middle-aged and older men. J Am Med Assoc. 1995;274:1915–21. doi: 10.1001/jama.1995.03530240025035. [DOI] [PubMed] [Google Scholar]
- 41.American College of Sports Medicine. The recommended quantity and quality of exercise for developing and maintaining cardiorespiratory and muscular fitness, and flexibility in healthy adults. Med Sci Sports Exerc. 1998;30:975–991. doi: 10.1097/00005768-199806000-00032. [DOI] [PubMed] [Google Scholar]