

Abstract
Background
Cardiovascular disease (CVD) in women is the leading cause of mortality in the United States, and less than optimal lipid and lipoprotein levels are major risk factors for CVD. The purpose of this study was to use the meta-analytic approach to examine the effects of aerobic exercise on lipids and lipoproteins in women.
Methods
Studies were retrieved via computerized literature searches, review of reference lists, hand searching selected journals, and expert review of our reference list. The inclusion of studies was limited to randomized controlled trials published in the English language literature between January 1955 and January 2003 in which aerobic exercise was used as the primary intervention in adult women aged ≥18 years. One or more of the following lipids and lipoproteins were assessed: total cholesterol (TC), high-density lipoprotein cholesterol (HDL-C), low-density lipoprotein cholesterol (LDL-C), and triglycerides (TG).
Results
Using a random effects model, statistically significant improvements were observed for all lipids and lipoproteins (TC, X̄ ± SEM, −4.3 ± 1.3 mg/dl, 95% CI −6.9 to −1.7 mg/dl; HDL-C, X̄± SEM, 1.8 ± 0.9 mg/dl, 95% CI 0.1 to 3.5 mg/dl; LDL-C, X̄ ± SEM, −4.4 ± 1.1 mg/dl, 95% CI −6.5 to −2.2 mg/dl; TG, X̄ ± SEM, −4.2 ± 2.1 mg/dl, 95% CI −8.4 to −0.1 mg/dl). Reductions of approximately 2%, 3%, and 5%, respectively, were observed for TC, LDL-C, and TG, whereas an increase of 3% was observed for HDL-C.
Conclusions
Aerobic exercise is efficacious for increasing HDL-C and decreasing TC, LDL-C, and TG in women.
Introduction
In women, cardiovascular disease (CVD) is the leading cause of mortality in the United States. Recent data indicate that more than 360,000 women die annually from diseases of the heart.1 Less than optimal lipid and lipoprotein levels, especially low-density lipoprotein cholesterol (LDL-C), are major risk factors for CVD.2 One lifestyle approach that may improve lipid and lipoprotein concentrations in women is aerobic exercise, a cost-effective, nonpharmacological intervention that is available to the vast majority of the general public.2 However, previously published randomized controlled trials investigating the effects of aerobic exercise on lipids and lipoproteins in women have shown less than overwhelming results.3–43 For example, of the previously cited studies, statistically significant decreases were reported for only 19% of total cholesterol (TC) outcomes, 11% for LDL-C outcomes, 18% for high-density lipoprotein cholesterol (HDL-C) outcomes, and 8% for triglyceride (TG) results.3–43 In addition, although a meta-analysis that focused specifically on the effects of exercise on lipids and lipoproteins in women has been published,44 this study was conducted more than 15 years ago and was limited to studies published through December 1987. A total of 27 randomized and nonrandomized controlled trials as well as studies without a control group were included in that analysis. Across all designs and categories, a statistically significant reduction of 4 mg/dl (2%) was observed for TC, and a reduction of 9 mg/dl (10%) was observed for TG. No statistically significant differences were observed for LDL-C or HDL-C. Since that time, many additional studies on this topic have been published or located.3,4,6–15,17–19,21–31,33–38,40,41,43 The Cochrane Collaboration, an international organization dedicated to the conduct of systematic reviews in healthcare, suggests that because results on a given topic can change over time, systematic reviews usually should be updated on a yearly basis in order to have the most recent information available on a chosen topic.45 In addition, more sophisticated techniques for handling meta-analysis datasets have been developed (e.g., use of the random effects model) as well as a greater reliance on limiting the inclusion of studies to randomized controlled trials.45 Furthermore, we have reported the lack of statistically significant findings from the individual studies cited3–43 using a vote-counting approach (percentage of significant findings) that is less accurate than using the actual values reported in the studies.45 Meta-analysis is an approach in which statistical techniques are used to integrate the results of studies meeting predetermined inclusion criteria.45 The strengths of meta-analysis include the ability to (1) increase the power of primary endpoints, (2) increase estimates of treatment effectiveness, and (3) resolve discrepancies when studies disagree.
Thus, given (1) the negative effect of less than optimal lipid and lipoprotein levels on CVD in women, (2) the potential for aerobic exercise to have a positive effect on lipids and lipoproteins in women, (3) the less than overwhelming results of previous studies dealing with the effects of aerobic exercise on lipids and lipoproteins in women, (4) the absence of any recent meta-analytic work dealing with the effects of aerobic exercise on lipids and lipoproteins in women, and (5) the strengths of meta-analysis, the purpose of this study was to use the meta-analytic approach to examine the effects of aerobic exercise on lipids and lipoproteins in women.
Materials and Methods
Data sources
Studies for this meta-analysis were retrieved via (1) electronic databases (MEDLINE, EMBASE, Current Contents, Dissertation Abstracts International), (2) review of the reference lists from review articles and original studies, (3) hand searching selected journals, and (4) review of our reference list by an expert on lipids and lipoproteins (Dr. William Haskell, personal communication, May 7, 2003). Keywords used in our electronic database searches included various combinations of terms including, but not limited to, the following: exercise, physical fitness, physical activity, aerobic, cholesterol, lipids, lipoproteins, adults, humans. Hand searching of selected journals was performed because not all trial reports are included in electronic databases, and even when they are included, they may not be indexed with terms that allow them to be identified as trials that meet the meta-analysis inclusion criteria.45
Study selection
The inclusion criteria for this study were as follows: (1) randomized controlled trials, (2) chronic aerobic exercise of at least 8 weeks as an intervention, (3) adult females aged ≥18 years, (4) studies published in journal, dissertation, or master's thesis format, (5) studies published in the English language, (6) studies published between January 1955 and January 2003, and (7) one or more of the following lipids and lipoproteins assessed in the fasting state: TC, HDL-C, LDL-C, and TG. Studies published in foreign languages were not included because it was beyond the scope of this project. We used 1955 as a starting point for our search because this appears to be the first year in which a controlled trial addressing the effects of exercise on lipids and lipoproteins was conducted.46 We included only those groups that met our inclusion criteria from each study. For example, if a study included two intervention groups (aerobic exercise only, aerobic exercise plus diet) and a control group, we included the aerobic exercise and control groups but not the aerobic exercise plus diet group.
Data abstraction
A coding form was developed that could hold more than 400 items from each study. The major categories of items that were coded included (1) study characteristics (e.g., year and source), (2) physical characteristics of subjects (e.g., age and height), (3) lipid assessment characteristics (e.g., position and number of hours fasted), (4) primary outcomes (TC, HDL-C, LDL-C, and TG), and (5) secondary outcomes (body weight, body mass index [BMI] in kg/m2, percent body fat, and maximum oxygen consumption (Vo2max) in ml/kg−1/min−1). All studies were coded by the first two authors, independent of each other. We then reviewed every data point for accuracy and consistency. Interrater agreement for the initial review of studies using Cohen's kappa statistic47 was 0.95. Any discrepancies were resolved by consensus. If no consensus could be reached, the third author served as an arbitrator.
Statistical analysis
Primary and secondary outcomes
The primary outcomes in this study were changes in TC, HDL-C, LDL-C, and TG, and secondary outcomes included body weight, BMI, percent body fat, and Vo2max. As all studies used a parallel-group design, changes in primary and secondary outcomes were calculated as the difference (exercise minus control) of the changes (initial minus final) in these mean values. Variances for each group (exercise and control) were calculated from variances at baseline and final measurement using standard methods.48 Pooled outcomes for primary and secondary outcomes were calculated by assigning weights equal to the inverse of the total variance for net changes in these outcomes. A random effects model was used for all analyses,49,50 and 95% confidence intervals (95% CI) were used to establish the precision of our results. If the CI did not cross zero, our results were considered to be statistically significant. Statistical heterogeneity of study results was examined using the Q statistic.51 An alpha level of p ≤ 0.10 vs. p ≤ 0.05 was used to determine statistically significant heterogeneity because this test tends to suffer from low power.52 However, as the Q statistic can give misleading results because of issues surrounding power, we also used a recently developed statistic (I2) that measures the degree of inconsistency across studies in a meta-analysis.52 This statistic, which is based on the Q statistic, ranges from 0% to 100%, with larger numbers representing greater inconsistency. Values of 25%, 50%, and 75%, respectively, are indicative of low, moderate, and high degrees of inconsistency.52 Publication bias was examined using the procedure of Egger et al.53 Study quality was examined using a previously validated (face validity) and reliable (r = 0.77) three-item questionnaire designed to assess bias, specifically randomization, blinding, and withdrawals/dropouts. The minimum number of points possible ranges from a low of 0 to a high of 5, with higher numbers representing greater study quality.54,55 In addition to our overall results for TC, LDL-C, HDL-C, and TG, we also ran our analyses with those groups in which one or more subjects were taking hormone replacement therapy (HRT) deleted from the model, groups in which changes in diet occurred deleted from the model, and the one study in which all subjects were hyperlipidemic deleted from the model.
Subgroup analyses
Clinical heterogeneity for TC, HDL-C, LDL-C, and TG was examined by performing a priori subgroup analyses for categorical variables using random effects ANOVA models (method of moments approach), where Qb, which is similar to the F-ratio, represents between-group differences.56 Variables that were examined included study source, country, menopausal status (pre vs. post), use of drugs that might affect lipids and lipoproteins (yes vs. no), race/ethnicity, cigarette smoking, diabetes, overweight/obesity, position of lipid assessment, and training modality. We did not conduct subgroup analyses for alcohol consumption because none of the studies reported the inclusion of subjects in which all or none of the subjects consumed alcohol. In addition, we did not conduct subgroup analyses for diet or physical activity because only three studies reported that some subjects were physically active prior to taking part in the study.3,8,23 or that some of the subjects had changes in diet during the study that could affect lipid and lipoprotein levels.23,40,43 Subgroup analysis according to hyperlipidemic status or the presence of CVD was also not possible because only one study reported that all subjects were hyperlipidemic,30 and none reported that all women had CVD. Because of the multiple subgroup analyses we conducted, our alpha value for statistical significance was set at p ≤ 0.01.
Regression analysis
Clinical heterogeneity for TC, HDL-C, LDL-C, and TG was examined by performing a priori simple, weighted, generalized least-squares meta-regression (random effects, method of moments approach) for continuous variables.56 Variables that were regressed included initial lipid level, age, height, initial as well as treatment effect changes in body weight, BMI, percent body fat, and Vo2max, number of hours fasted prior to the assessment of lipids and lipoproteins, number of hours that exercise was avoided prior to the assessment of lipids and lipoproteins, length, frequency, intensity, duration, and total minutes of training (length × frequency × duration), and compliance to the exercise protocol. We did not perform any type of multiple regression because of missing data for different variables from different studies and our desire to include as many data as possible for each analysis. Because of the large number of simple regression analyses we conducted, we used 99% vs. 95% CIs to establish statistical significance. If the CI did not cross zero, we considered our results to be statistically significant.
Data reporting
Descriptive statistics are reported as mean ± standard deviation (X̄ ± SD), and results of analysis (primary and secondary outcomes) are reported as mean ± standard error of the mean (X̄ ± SEM). Relative (percent) changes in primary and secondary outcomes were calculated by subtracting the change outcome (final minus initial) from the initial value for each group (exercise vs. control) and then multiplying by 100. The relative (percent) change reported was calculated by subtracting the percent change in the exercise group from the percent change in the control group.
Results
Study characteristics
Studies included
Of the 3750 citations reviewed, 41 studies met our inclusion criteria3–43 (Table 1).
Table 1.
Characteristics of Included Studiesa
| Study | Design | Subjectsb | Exercise intervention | Lipidsc | Lipid assessment |
|---|---|---|---|---|---|
| Agren et al.3 | RCTe | 38 women, included assignment to an exercise (n = 23, age = 22 ± 3 yearsd) or control (n = 15, age = 21.0 ± 1.0 years) group | 14 weeks of aerobic activity, 3.5 days/week, at least 30 min/session, 70%–75% of Vo2max | TC, HDL, LDL, TG | Morning after a 12-hour overnight fast and avoiding exercise for 72 hours |
| Aldred et al.4 | RCT | 22 sedentary women, 41–55 years of age, assigned to either an exercise ((n = 11) or control (n = 11) group | 12 weeks of walking, 2–7 days/week, 20–40 min/session, 63%–86% of MHR | TC, HDL, LDL, TG | Morning after a 12-hour overnight fast and avoiding exercise for 48 hours |
| Allison et al.5 | RCT | 32 sedentary women, 17–26 years of age, assigned to either 30 (n = 12), or 45 (n = 11), min of exercise, or to a control group (n = 9) | 8 weeks of jogging, 3 days/week, 30 or 45 min/session, 85% MHR | TC, HDL, LDL, TG | Morning after a 12-hour overnight fast and 24 hours after the last exercise session |
| Baker and Al-Najadah6 | RCT | 30 women assigned to either an exercise (n = 20) or control (n = 10) group | 12 weeks of aerobic exercise, 2 days/week, 17 min/session, 65%–80% of MHR | TC, HDL, LDL, TG | Morning after a 12-hour overnight fast |
| Busby et al.7 | RCT | 24 sedentary women 40–65 years of age assigned to an exercise group (n = 12, age 49.20 ± 18.01 years) or control group (n = 12, age = 49.90 ± 24.94 years) | 12 weeks of walking/jogging, 3 days/week, 30 min/session, 70%–80% of MHR | TC, HDL, TG | Morning after a 10–12-hour overnight fast |
| Cauley et al.8 | RCT | 204 women assigned to either an exercise (n = 100, age = 57.95 ± 4.01 years) or control (n = 104, age = 57.39 ± 4.17 years) group | 104 weeks of walking, 3 days/week | TC, HDL, TG | Morning after fasting for at least 10 hours |
| Davison and Grant9 | RCT | 62 sedentary women, 40–60 years of age assigned to either an exercise (n = 48) or control (n = 14) group | 14 weeks of walking, 4 days/week, 30 min/session, 70%–75% of MHR | TC, HDL, TG | NA |
| Duncan et al.10 | RCT | 53 sedentary women, 20–40 years of age, assigned to a strolling (n = 18), brisk walking (n = 12), aerobic walking (n = 13), or control (n = 10) group | 24 weeks of walking 4.8 km/day, 5 days/week, at either 8 (aerobic walkers), 6.4 (brisk walkers), or 4.8 (strollers) km/h, at 86% (aerobic walkers), 67% (brisk walkers), or 56% (strollers) of MHR | TC, HDL, LDL, TG | Morning after a 12–14-hour overnight fast and avoiding exercise |
| Edin et al.11 | RCT | 17 sedentary women assigned to an exercise (n = 10) or control (n = 7) group | 11 weeks of minitrampoline rebounding, 30 min/session, 5 days/week at 70%–85% of MHR | TC, HDL, TG | 12+-hour fast |
| Fahlman et al.12 | RCT | 30 sedentary women assigned to an aerobic exercise (n = 15, age = 76 ± 5 years) or control (n = 15, age = 74 ± 5 years) group | 10 weeks of walking, 3 days/week, 20–50 min/session, 70% of MHRR | TC, HDL, LDL, TG | Morning after a 12–14-hour overnight fast and avoiding exercise for 48–96 hours |
| Furukawa et al.13 | RCT | 45 women, 32–57 years of age, assigned to either an exercise (n = 21) or control (n = 24) group | 12 weeks of walking, 2–3 days/week, 20–30 min/session, 65% of MHR | TC, HDL, LDL, TG | Morning after a 12-hour overnight fast |
| Gillett et al.14 | RCT | 82 sedentary women, 49–59 years of age, assigned to either an exercise (n = 59) or control (n = 23) group | 16 weeks of low-impact dance exercise, 3.2 days/week, 28.5 min/session, 60%–80% of MHRR | TC, HDL | Morning after a 12-hour overnight fast |
| Grandjean et al.15 | RCT | 37 sedentary women, 20 exercise and 17 control | 24 weeks of walking/jogging/cycling, 3 days/week, 20–60 min/session, 60%–80% of Vo2max | TC, HDL, LDL, TG | Morning after a 12-hour overnight fast |
| Hagan et al.16 | RCT | 24 sedentary women (mean age = 35.2 years) assigned to either an exercise (n = 12) or control (n = 12) group | 12 weeks of walking and/or running, 5 days/week, 30 min/session | TC, HDL, LDL, TG | Morning after a 14-hour overnight fast |
| Hinkleman and Nieman17 | RCT | 36 sedentary women, 25–45 years of age, 18 exercise (age = 36.0 ± 6.8 years) and 18 control (age = 32.4 ± 6.4 years) | 15 weeks of walking, 5 days/week, 45 min/session, 62% of Vo2max | TC, LDL, TG | Morning after a 12-hour overnight fast and avoiding exercise for more than 36 hours |
| Hopewell18 | RCT | 11 sedentary women, assigned to either an exercise (n = 5) or control (n = 6) group | 24 weeks of walking, 3 days/week, 50 min/session, 68% of Vo2max | TC, HDL, LDL, TG | Morning after a 12-hour overnight fast and avoiding exercise for at least 24 hours |
| Isler et al.19 | RCT | 45 sedentary women assigned to either a step aerobics (n = 15, age = 21.88 ± 2.16 years), aerobic dancing (n = 15, age 20.23 ± 0.16 years), or control (n = 15, age = 21.88 ± 1.82 years) group | 8 weeks of either step aerobics or aerobic dancing, 3 days/week, 20 min/session, 60%–70% of MHRR | TC, HDL, LDL, TG | Morning after a 10–12-hour overnight fast |
| Juneau et al.20 | RCT | 56 sedentary women, 40–60 years of age, assigned to an exercise (n = 28) or control (n = 28) group | 24 weeks of walking/jogging, 5 days/week, 47–54 min/session, 50%–60% of Vo2max | TC, HDL, LDL, TG | Morning after a 12-hour overnight fast |
| Keller and Trevino21 | RCT | 35 sedentary women, 18–45 years of age, assigned to either 3× week exercise (n = 12), 5× week exercise (n = 11), or control (n = 12) group | 24 weeks of walking, 3 or 5 days/week, 30 min/session, 50% of MHRR | TC, HDL, LDL, TG | Morning after a 7–11-hour overnight fast and after avoiding exercise |
| King et al.22 | RCT | 132 sedentary women, 50–65 years of age, assigned to high-intensity group-based exercise (n = 34), high-intensity home-based exercise (n = 35), lower-intensity home-based exercise (n = 29), or control (n = 34) group | 52 weeks of walking/jogging/cycling, 3 days/week, 40 min/session, 73%–88% of MHR (higher-intensity exercise groups) or 5 days/week, 30 min/session, 60%–73% of MHR (lower-intensity exercise groups) | HDL, LDL, TG | Morning after an overnight fast of at least 12 hours |
| Lee and White23 | RCT | 37 women, 40–61 years of age (mean age = 48.4 years), assigned to an exercise (n = 19) or control (n = 18) group | 12 weeks of low-impact aerobics and walking, 3–4 days/week, 60% of MHRR | TC, HDL, TG | Morning after a 12-hour overnight fast |
| LeMura et al.24 | RCT | 22 sedentary women, assigned to either an aerobic exercise (n = 10, age = 21.0 ± 2.0 years) or control (n = 12, age = 20.0 ± 1.0 years) group | 16 weeks of either walking/jogging, cycling, or rowing, 3–4 days/week, 30–45 min/session, 70%–85% of MHR | TC, HDL, LDL, TG | Morning after a 12–14-hour overnight fast and avoiding exercise for 24–48 hours |
| Lindheim et al.25 | RCT | 45 sedentary women assigned to an exercise (n = 25, age = 48.8 ± 5.5 years) or control (n = 20, age = 50.8 ± 5.4 years) group | 24 weeks of walking/cycling, 3 days/week, 30 min/session, 70% of MHR | TC, HDL, LDL, TG | Morning after an overnight fast |
| Lovelady et al.26 | RCT | 33 women, assigned to either an exercise (n = 18, age = 31.1 ± 5.52 years) or control (n = 15, age 29.7 ± 5.03 years) group | 12 weeks of walking, jogging, and cycling, 4.5 days/week, 20–45 min/session, 60%–70% of MHRR | TC, HDL, LDL, TG | Morning after fasting for at least 12 hours |
| Miller27 | RCT | 37 sedentary women assigned to either a 750 kcal/week of exercise (n = 13), 1500 kcal/week of exercise (n = 14), or control (n = 10) group | 14 weeks of walking, 5 days/week, expending either 750 or 1500 kcal/week, 50% of Vo2max | TC, HDL, LDL, TG | Morning after a 12-hour overnight fast and avoiding exercise for 24 hours |
| Nieman et al.28 | RCT | 43 sedentary women assigned to either an exercise (n = 21) or control (n = 22) group | 12 weeks of walking, 5 days/week, 25–45 min/session, 60%–80% of MHR | TC, HDL, LDL, TG | NA |
| Nieman et al.29 | RCT | 30 sedentary women, 67–85 years of age, assigned to an exercise (n = 14) or sham (n = 16) group | 12 weeks of walking, 5 days/week, 30–40 min/session, 60% of MHRR | TC, HDL, LDL, TG | NA |
| Ready et al30 | RCT | 25 postmenopausal women, 15 exercise and 10 control, 62 ± 5.7 years of age | 24 weeks of walking, 5 days/week, 54 min/session, 54% of MHRR | TC, HDL, LDL, TG | Morning after a 12-hour overnight fast and 12 hours after the last exercise session |
| Ready et al.31 | RCT | 53 sedentary women (mean age = 61.3 ± 5.8 years) assigned to either 3 days of exercise (n = 18, 5 days of exercise (n = 17), or control (n = 18) group | 24 weeks of walking, 3 days/week, 59 min/session, 60% Vo2 max, or 5 days/week, 56 min/session, 60% of Vo2 max | TC, HDL, LDL, TG | Morning after a 12-hour overnight fast and avoiding exercise |
| Santiago et al.32 | RCT | 25 sedentary women, 20–40 years of age, assigned to either a walking (n = 9, age = 30.0 ± 4.95 years), jogging (n = 8, age = 28.75 ± 5.12 years), or control (n = 8, age = 29.38 ± 5.71 years) group | 20 weeks of either walking or jogging, 4 days/week, 53 (walking) or 34 (jogging) min/session, 73% (walking) or 84% (jogging) of MHR | TC, HDL, LDL, TG | Morning after a 12-hour overnight fast and avoiding exercise |
| Santiago et al.33 | RCT | 27 sedentary women, 22–40 years of age, assigned to either an exercise (n = 16, age = 30.1 ± 5.3 years) or control (n = 11, age = 31.5 ± 6.1 years) group | 40 weeks of walking, 4 days/week, 72% of MHR | TC, HDL, LDL, TG | Morning after a 12-hour overnight fast and avoiding exercise |
| Seals et al.34 | RCT | 35 sedentary women assigned to an exercise (n = 18, age = 62 ± 9 years) or no exercise and sodium restriction (n = 17, age = 65 ± 10 years) group | 13 weeks of walking, 5.8 days/week, 40 min/session, 70% of MHR | TC, HDL, LDL, TG | Morning after an overnight fast |
| Sinatra et al.35 | RCT | 26 women, 28–64 years of age, assigned to an exercise (n = 15) or control (n = 11) group | 12 weeks of walking, 3 times per week | TC, HDL, TG | Morning after an overnight fast, within 48 hours after the last exercise session |
| Stefanick et al.36 | RCT | 88 women, 45–64 years of age, assigned to either an exercise (n = 43) or control (n = 45) group | 52 weeks of aerobic activity, 3 days/week, 60 min/session | TC, HDL, LDL, TG | Morning after a 12–16-hour overnight fast and at least 12 hours after the last exercise session |
| Sugiura et al.37 | RCT | 27 sedentary women, 40–60 years of age, assigned to an exercise (n = 14, age = 48.6 ± 4.2 years) or control (n = 13, age = 48.0 ± 3.6 years of age) group | 104 weeks of walking/jogging/rhythmic dance, 1 or more days/week, 30 min/session 40%–60% of MHRR | TC, HDL, LDL, TG | NA |
| Suter and Marti38 | RCT | 32 sedentary women, 25–55 years of age assigned to an exercise (n = 16, age = 38.20 ± 9.40 years) or control (n = 16, age = 42.20 ± 8.20 years) group | 16 weeks of jogging, 2–6 days/week, 20–60 min/session (120 total min/week), 75%–87% of MHR | TC, HDL, LDL, TG | Morning after a 12–14-hour overnight fast |
| Thomas et al.39 | RCT | 26 sedentary women, 18–32 years of age, assigned to 4 miles of running (n = 9), 2 miles of running (n = 11), or a control (n = 6) group | 12 weeks of running either 4 miles or 2 miles, 3 days/week, 30–36 (4-mile group) or 15–18 (2-mile group) min/session, 75% of MHR | TC, HDL, TG | Morning after a 12-hour overnight fast and 48 hours after the last exercise session |
| Verity and Ismail40 | RCT | 10 sedentary women, 50–70 years of age, assigned to either an exercise (n = 5, age = 61.20 ± 9.17 years) or control (n = 5, age = 57.20 ± 8.27 years) group | 16 weeks of walking, 3 days/week, 60–90 min/session, 65%–80% of MHRR | TC, HDL | Morning after a 10–12-hour overnight fast |
| Vetro41 | RCT | 12 sedentary women, 24–59 years of age, assigned to either an exercise (n = 6) or control (n = 6) group | 10 weeks of aerobic dance, 3 day/week, 20–25 min/session, 70%–85% of MHR | TC, HDL, LDL, TG | Morning after a 12-hour overnight fast and avoiding exercise for at least 24 hours |
| Wallberg-Henriksson et al.42 | RCT | 13 sedentary women assigned to either an exercise (n = 6, age = 36 ± 4.9 years) or control (n = 7, age = 35 ± 5.3 years) group | 20 weeks of cycling, 5.2 days/week, 15 min/session, 60%–90% of Vo2max | TC, HDL, LDL, TG | Morning after an overnight fast |
| Ziemer43 | RCT | 49 sedentary women, 23–49 years of age, assigned to either stair-stepper (n = 7), treadmill (n = 13), cross-country skier (n = 13), cycling (n = 9), or control (n = 7) conditions | 12 weeks of aerobic exercise using either a stair-stepper, treadmill, cross-country ski simulator, or stationary bicycle, 3 days/week, 20–45 min/session, at a self-selected intensity | TC, HDL, LDL, TG | Morning after a 12-hour overnight fast and avoiding exercise |
Description of studies limited to those subjects and variables that met our inclusion criteria.
Number of subjects limited to those in whom pre and post assessment of lipids took place.
Lipid variables listed limited to those that met our inclusion criteria, including availability.
Data reported as mean ± SD.
RCT, randomized controlled trial; kcal, kilocalories; MHRR, maximum heart rate reserve; Vo2max, maximum oxygen consumption; MHR, maximal heart rate; TC, total cholesterol; HDL-C, high-density lipoprotein cholesterol; LDL-C, low-density lipoprotein cholesterol; TG, triglycerides; NA, not available.
Country of origin
Twenty-nine of the 41 studies (71%) were conducted in the United States,5,7,8,10–12,14–18,20–22,24–29,32–36,39–41,43 and two each were conducted in Canada,30,31 Japan,13,37 and the United Kingdom.4,9 One study each was conducted in Australia,23 Finland,3 Kuwait,6 Sweden,42 Switzerland,38 and Turkey.19
Study design
All included studies used a parallel-group design. Only two studies appeared to use the intention-to-treat approach in the analysis of their data.13,38 A total of 98 groups (56 exercise, 42 control) representing 1715 subjects (1022 exercise, 693 control) and up to 56 outcomes were available for pooling. The number of exercise groups exceeded the number of control groups because some studies had more than one exercise group. The percentage of subjects who were not available for follow-up assessment ranges from 0% to 66.7% in the exercise groups (X̄ ± SD, 22.6 ± 17.3%) and 0% to 40.0% in the control groups (X̄ ± SD, 13.8 ± 13.9%). Study quality ranged from 0 to 5 (median = 1).
Subject characteristics
Race
Baseline characteristics of the subjects are shown in Table 2. For those subjects who reported information on race/ethnicity, three studies reported that all subjects were white,7,8,29 two reported that all subjects were Japanese,13,37 and one reported that all subjects were Hispanic.21 One study each reported that subjects consisted of whites, blacks, and Hispanics,10 primarily whites (89%),22 whites, African Americans, and Hispanics,33 or Caucasians (89%) and one Asian.34
Table 2.
Baseline Characteristics of Subjects
| Exercise | Control | |||||
|---|---|---|---|---|---|---|
| Variable | na | X̄ ± SDb | Rangec | n | X̄ ± SD | Range |
| Age, years | 55 | 41.6 ± 14.3 | 20.2–76.0 | 41 | 42.9 ± 14.4 | 20.0–74.0 |
| Height, cm | 28 | 163.5 ± 2.8 | 156.0–170.0 | 19 | 163.3 ± 3.7 | 156.0–171.0 |
| Body weight, kg | 46 | 67.8 ± 8.1 | 54.1–88.4 | 35 | 68.2 ± 8.9 | 53.0–90.5 |
| BMI,d (kg/m2) | 44 | 25.5 ± 3.4 | 20.6–36.2 | 32 | 25.6 ± 3.8 | 20.9–34.0 |
| Body fat, % | 33 | 32.2 ± 5.2 | 21.7–43.1 | 24 | 33.6 ± 5.4 | 21.3–43.4 |
| Vo2max, ml/kg−1/min−1 | 43 | 28.8 ± 6.2 | 17.3–45.0 | 30 | 27.6 ± 6.4 | 17.8–45.0 |
| TC, mg/dl | 53 | 197.4 ± 24.5 | 159.7–257.9 | 41 | 203.2 ± 23.6 | 155.0–264.0 |
| HDL-C, mg/dl | 56 | 55.6 ± 8.3 | 35.2–80.8 | 42 | 54.7 ± 8.6 | 31.2–69.2 |
| LDL-C, mg/dl | 46 | 122.1 ± 23.9 | 79.8–178.6 | 33 | 127.3 ± 21.1 | 78.2–187.5 |
| TG, mg/dl | 54 | 100.9 ± 27.3 | 57.1–171.1 | 40 | 103.1 ± 31.1 | 54.0–178.1 |
n, total number of groups reporting data for that variable.
X̄ ± SD, mean ± standard deviation.
Range represents the means for each group from each study.
BMI, body mass index; Vo2max, maximum oxygen consumption; TC, total cholesterol; HDL-C, high-density lipoprotein cholesterol; LDL-C, low-density lipoprotein cholesterol; TG, triglycerides.
Menopausal status/HRT
Nine studies reported that all subjects were premenopausal,3,10,17,18,21,24,27,33,38 and another ten reported that all subjects were postmenopausal.8,12,22,25,29–31,34,36,40 Another four studies included both premenopausal and postmenopausal women and reported data for both groups combined.4,13,23,37 One other study included both premenopausal and postmenopausal women but reported data separately for each group.6 For those studies that included data on groups of postmenopausal women, seven reported that none of the subjects were taking any type HRT,8,22,25,30,31,34,40 and the other three reported one or more subjects were taking some type of HRT.12,29,36 We were unable to calculate the percentage of women taking HRT because of a lack of reported data.
Medication
Fourteen studies reported that none of the subjects were taking any type of medication that could affect lipids and lipoproteins,4,6,8,18,20,22,24,25,29–31,34,37,40 whereas ten studies reported that some of the subjects were taking some type of drug that could affect lipids and lipoproteins.10–12,17,21,23,32,33,36,38 Of these ten studies, two (20%) were limited to postmenopausal women.12,36
Cigarette smoking/alcohol
Eighteen studies reported that none of the subjects smoked cigarettes,4,10–12,14,15,17,18,24,26,28–31,33,34,38,40 and six reported that some of the subjects smoked.8,13,22,23,41,42 In relation to alcohol consumption, eight studies reported that some of the subjects consumed alcohol.5,8,13,15,17,23,31,38
Diet/physical activity
Eighteen studies reported that there were no changes in diet that could affect lipid and lipoprotein levels,5,8,10–13,18,22,24,26,29–34,36,41 and two studies reported that some of the subjects had changes in diet that could affect lipid and lipoprotein levels.23,40 One other study reported that there were no changes in diet that could affect lipid and lipoprotein levels in the exercise group but that changes in diet that could affect lipids and lipoproteins did occur in the control group.43 Thirty-six studies reported that none of the subjects were physically active prior to taking part in the study,4–7,9–12,14–22,24–35,37–43 two reported that some of the subjects were physically active,8,23 and one reported that all the subjects were physically active prior to taking part in the study.3 One other study reported that none of the subjects in the exercise group but some of the subjects in the control group were physically active prior to taking part in the study.13
Comorbidities
Seven studies reported that all the subjects were overweight/obese,14–18,21,28,40 and another two studies reported that all subjects had diabetes, one with non-insulin-dependent diabetes mellitus40 and another with insulin-dependent diabetes mellitus.42 One study reported that all subjects were hyperlipidemic,30 and none reported that all subjects had CVD.
Lipid assessment characteristics
Five studies reported assessment of lipids and lipoproteins in the sitting position,6,15,17,31,32 and another five studies reported assessment in the supine position.3,5,11,16,33 A total of eight studies reported the assessment of lipids and lipoproteins at least twice during each testing period.10,11,24,30–33,36 The number of hours that subjects fasted prior to the assessment of lipid and lipoproteins ranged from 9 to 14 hours (X̄ ± SD, 11.9 ± 0.95 hours), and the number of hours that exercise was avoided prior to the assessment of lipids and lipoproteins ranged from 12 to 72 hours (X̄ ± SD, 30.4 ± 19.1 hours). Twenty-two studies reported that they calculated LDL-C,3,5,6,10,12,16,17,18,19,21,24–26,28–33,36,42,43 and one reported the direct estimation of LDL-C.13
Training program characteristics
A description of the training program characteristics is shown in Table 3. Twenty-four groups from 19 studies (approximately 43%) used walking as the primary training modality,4,8–10,12,13,17,18,21,27–35,40 six groups from four studies used aerobic dance,6,14,19,41 five groups from three studies used jogging,5,32,39 two groups from two studies used cycling,42,43 and one group from one study used stair climbing.43 Another six groups from six studies participated primarily in a combination of walking and jogging,7,16,20,36,38,43 five groups from three studies participated in walking, jogging, and cycling,15,22,26 three groups from three studies participated in miscellaneous types of activities,11,37,43 and one group from one study each participated primarily in walking and aerobic dance23 or walking and cycling.25 As can be seen, compliance data were available for only 55% of the groups.
Table 3.
Training Program Characteristics
| Variable | na | X̄ ± SDb | Range |
|---|---|---|---|
| Length, weeks | 56 | 21.8 ± 19.5 | 8–104 |
| Frequency, times/week | 56 | 3.7 ± 1.1 | 1–6 |
| Intensity, %Vo2max | 48 | 69.2 ± 10.1 | 50–86 |
| Duration, min/session | 50 | 36.3 ± 13.2 | 15–75 |
| Compliance, %c | 31 | 86.1 ± 13.5 | 31–52 |
n, total number of groups reporting data for that variable.
X̄ ± SD, mean ± standard deviation.
Compliance, percentage of exercise sessions attended.
Primary outcomes
Results for primary outcomes are shown in Table 4 and Figure 1.
Table 4.
Primary and Secondary Outcomes
| Variable | na | X̄ ± SDb | 95% CIc | Qd | pe | I2f |
|---|---|---|---|---|---|---|
| Primary outcomes, mg/dl | ||||||
| TCg | 53 | −4.3 ± 1.3 | −6.9 to −1.7* | 148.6 | <0.001** | 65.0 |
| HDL-C | 56 | 1.8 ± 0.9 | 0.1 to 3.5* | 500.6 | <0.001** | 89.2 |
| LDL-C | 46 | −4.4 ± 1.1 | −6.5 to −2.2* | 108.3 | <0.001** | 58.5 |
| TG | 53 | −4.2 ± 2.1 | −8.4 to −0.1* | 244.6 | <0.001** | 78.7 |
| Secondary outcomes | ||||||
| Body weight, kg | 39 | −1.0 ± 0.2 | −1.5 to −0.6* | 35.2 | 0.60 | 0 |
| BMI, kg/m2 | 18 | −0.6 ± 0.2 | −0.9 to −0.3* | 19.9 | 0.28 | 14.6 |
| Body fat, % | 29 | −1.3 ± 0.3 | −1.9 to −0.7* | 76.4 | <0.001** | 63.4 |
| Vo2max, ml/kg−1/min−1 | 38 | 3.5 ± 0.4 | 2.7 to 4.2* | 302.6 | <0.001** | 87.8 |
n, total number of groups reporting data in which a treatment effect could be calculated.
X̄ ± SEM, mean ± standard error of the mean.
CI, confidence interval.
Q, heterogeneity value.
p, significance value for Q.
I2, percentage (%) of inconsistency for study results, calculated from Q statistic.
TC, total cholesterol; HDL-C, high-density lipoprotein cholesterol; LDL-C, low-density lipoprotein cholesterol; TG, triglycerides; BMI, body mass index; Vo2max, maximum oxygen consumption.
Significantly different from zero.
Statistically significant at p < 0.10.
Fig. 1.
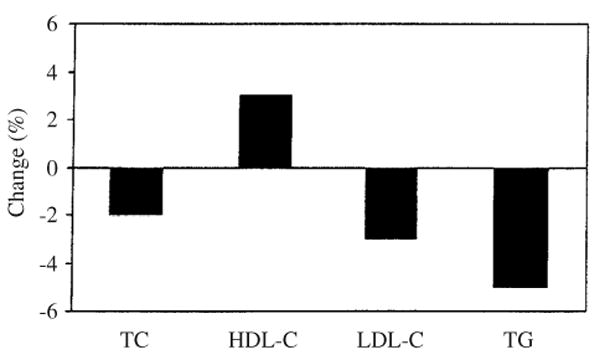
Relative changes (%) in lipids and lipoproteins (exercise minus control). TC, total cholesterol; HDL-C, high-density lipoprotein cholesterol; LDL-C, low-density lipoprotein cholesterol; TG, triglycerides.
TC
Across all categories, a statistically significant reduction of approximately 2% was observed. This reduction represents the difference between the pre to post changes in the exercise and control outcomes. No statistically significant publication bias was observed (p = 0.37). This suggests that our results were not biased toward positive results. With those groups in which one or more subjects were taking HRT deleted from the model, decreases in TC continued to be statistically significant (−4.4 ± 1.4 mg/dl, 95% CI −7.2 to −1.6 mg/dl). In addition, changes in TC remained statistically significant when we deleted the study in which all subjects were hyperlipidemic (−4.1 ± 1.4 mg/dl, 95% CI −6.8 to −1.4 mg/dl) as well as those groups in which changes in diet occurred (−4.4 ± 1.4 mg/dl, 95% CI −7.1 to −1.7 mg/dl). Furthermore, no statistically significant or clinically relevant differences were observed for those variables in which subgroup analyses were performed, including differences in TC between premenopausal and postmenopausal women (Qb = 0.03, p = 0.86), as well as those studies in which all subjects were not taking any type of medication that could affect lipids and lipoproteins vs. those studies in which one or more subjects were taking drugs that might affect lipids and lipoproteins (Qb = 2.9, p = 0.09). Greater reductions in TC were associated with more recent year of publication (R = 0.41, 99% CI 0.07 to 0.66) and decreases in percent body fat (R = 0.47, 99% CI 0.01 to 0.76). No other statistically significant or clinically relevant associations were found between decreases in TC and other variables that were regressed, including baseline values of TC (R = 0.17, 99% CI −0.19 to 0.49).
HDL-C
Across all categories, a statistically significant increase of approximately 3% was observed. No statistically significant publication bias was observed (p = 0.25). With those groups in which one or more subjects were taking HRT deleted from the model, increases in HDL-C continued to be statistically significant (1.6 ± 0.6 mg/dl, 95% CI 0.2 to 3.3 mg/dl). In addition, changes in HDL-C remained statistically significant when we deleted the study in which all subjects were hyperlipidemic (1.7 ± 0.9 mg/dl, 95% CI 0.2 to 3.5 mg/dl) as well as those groups in which changes in diet occurred (1.9 ± 0.9 mg/dl, 95% CI 0.2 to 3.8 mg/dl). No statistically significant or clinically relevant differences were observed for those variables in which subgroup analyses were performed, including differences in HDL-C between premenopausal and postmenopausal women (Qb = 0.18, p = 0.67), as well as those studies in which all subjects were not taking any type of medication that could affect lipids and lipoproteins vs. those studies in which one or more subjects were taking drugs that might affect lipids and lipoproteins (Qb = 0.2, p = 0.70). A statistically significant and positive association was observed between HDL-C and Vo2max, with greater increases in HDL-C associated with greater increases in Vo2max (R = 0.50, 99% CI 0.10 to 0.75). No other statistically significant or clinically relevant associations were found between increases in HDL-C and other variables that were regressed, including baseline values of HDL-C (R = 0.31, 99% CI −0.38 to 0.59).
LDL-C
Across all categories, a statistically significant reduction of approximately 3% was observed for LDL-C. No statistically significant publication bias was observed (p = 0.46). With those groups in which one or more subjects were taking HRT deleted from the model, decreases in LDL-C continued to be statistically significant (−4.2 ± 1.1 mg/dl, 95% CI −6.4 to −2.0 mg/dl). In addition, changes in LDL-C remained statistically significant when we deleted the study in which all subjects were hyperlipidemic (−4.4 ± 1.1 mg/dl, 95% CI −6.5 to −2.2 mg/dl) as well as those groups in which changes in diet occurred (−4.3 ± 1.1 mg/dl, 95% CI −6.5 to −2.0 mg/dl). No statistically significant or clinically relevant differences were found for those variables in which subgroup or regression analyses were performed, including differences in LDL-C between premenopausal and postmenopausal women (Qb = 0.32, p = 0.57), studies in which all subjects were not taking any type of medication that could affect lipids and lipoproteins vs. those studies in which one or more subjects were taking drugs that might affect lipids and lipoproteins (Qb = 0.2, p = 0.67), and baseline levels of LDL-C (R = 0.12, 99% CI −0.26 to 0.47).
TG
Across all categories, a statistically significant decrease in TG of approximately 5% was observed. No statistically significant publication bias was observed (p = 0.31). With those groups in which one or more subjects were taking HRT deleted from the model, decreases in TG continued to be statistically significant (−3.6 ± 2.0 mg/dl, 95% CI −7.7 to −0.1 mg/dl). In addition, changes in TG remained statistically significant when we deleted the study in which all subjects were hyperlipidemic (−4.2 ± 2.1 mg/dl, 95% CI −8.4 to −0.1 mg/dl) as well as those groups in which changes in diet occurred (−4.2 ± 2.0 mg/dl, 95% CI −8.7 to −0.2 mg/dl). No statistically significant or clinically relevant differences were observed for any of the subgroup analyses performed. Greater decreases in TG were associated with more recent year of publication (R = 0.38, 99% CI 0.04 to 0.64) and lower study quality (R = 0.44, 99% CI 0.10 to 0.68). No other statistically significant or clinically relevant differences or associations were found for those variables in which subgroup or regression analyses were performed, including differences in TG between premenopausal and postmenopausal women (Qb = 1.28, p = 0.28), those studies in which all subjects were not taking any type of medication that could affect lipids and lipoproteins vs. those studies in which one or more subjects were taking drugs that might affect lipids and lipoproteins (Qb = 0.7, p = 0.42), and baseline values of TG (R = 0.28, 99% CI −0.07 to 0.57).
Secondary outcomes
Secondary outcomes are shown in Table 4. As can be seen, statistically significant exercise minus control group decreases of approximately 2% were found for both body weight and BMI, whereas an approximately 4% decrease was observed for percent body fat. A statistically significant exercise minus control group increase of approximately 13% was found for Vo2max.
Discussion
The overall results of this study suggest that improvements of 2%–5% in lipids and lipoproteins can be expected as a result of an aerobic exercise program in women. However, although we found statistically significant improvements in TC, HDL-C, LDL-C, and TG, a moderate to large amount of heterogeneity was observed for all outcomes. For TC, some of this heterogeneity may be explained by the statistically significant associations we observed between decreases in TC with more recent year of publication and decreases in percent body fat. The association between decreases in TC with decreases in percent body fat suggests that some of the heterogeneity for changes in TC may be the result of differing changes in percent body fat across the different studies. In other words, greater decreases in body fat may have resulted in greater decreases in TC and, thus, greater heterogeneity in TC because of varying changes in percent body fat across the different studies. This leads us to question whether the decreases in TC were the result of the aerobic exercise program itself, the decreases in percent body fat that occurred as a result of the exercise program, or some combination of the two. Although the relationship between greater decreases in TC with decreases in percent body fat was not surprising, the relationship between greater decreases in TC with more recent year of publication was not expected. This latter relationship suggests that some other underlying factor(s) that we could not identify may be associated with changes in TC. Alternatively, our results could have been nothing more than a spurious finding, although we found the same relationship for TG.
Some of the heterogeneity in our HDL-C results may be partly explained by the association between increases in Vo2max with increases in HDL-C. In other words, greater increases in Vo2max may have resulted in greater increases in HDL-C and, thus, greater heterogeneity in HDL-C because of varying changes in HDL-C across the different studies. We were unable to identify any potential source or sources of heterogeneity for LDL-C, but it is important to note that the percentage of inconsistency for LDL-C was less than that of the other lipid and lipoprotein variables reported. Similar to changes in TC, the relationship between changes in TG and year of publication suggests that some other underlying factor(s) that we could not identify may be associated with changes in TG. In addition, lower-quality studies may have accounted for some of the heterogeneity in TG outcomes. However, the use of quality rating scales needs to be interpreted with extreme caution.45
The results of our meta-analysis differ some-what from the results of a previous meta-analysis published in 198944 dealing with the effects of exercise on lipids and lipoproteins in women. In this previous work, it was reported that exercise favorably altered TC and TG but not HDL-C or LDL-C. One possible reason for these discrepancies may have to do with differences in the inclusion criteria between the two studies. For example, in our current study, we limited our studies to randomized controlled trials, whereas the previous meta-analysis included randomized controlled trials, nonrandomized controlled trials, and uncontrolled trials. Another possible reason may have to do with different approaches used to analyze data in the two studies. For example, in our study we incorporated both between-study and within-study dispersion measures for estimating treatment effects, whereas the previous study limited its analysis to between-study dispersion only.
The most recent National Cholesterol Education Report on Detection, Evaluation, and Treatment of High Blood Cholesterol in Adults includes a recommendation of increased physical activity for improving lipids and lipoproteins.2 As the vast majority of studies included in this meta-analysis appeared to follow the American College of Sports Medicine Guidelines for developing and maintaining cardiorespiratory fitness in adults,57 in would seem appropriate to suggest that improvements of 2%–5% in lipids and lipoproteins could be expected by adhering to these guidelines. This includes aerobic exercise performed 3–5 days per week for 20–60 continuous minutes at an intensity of 55%–90% of maximum heart rate, with lower intensity levels recommended for those who are more unfit. The use of aerobic exercise may be especially appropriate because numerous other benefits can be derived from it,58 and the risk of injury, especially for walking, is generally low.59 The former not with-standing, it is important to note that with the exception of LDL-C, the clinical importance of the changes for each of the lipids and lipoproteins observed in this study is not well known. For LDL-C, it has been suggested that for every 1% decrease, the relative risk for major coronary heart disease (CHD) events is reduced by approximately 1%.2 As we found an approximate 3% decrease in LDL-C, we could expect an approximate 3% decrease in the relative risk for major CHD events. However, for those subjects in whom greater reductions are necessary, other types of lifestyle (e.g., diet) and pharmacological (e.g., statins) interventions may be necessary in conjunction with increased physical activity.2
Meta-analysis, like any other type of review, is limited by the available data. In fact, this is one of the major reasons for conducting a meta-analysis, that is, to use a quantitative approach for the purpose of providing directions for future research. For example, only one included study reported that all their female subjects were hyperlipidemic.30 Because higher levels of lipids and lipoproteins increase one's risk for morbidity and mortality from CVD,2 it would seem appropriate to suggest that future aerobic exercise training studies increase their focus on those women with elevated levels. Furthermore, as none of the included studies limited their inclusion criteria to women with CVD, future studies should consider such.
There was a lack of specific information about the timing of the menstrual cycle during the assessment of lipids and lipoproteins. This timing may be important because lipids and lipoproteins can vary depending on the phase of the menstrual cycle.60 Therefore, it is suggested that future studies report, and editors publish, information about the timing of the menstrual cycle when assessing lipids and lipoproteins in women. Furthermore, it was sometimes difficult to discern if the women were taking any type of pharmacological intervention other than lipid-lowering agents that could affect lipids and lipoproteins (e.g., oral contraceptives, estrogen replacement therapy). These agents can affect lipids and lipoproteins, and it is suggested that future studies include, and editors publish, information about this. Finally, only two studies appeared to use the intention-to-treat approach in the analysis of their data.13,38 Thus, although aerobic exercise may be efficacious for reducing lipids and lipoproteins in women, we cannot reach any definitive conclusions about its effectiveness. Therefore, it would appear plausible to suggest that future studies include results using both intention-to-treat and analysis-by-protocol approaches.
In conclusion, the results of this study suggest that, overall, aerobic exercise is efficacious for improving TC, HDL-C, LDL-C, and TG in women.
Acknowledgments
This study was supported by a grant from the NIH National Heart, Lung and Blood Institute, award RO1-HL069802 (G.A. Kelley, Principal Investigator).
We thank William Haskell, Ph.D., Stanford University, for reviewing our reference list and providing suggestions for the coding of studies.
References
- 1.Arias A, Anderson RN, Hsiang-Ching K, et al. National vital statistics reports. 3. Vol. 52. Hyattsville, MD: National Center for Health Statistics; 2003. Deaths: Final data for 2001. [PubMed] [Google Scholar]
- 2.National Cholesterol Education Program, National Heart Lung and Blood Institute, National Institutes of Health. Third Report of the National Cholesterol Education Program (NCEP) Expert Panel on Detection, Evaluation, and Treatment of High Blood Cholesterol in Adults (Adult Treatment Panel III) Final Report. Circulation. 2002;106:3143. [PubMed] [Google Scholar]
- 3.Agren JJ, Pekkarinen H, Litmanen H, Hanninen O. Fish diet and physical fitness in relation to membrane and serum lipids, prostanoid metabolism and platelet aggregation in female students. Eur J Appl Physiol Occup Physiol. 1991;63:393. doi: 10.1007/BF00364468. [DOI] [PubMed] [Google Scholar]
- 4.Aldred HE, Hardman AE, Taylor S. Influence of 12 weeks of training by brisk walking on postprandial lipemia and insulinemia in sedentary middle-aged women. Metabolism. 1995;44:390. doi: 10.1016/0026-0495(95)90172-8. [DOI] [PubMed] [Google Scholar]
- 5.Allison TG, Iammarino RM, Metz KF, Skrinar GS, Kuller LH, Robertson RJ. Failure of exercise to increase high-density lipoprotein cholesterol. J Cardiac Rehabil. 1981;1:257. [Google Scholar]
- 6.Baker SJ, Al-Najadah R. Effect of ingesting fish oil on serum lipid and lipoprotein concentration in exercising and non-exercising women. Sports Med Train Rehabil. 1996;6:287. [Google Scholar]
- 7.Busby J, Notelovitz M, Putney K, Grow T. Exercise, high-density lipoprotein cholesterol, and cardiorespiratory function in climacteric women. South Med J. 1985;78:769. doi: 10.1097/00007611-198507000-00003. [DOI] [PubMed] [Google Scholar]
- 8.Cauley JA, Kriska AM, LePorte RE, Sandler RB, Pambianco G. A two year randomized exercise trial in older women: Effects on HDL cholesterol. Atherosclerosis. 1987;66:247. doi: 10.1016/0021-9150(87)90068-2. [DOI] [PubMed] [Google Scholar]
- 9.Davison RCR, Grant S. The physiological effect of a 14 week walking programme on sedentary middle-aged women. J Sports Sci. 1995;13:24. [Google Scholar]
- 10.Duncan JJ, Gordon NF, Scott CB. Women walking for health and fitness. JAMA. 1991;266:3295. [PubMed] [Google Scholar]
- 11.Edin JB, Gerberich SG, Leon AS, et al. Analysis of the training effects of minitrampoline rebounding on physical fitness, body composition, and blood lipids. J Cardiopulm Rehabil. 1990;10:401. [Google Scholar]
- 12.Fahlman MM, Boardley D, Lambert CP, Flynn MG. Effects of endurance training and resistance training on plasma lipoprotein profiles in elderly women. J Gerontol A Biol Sci Med Sci. 2002;57:B54. doi: 10.1093/gerona/57.2.b54. [DOI] [PubMed] [Google Scholar]
- 13.Furukawa F, Kazuma K, Kawa M, et al. Effects of an off-site walking program on energy expenditure, serum lipids, and glucose metabolism in middle-aged women. Biol Res Nurs. 2003;4:181. doi: 10.1177/1099800402239623. [DOI] [PubMed] [Google Scholar]
- 14.Gillett PA, Caserta MS, White AT, Martinson L. Responses of 49- to 59-year old sedentary, overweight women to four months of exercise conditioning and/or fitness education. Activities Adaptation Aging. 1995;19:13. [Google Scholar]
- 15.Grandjean PW, Oden GL, Crouse SF, Brown JA, Green JS. Lipid and lipoprotein changes in women following 6 months of exercise training in a worksite fitness program. J Sports Med Phys Fitness. 1996;26:54. [PubMed] [Google Scholar]
- 16.Hagan RD, Upton SJ, Wong L, Whittam J. The effects of aerobic conditioning and/or caloric restriction in overweight men and women. Med Sci Sports Exerc. 1986;18:87. [PubMed] [Google Scholar]
- 17.Hinkleman LL, Nieman DC. The effects of a walking program on body composition and serum lipids and lipoproteins in overweight women. J Sports Med Phys Fitness. 1993;33:49. [PubMed] [Google Scholar]
- 18.Hopewell R. Dissertation. Morgantown, WV: West Virginia University; 1989. The effect of fiber and exercise on weight loss and blood lipids in moderately overweight women. [Google Scholar]
- 19.Isler AK, Kosar SN, Korkusuz F. Effects of step aerobics and aerobic dancing on serum lipids and lipoproteins. J Sports Med Phys Fitness. 2001;41:380. [PubMed] [Google Scholar]
- 20.Juneau M, Rogers F, De Santos V, et al. Effectiveness of self-monitored, home-based, moderate-intensity exercise training in middle-aged men and women. Am J Cardiol. 1987;60:66. doi: 10.1016/0002-9149(87)90986-6. [DOI] [PubMed] [Google Scholar]
- 21.Keller C, Trevino RP. Effects of two frequencies of walking on cardiovascular risk factor reduction in Mexican American women. Res Nurs Health. 2001;24:390. doi: 10.1002/nur.1039. [DOI] [PubMed] [Google Scholar]
- 22.King AC, Haskell WL, Taylor CB, Kraemer HC, De-Busk RF. Group- vs home-based exercise training in healthy older men and women: A community-based clinical trial. JAMA. 1991;266:1535. [PubMed] [Google Scholar]
- 23.Lee C, White SW. Controlled trial of a minimal investigation exercise program for middle-aged working women. Psychol Health. 1979;12:361. [Google Scholar]
- 24.LeMura LM, von Duvillard SP, Andreacci J, Klebez JM, Chelland SA, Russo J. Lipid and lipoprotein profiles, cardiovascular fitness, body composition, and diet during and after resistance, aerobic and combination training in young women. Eur J Appl Physiol. 2000;82:451. doi: 10.1007/s004210000234. [DOI] [PubMed] [Google Scholar]
- 25.Lindheim SR, Notelovitz M, Feldman EB, Larsen S, Khan FY, Lobo RA. The independent effects of exercise and estrogen on lipids and lipoproteins on postmenopausal women. Obstet Gynecol. 1994;83:167. [PubMed] [Google Scholar]
- 26.Lovelady CA, Nommsen-Rivers LA, McCrory MA, Dewey KG. Effects of exercise on plasma lipids and metabolism of lactating women. Med Sci Sports Exerc. 1995;27:22. [PubMed] [Google Scholar]
- 27.Miller CW. Dissertation. Pittsburgh, PA: University of Pittsburgh; 1995. The effects of various caloric expenditures per week at moderate levels of exercise training intensity on coronary risk factors in women. [Google Scholar]
- 28.Nieman DC, Brock DW, Butterworth D, Utter AC, Nieman CC. Reducing diet and/or exercise training decreases the lipid and lipoprotein risk factors of moderately obese women. J Am Coll Nutr. 2002;21:344. doi: 10.1080/07315724.2002.10719233. [DOI] [PubMed] [Google Scholar]
- 29.Nieman DC, Warren BJ, O'Donnell KA, Dotson RG, Butterworth DE, Henson DA. Physical activity and serum lipids and lipoproteins in elderly women. J Am Geriatr Soc. 1993;41:1339. doi: 10.1111/j.1532-5415.1993.tb06485.x. [DOI] [PubMed] [Google Scholar]
- 30.Ready EA, Drinkwater DT, Ducas J, Fitzpatrick DW, Brerton DG, Oades SC. Walking program reduces elevated cholesterol in women postmenopause. Can J Cardiol. 1995;11:905. [PubMed] [Google Scholar]
- 31.Ready EA, Naimark B, Ducas J, et al. Influence of walking volume on health benefits in women postmenopause. Med Sci Sports Exerc. 1996;28:1097. doi: 10.1097/00005768-199609000-00004. [DOI] [PubMed] [Google Scholar]
- 32.Santiago MC, Alexander JF, Stull GA, Serfass RC, Hayday AM, Leon AS. Physiological responses of sedentary women to a 20-week conditioning program of walking or jogging. Scand J Sports Sci. 1987;9:33. [Google Scholar]
- 33.Santiago MC, Leon AS, Serfass RC. Failure of 40 weeks of brisk walking to alter blood lipids in normolipemic women. Can J Appl Physiol. 1995;20:417. doi: 10.1139/h95-033. [DOI] [PubMed] [Google Scholar]
- 34.Seals DR, Tanaka H, Clevenger CM, et al. Blood pressure reductions with exercise and sodium restriction in postmenopausal women with elevated systolic pressure: Role of arterial stiffness. J Am Coll Cardiol. 2001;38:506. doi: 10.1016/s0735-1097(01)01348-1. [DOI] [PubMed] [Google Scholar]
- 35.Sinatra ST, Allen GJ, Camaione DJ, Abraham A. Effects of continuous passive motion, walking, and a placebo intervention on physical and psychological well-being. J Cardiopulm Rehabil. 1990;10:279. [Google Scholar]
- 36.Stefanick ML, Mackey S, Sheehan M, Ellsworth N, Haskell WL, Wood PD. Effects of diet and exercise in men and postmenopausal women with low levels of HDL cholesterol and high levels of LDL cholesterol. N Engl J Med. 1998;339:12. doi: 10.1056/NEJM199807023390103. [DOI] [PubMed] [Google Scholar]
- 37.Sugiura H, Sugiura H, Kajima K, Mirbod SM, Iwata H, Matsuoka T. Effects of long-term moderate exercise and increase in number of daily steps on serum lipids in women: Randomised controlled trial. BMC Wom Health. 2002;2:3. doi: 10.1186/1472-6874-2-3. [DOI] [PMC free article] [PubMed] [Google Scholar]
- 38.Suter E, Marti B. Little effect of long-term, self-monitored exercise on serum lipids in middle-aged women. J Sports Med Phys Fitness. 1992;32:400. [PubMed] [Google Scholar]
- 39.Thomas TR, Adeniran SB, Etheridge GL. Effects of different running programs on Vo2max, percent fat, and plasma lipids. Can J Appl Sport Sci. 1984;9:55. [PubMed] [Google Scholar]
- 40.Verity LS, Ismail AH. Effects of exercise on cardiovascular disease risk in women with NIDDM. Diabetes Res Clin Pract. 1989;6:27. doi: 10.1016/0168-8227(89)90054-5. [DOI] [PubMed] [Google Scholar]
- 41.Vetro VL. Masters Thesis. Springfield, MA: Springfield College; 1990. The effects of aerobic dance exercise and nutrition intervention on cholesterol levels. [Google Scholar]
- 42.Wallberg-Henriksson H, Gunnarsson R, Rossner S, Wahren J. Long-term physical training in female type 1 (insulin-dependent) diabetic patients: Absence of significant effect on glycaemic control and lipoprotein levels. Diabetologia. 1986;29:53. doi: 10.1007/BF02427281. [DOI] [PubMed] [Google Scholar]
- 43.Ziemer B. Masters Thesis. La Crosse, WI: University of Wisconsin-La Crosse; 1996. The effects of a 12 week training program utilizing various modes of home exercise equipment on cholesterol and triglyceride levels. [Google Scholar]
- 44.Lokey EA, Tran ZV. Effects of exercise training on serum lipid and lipoprotein concentration in women: A meta-analysis. Int J Sports Med. 1989;10:424. doi: 10.1055/s-2007-1024937. [DOI] [PubMed] [Google Scholar]
- 45.Alderson P, Green S, Higgins JPT, editors. [January 31, 2004];Cochrane reviewers' handbook 4.2.1 (updated December 2003) www.cochrane.org/resources/handbook/hbook.htm.
- 46.Mann GV, Teel K, Hayes O, McNally A, Bruno D. Exercise in the disposition of dietary calories: Regulation of serum lipoprotein and cholesterol levels in human subjects. N Engl J Med. 1955;253:349. doi: 10.1056/NEJM195509012530901. [DOI] [PubMed] [Google Scholar]
- 47.Cohen J. Weighted kappa: Nominal scale agreement with provision for scaled disagreement or partial credit. Psychol Bull. 1968;70:213. doi: 10.1037/h0026256. [DOI] [PubMed] [Google Scholar]
- 48.Follmann D, Elliott P, Suh I, Cutler J. Variance imputation for overviews of clinical trials with continuous response. J Clin Epidemiol. 1992;45:769. doi: 10.1016/0895-4356(92)90054-q. [DOI] [PubMed] [Google Scholar]
- 49.Dersimonian R, Laird N. Meta-analysis in clinical trials. Controlled Clin Trials. 1986;7:177. doi: 10.1016/0197-2456(86)90046-2. [DOI] [PubMed] [Google Scholar]
- 50.Hunter JE, Schmidt FL. Fixed effects vs. random effects meta-analysis models: Implications for cumulative research knowledge. Int J Sel Assess. 2000;8:275. [Google Scholar]
- 51.Cochran WG. The combination of estimates from different experiments. Biometrics. 1954;10:101. [Google Scholar]
- 52.Higgins JPT, Thompson SG, Deeks JJ, Altman DG. Measuring inconsistency in meta-analyses. Br Med J. 2003;327:557. doi: 10.1136/bmj.327.7414.557. [DOI] [PMC free article] [PubMed] [Google Scholar]
- 53.Egger M, Davey Smith G, Schneider M, Minder C. Bias in meta-analysis detected by a simple graphical test. Br Med J. 1997;315:629. doi: 10.1136/bmj.315.7109.629. [DOI] [PMC free article] [PubMed] [Google Scholar]
- 54.Jadad AR, Moore RA, Carroll D, et al. Assessing the quality of reports of randomized clinical trials: Is blinding necessary? Controlled Clin Trials. 1996;17:1. doi: 10.1016/0197-2456(95)00134-4. [DOI] [PubMed] [Google Scholar]
- 55.Moher D, Jadad AR, Nichol G, Penman M, Tugwell P, Walsh S. Assessing the quality of randomized controlled trials: An annotated bibliography of scales and checklists. Controlled Clin Trials. 1995;16:62. doi: 10.1016/0197-2456(94)00031-w. [DOI] [PubMed] [Google Scholar]
- 56.Lipsey MW, Wilson DB. Practical meta-analysis. Thousand Oaks, CA: Sage; 2001. [Google Scholar]
- 57.American College of Sports Medicine. The recommended quantity and quality of exercise for developing and maintaining cardiorespiratory and muscular fitness, and flexibility in healthy adults. Med Sci Sports Exerc. 1998;30:975. doi: 10.1097/00005768-199806000-00032. [DOI] [PubMed] [Google Scholar]
- 58.Booth FW, Gordon SE, Carlson CJ, Hamilton MT. Waging war on modern chronic diseases: Primary prevention through exercise biology. J Appl Physiol. 2000;88:774. doi: 10.1152/jappl.2000.88.2.774. [DOI] [PubMed] [Google Scholar]
- 59.Hootman JM, Macera CA, Ainsworth BE, Martin M, Addy CL, Blair SN. Association among physical activity level, cardiorespiratory fitness, and risk of musculoskeletal injury. Am J Epidemiol. 2001;154:251. doi: 10.1093/aje/154.3.251. [DOI] [PubMed] [Google Scholar]
- 60.Krummell D, Etherton TD, Peterson S, Kris-Etherton PM. Effects of exercise on plasma lipids and lipoproteins of women. Proc Soc Exp Biol Med. 1993;204:123. doi: 10.3181/00379727-204-43644. [DOI] [PubMed] [Google Scholar]