

Abstract
This study examines perceptions of the “typical American” from 49 cultures around the world. Contrary to the ethnocentric bias hypothesis, we found strong agreement between in-group and out-group ratings on the American profile (assertive, open-minded, but antagonistic); Americans in fact had a somewhat less desirable view of Americans than did others. Within cultures, in-group ratings were not systematically more favorable than out-group ratings. The Iraq invasion had a slight negative effect on perceptions of the typical American, but people around the world seem to draw a clear distinction between U.S. foreign policy and the character of the American people. National character stereotypes appear to have a variety of sources and to be perpetuated by both cognitive mechanisms and socio-cultural forces.
Keywords: national character stereotypes, personality traits, cross-cultural, stereotype change, auto- and hetero-stereotype agreement
National character stereotypes are shared beliefs about the personality traits of members of a culture.1 Are they accurate? Are Americans assertive, Canadians agreeable, the British reserved, the Japanese deferential? Clearly, these attributions are false if they are taken to characterize every member of a culture, because there is a range of individual differences in all nations. However, stereotypes are often thought to have a kernel of truth, and whether they are accurate in some degree is an empirical question (Lee, Jussim, & McCauley, 1995; Schneider, 2004). Accurate stereotypes could readily be explained: People must observe others, infer personality traits, compare notes with their compatriots, and formulate more-or-less adequate generalizations. But if national character stereotypes do not reflect real personality traits, how do they arise and come to be so widely believed?
In his classic analysis of the nature of prejudice, Allport (1954) argued that stereotypical beliefs originate from actual group differences, magnified and distorted by prejudicial attitudes. Campbell (1967) expressed similar views: “If there are group differences in social interaction, these will tend to appear in the stereotypes groups have of each other … [but] stereotypes are concomitantly projections of the motives and concerns of the stereotype holder” (p. 827). Some stereotypes do seem to have a grain of truth. Cross-cultural research has shown that beliefs about sex differences in personality traits are widely shared across cultures (Williams & Best, 1982) and are broadly consistent—in direction, if more or less exaggerated in degree—with actual personality differences between men and women (Costa, Terracciano, & McCrae, 2001; Swim, 1994). However, a recent cross-cultural study from the Personality Profiles of Cultures Project (see McCrae et al., 2005a, 2005b) called into question the kernel-of-truth hypothesis when applied to national character stereotypes (Terracciano et al., 2005). Analyses within and across 49 cultures, comparing aggregate personality traits from student and adult samples with ratings of the “typical” in-group member, clearly indicated that national character stereotypes have no basis in reality. Americans and Canadians, for example, have profound differences in perceived national character despite very similar assessed personality profiles.
Terracciano and colleagues (2005) also obtained ratings of perceptions of Americans, which we examine in the current study to address two major questions about national character stereotypes. First, we consider whether in-group and out-group perceptions of national character are determined chiefly by ethnocentric bias and xenophobic prejudice, or whether they are better regarded as a set of common beliefs shared across cultures. Ethnocentric biases should be seen in the selective attribution of favorable traits to the members of one’s own culture and unfavorable traits to members of other cultures, especially if those out-groups are remote or hostile.
Second, we examine the effect of a significant historical event to see if world perceptions of a people are shaped by the actions of their government. Government policies, either foreign or domestic, might well be construed as an expression of national character. For example, there is some evidence that America’s aid to post-War Europe through the Marshall Plan might have led Europeans to believe that Americans were a generous and compassionate people (Buchanan & Cantril, 1953). By chance, the time period in which national character data were collected for the Personality Profiles of Cultures Project encompassed the American-led invasion of Iraq, an act to which world opinion responded strongly. Did the invasion reshape perceptions of American national character?
Answers to these questions require valid measures of national character, that is, measures that accurately reflect perceptions of the traits typical of a country’s citizens (even if those perceptions are themselves wholly illusory). In this project national character was assessed by scales that define the major dimensions of the comprehensive Five-Factor Model (FFM; McCrae & John, 1992) of personality. The FFM is a widely accepted hierarchical model with higher-order factors generally called Neuroticism, Extraversion, Openness, Agreeableness, and Conscientiousness. There is less consensus on the lower-order traits, but one widely-used instrument, the Revised NEO Personality Inventory (NEO-PI-R; Costa & McCrae, 1992), defines each of the five factors by six more specific traits or facets. Terracciano and colleagues (2005) developed a new measure of national stereotypes, the National Character Survey (NCS), consisting of a set of 30 bipolar scales intended to parallel the 30 facets of the NEO-PI-R. To the extent that the FFM is a comprehensive model of personality, the NCS should measure the key features of national character.
Study 1: Ethnocentric Bias and In-Group/Out-Group Agreement
Lee, McCauley, and Jussim (1995) pointed out that national character stereotypes are often dismissed as simple expressions of ethnocentric biases. This is an old idea: Herodotus claimed that the Persians “considered themselves in every way superior to everyone else in the world” (trans. 1954, p. 97). A simple and plausible theory of the origin of national stereotypes would hold that people everywhere attribute good qualities to themselves and perhaps to their allies, and hold negative evaluations of the citizens of competing or hostile nations. One of the best examples of ethnocentric biases emerged in a survey study of intergroup attitudes among 30 ethnic groups in East Africa conducted by Brewer and Campbell (1976). They found that almost all respondents rated their own group more favorably than any out-group. Similarly, Koomen and Bahler (1996) re-examined 1963 survey data in six large European countries and concluded “that different European nationalities … judged their own groups in a more positive way than they judged other groups” (p. 325).
Ethnocentric biases might have several explanations. Prejudicial attitudes can be exacerbated by intergroup competition for limited resources or by opposing ideologies (Sherif, 1966). Such ethnocentric views are sometimes deliberately inculcated as a part of wartime propaganda (cf. Steiner, 2005) and can have a significant impact on interactions among nations (Brewer, 2003). Alternatively, favoritism toward in-group members may be derived mainly from the basic need for a positive social identity (Tajfel, 1981; Brewer, 1999).
However, national character stereotypes of in-group members are not necessarily positive (e.g., Karlins, Coffman, & Walters, 1969). The in-group ratings examined in Terracciano et al. (2005) showed a combination of more and less socially desirable traits in almost all of the 49 cultures’ profiles.2 For example, Americans perceived themselves as both assertive (a desirable trait) and disagreeable (an undesirable trait); Indonesians reported that they were agreeable, but not conscientious; Argentines reported a rather undesirable profile, describing themselves as impulsive, arrogant, and careless (Terracciano et al., 2005). The inference that national character profiles are generally mixed assumes that cultures everywhere agree on which traits are desirable. Powerful evidence of such pancultural agreement was provided by Williams, Satterwhite, and Saiz (1998), who gathered favorability ratings of trait adjectives in 10 diverse nations and found between-country correlations ranging from .68 to .95 (Mdn = .82). For example, in all cultures examined, friendly and responsible were highly favorable, ambitious somewhat favorable, and arrogant unfavorable. Still, ethnocentric biases might be expressed in the different psychological importance that each culture associates with traits (Williams et al., 1998). It is possible that in-group members regard as more important or pay more attention to some group-defining traits (Campbell, 1967). The data we collected for this study do not address this possibility.
The ethnocentric bias interpretation of national stereotypes suggests that in-group perceptions should differ systematically from out-group perceptions of national character, but data instead tend to support the view of convergence (Boster & Maltseva, 2006). Abate and Berrien (1967) found very high agreement between Japanese and American raters on the national character of those two cultures, and similar results were reported by Krueger (1996) for American and Italian, and by Church and Katigbak (2002) for American and Filipino, raters. Peabody (1985), in one of the largest studies in the field, found European raters from several countries generally agreed on the national character of European nations, the U.S., and Russia.
Such agreement presupposes familiarity with the people—or stereotypes about the people—in the countries rated. Americans probably have a much clearer idea of Canadians than of Argentines. In line with these expectations, Gilbert (1951) and Karlins and colleagues (1969) both noted that American students had difficulty rating Turks, as indicated by refusals to characterize them and limited agreement among raters who did complete the task.
Method
In the Personality Profiles of Cultures Project design, respondents from each culture described the typical member of their in-group, and then the typical American (fortunately for this study, a culture generally familiar to raters around the world). We examined the responses of 3,743 individuals (chiefly college students) who completed a valid NCS describing the typical American. Sample sizes for each culture ranged from 34 to 351 (M = 73.2; see Table 1). Additional information on study design and sample characteristics are provided elsewhere (Terracciano et al., 2005).
Table 1.
Sample Description, National Character Survey Mean Ratings of Americans, and Intraclass Correlations between Americans’ In-group Ratings and Other Cultures’ Ratings of Americans
| NCS Means
|
|||||||||
|---|---|---|---|---|---|---|---|---|---|
| Culture | Language | n | Date | N | E | O | A | C | ICC |
| In-Group Ratings of Americans | |||||||||
| United States (4) | English | 351 | Sep-03/Apr-04 | 51.6 | 52.8 | 51.1 | 42.6 | 48.6 | — |
| Ratings Before Iraq Invasion | |||||||||
| Belgium | Flemish | 75 | Mar-03 | 49.0 | 52.0 | 46.8 | 43.6 | 48.9 | .57*** |
| Burkina Faso | French | 47 | Jan-03 | 43.5 | 56.9 | 66.4 | 42.9 | 60.5 | .33 |
| Indonesia | Indonesian | 62 | Mar-03 | 39.7 | 56.0 | 62.9 | 43.6 | 62.2 | .27 |
| Malta | English | 49 | Nov-02 | 39.3 | 59.8 | 62.5 | 43.2 | 56.4 | .36* |
| Philippines | Filipino | 46 | Jan-03 | 44.5 | 51.9 | 57.5 | 36.0 | 57.3 | .42* |
| Poland | Polish | 49 | Mar-03 | 38.5 | 58.9 | 54.9 | 39.4 | 52.4 | .49** |
| South Korea | Korean | 52 | Nov-02 | 44.3 | 54.7 | 59.0 | 36.8 | 56.0 | .44* |
| Switzerland | French | 65 | Mar-03 | 49.5 | 52.9 | 46.0 | 40.3 | 49.5 | .73*** |
| Turkey | Turkish | 59 | Dec-02 | 42.9 | 46.7 | 53.3 | 40.4 | 52.4 | .43* |
| Uganda | English | 41 | Nov-02 | 46.1 | 53.4 | 57.9 | 47.8 | 55.1 | .21 |
| UK: N. Ireland | English | 45 | Feb-03 | 42.7 | 60.0 | 60.4 | 48.9 | 50.2 | .36 |
| Ratings After Iraq Invasion | |||||||||
| Argentina | Spanish | 50 | Apr-04 | 50.6 | 40.9 | 37.7 | 34.3 | 56.6 | .18 |
| Australia | English | 52 | May-03 | 51.6 | 55.8 | 47.7 | 37.3 | 54.6 | .68*** |
| Botswana | English | 66 | Sep-03 | 47.9 | 54.4 | 59.8 | 43.5 | 54.9 | .49** |
| Brazil (3) | Portuguese | 139 | Jun-03/Oct-03 | 51.8 | 43.4 | 45.6 | 33.5 | 56.0 | .28 |
| Canada (3) | English | 229 | Mar-03/Mar-04 | 50.3 | 53.7 | 48.3 | 36.8 | 49.9 | .76*** |
| Chile | Spanish | 47 | May-03 | 48.0 | 50.4 | 48.7 | 39.7 | 58.9 | .44* |
| China | Chinese | 44 | Jan-04 | 49.6 | 59.3 | 65.8 | 46.6 | 51.4 | .43* |
| Croatia | Croatian | 47 | May-03 | 49.2 | 51.0 | 48.5 | 40.8 | 55.4 | .59*** |
| Czech Republic | Czech | 71 | May-03 | 43.1 | 58.1 | 50.9 | 39.4 | 52.7 | .56** |
| Denmark | Danish | 62 | Nov-03 | 46.2 | 56.2 | 49.2 | 46.0 | 50.8 | .56** |
| Estonia | Estonian | 46 | Oct-03 | 45.0 | 59.2 | 52.2 | 50.0 | 47.8 | .36* |
| Ethiopia (2) | English | 89 | Jun-03 | 41.7 | 59.1 | 63.0 | 46.9 | 57.9 | .13 |
| France | French | 65 | Apr-04 | 49.3 | 53.0 | 48.2 | 42.4 | 51.5 | .74*** |
| Germany | German | 83 | May-03 | 47.4 | 55.2 | 46.1 | 44.9 | 45.1 | .52** |
| Hong Kong | Chinese | 92 | May-03 | 43.9 | 57.4 | 63.3 | 44.3 | 50.1 | .48** |
| Hungary | Hungarian | 49 | Jan-04 | 40.8 | 54.5 | 52.4 | 45.1 | 51.4 | .48** |
| Iceland | Icelandic | 181 | Dec-03 | 50.8 | 49.8 | 48.1 | 44.9 | 45.9 | .42* |
| India | English | 44 | Dec-03 | 50.1 | 51.9 | 51.6 | 46.2 | 51.9 | .43* |
| Japan | Japanese | 49 | Sep-03 | 42.0 | 61.9 | 66.7 | 43.6 | 49.5 | .35 |
| Kuwait | Arabic | 63 | May-03 | 45.0 | 55.0 | 59.6 | 45.9 | 58.8 | .18 |
| Malaysia | Malay | 81 | Jun-03 | 42.4 | 60.3 | 58.6 | 36.5 | 55.0 | .43* |
| Morocco | English | 50 | Apr-03 | 47.5 | 48.1 | 55.2 | 51.0 | 49.6 | .03 |
| New Zealand (2) | English | 161 | Mar-03/May-03 | 49.2 | 54.7 | 51.8 | 41.0 | 51.1 | .82*** |
| Nigeria | English | 36 | Jan-04 | 42.1 | 57.1 | 62.7 | 54.5 | 65.1 | −.20 |
| Peru | Spanish | 45 | Nov-04 | 46.0 | 49.5 | 51.8 | 40.9 | 56.7 | .40* |
| Portugal | Portuguese | 44 | Jun-03 | 49.8 | 49.0 | 54.4 | 36.0 | 55.4 | .57*** |
| Puerto Rico | Spanish | 34 | Oct-04 | 46.2 | 37.8 | 49.2 | 46.7 | 55.7 | .04 |
| Russia | Russian | 50 | Dec-03 | 48.7 | 43.4 | 46.3 | 37.9 | 56.8 | .31 |
| Serbia | Serbian | 66 | Dec-03 | 48.0 | 47.5 | 44.5 | 39.8 | 55.1 | .35* |
| Slovakia | Slovak | 47 | Nov-03 | 43.2 | 56.2 | 52.7 | 41.1 | 46.4 | .62*** |
| Slovenia | Slovene | 88 | Nov-04 | 50.4 | 55.1 | 52.1 | 40.9 | 46.9 | .65*** |
| Spain | Spanish | 46 | Apr-03 | 52.4 | 47.1 | 43.8 | 35.7 | 54.6 | .51** |
| Sweden | Swedish | 46 | Oct-03 | 44.7 | 57.9 | 52.7 | 45.0 | 51.1 | .52** |
| Switzerland | German | 193 | Oct-03 | 48.0 | 54.9 | 45.2 | 45.4 | 44.0 | .45* |
| UK: England | English | 50 | Dec-03 | 44.5 | 58.1 | 50.9 | 45.6 | 48.1 | .53** |
| Ratings Before and After Iraq Invasion | |||||||||
| Italy | Italian | 50 | Dec-02 | 47.9 | 52.0 | 48.2 | 44.4 | 55.8 | .52** |
| Italy | Italian | 46 | Mar-03 | 47.2 | 48.8 | 45.5 | 41.6 | 55.6 | .52** |
| Lebanon | English | 54 | Oct-02 | 47.2 | 49.2 | 53.6 | 46.1 | 54.9 | .34 |
| Lebanon | English | 47 | Apr-03 | 49.4 | 47.5 | 52.2 | 45.9 | 50.3 | .31 |
Note. Multiple sites for a culture are indicated in parentheses. Mean NCS scales are expressed as T-scores (M = 50; SD = 10) using international in-group norms. N = Neuroticism; E =Extraversion; O = Openness; A = Agreeableness; C = Conscientiousness; NCS = National Character Survey; ICC = intraclass correlation between Americans’ in-group ratings and other cultures’ ratings of Americans.
p < .05.
p < .01.
p < .001.
National character stereotypes were assessed using the NCS, a short questionnaire consisting of 30 bipolar scales with two or three adjectives or phrases at each pole of the scale (Terracciano et al., 2005). For example, the first item asks how likely it is that the typical American is anxious, nervous, worrying vs. at ease, calm, relaxed. Each 5-point scale taps one of the 30 facets assessed by the NEO-PI-R, with six items for each of the five major dimensions of personality traits. Bilingual colleagues translated the survey from English into 26 other languages. Translators were instructed to choose words or phrases that best conveyed the intended construct, using as a reference the description of the 30 facets from the NEO-PI-R Manual (Costa & McCrae, 1992). Both authors examined independent back-translations into English, and any items that appeared problematic were reconsidered by the translators. Scores for the five factors were the sum of the six relevant items after reflecting negatively-keyed items. Raw scores were converted to T-scores (M = 50; SD = 10) using the international norms derived from in-group ratings (Terracciano et al., 2005).
Psychometric analyses of in-group NCS data showed strong interrater reliability on the aggregate scores for all traits and factors characterizing each culture (ICCs = .89 to .97); at the individual level, a factor analysis of the 30 items yielded a reasonable replication of the expected FFM (factor congruence coefficients = .85 to .93); and results generalized across gender, across sites within Brazil, Canada, New Zealand, and the U.S., where multiple sites were available, and across college student and adult samples in Ethiopia and Italy (ICCs = .62 and .90, respectively; Terracciano et al., 2005).3 It appears that the mean NCS ratings provide good operationalizations of national character.
Results and Discussion
Figure 1 shows mean ratings by Americans and by respondents from the other 48 cultures. The intraclass correlation coefficient across the 30 facet profile elements was high (ICC = .71, p < .001),4 and both sources depict the typical American as assertive, liberal, arrogant, and achievement-oriented. Where there were notable differences, they suggested that Americans were more critical of themselves: Contrary to the ethnocentric bias hypothesis, Americans rated themselves higher in Neuroticism and lower in Conscientiousness than others rated Americans. In general, the view held by both groups is consistent with studies of Americans conducted decades ago: Karlins and colleagues (1969) found that Princeton students described Americans as ambitious, industrious, and aggressive. The views from the students we sampled also seem consistent with recent surveys based on representative samples: The Pew Research Center (2005) found that in most of 16 nations, more than 50% of people rated Americans as hardworking and inventive, but also greedy and violent. In the terminology of the stereotype content model (Cuddy, Norton, & Fiske, 2005), Americans are seen as high in competence and low in warmth.
Figure 1.
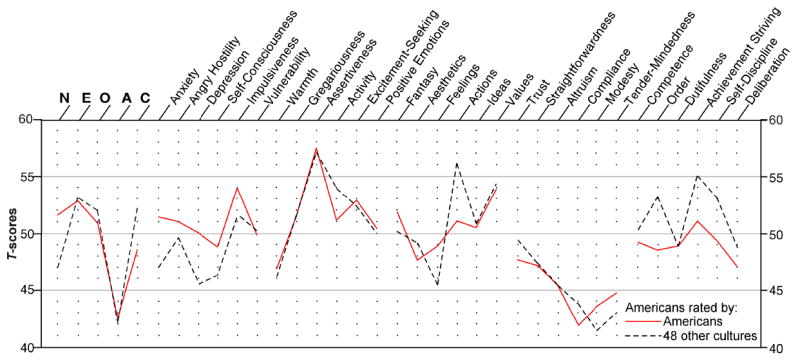
National Character Survey ratings of Americans by Americans and by members of 48 other cultures.
Note. Scores were standardized using international norms. On the left, the scores for the five factors are plotted; toward the right are the 30 facets, grouped by the factor they define. N = Neuroticism. E = Extraversion. O = Openness to Experience. A = Agreeableness. C = Conscientiousness.
The comparison of American in-group ratings with out-group ratings of Americans by others around the world is based on the assumption that NCS scores everywhere are fully comparable—that is, show scalar equivalence (van de Vijver & Leung, 1997). It is possible, however, that translations or cultural differences in response styles could render the scores inequivalent.5 Fortunately, our data provide an alternative way to assess the ethnocentric bias hypothesis. Respondents outside the U.S. were asked to rate both Americans and the typical member of their own culture. A comparison of these scores avoids possible problems of scalar inequivalence, because respondents in all cultures used the same translation for rating both targets, and presumably both sets of ratings were equally affected by any cultural influences on response style. Within any culture, the ethnocentric bias hypothesis would suggest that respondents should rate their own culture members as lower in N and higher in E, O, A, and C than they rate Americans. In fact, however, the typical American was rated lower on N in 33 out of 48 cultures, higher on E in 31, higher on O in 34, and higher on C in 32 cultures. Only with respect to A, where Americans were considered higher than the typical in-group member in only 6 cultures, is there any evidence that might be interpreted as support for the ethnocentric bias hypothesis. The consistency of these within-culture analyses with the direct comparison in Figure 1 provides some support for the assumption of scalar equivalence for the NCS scales (cf. McCrae et al., 2005b).
Despite the overall similarity, the degree of agreement with the in-group profile of Americans varied across cultures. Canadians, Europeans, Australians, and New Zealanders showed the highest degree of agreement (ICCs = .31 to .82; Mdn = .53); Asians, Latin Americans, and raters from the Middle East showed an intermediate level of agreement (ICCs = .04 to .48; Mdn = .41); and Africans showed the lowest agreement (ICCs = −.20 to .49; Mdn = .17; see Table 1, last column). These findings may be understandable in terms of Boster and Maltseva’s (2006) conclusion that “judges that are close judge similarly” (p. 47).6 Whether geographically close or not, cultures similar to the U.S. (e.g., New Zealand) appear to share Americans’ views of themselves. It does not seem, however, that this is because respondents in these cultures have simply had more contact with Americans. Additional analyses contrasting respondents who had (n = 942) and had not (n = 2,368) themselves visited the United States showed remarkably similar ratings of Americans (ICC = .91; Terracciano et al., 2005).7 Canadians and Europeans share American beliefs about Americans, not first-hand knowledge of what Americans are really like.
Overall, Table 1 indicates that African, Asian, and Middle Eastern cultures tend to rate Americans lower on Neuroticism and higher on Extraversion, Openness, Agreeableness, and Conscientiousness, whereas Latin American cultures rate Americans lower on Extraversion, Openness, and Agreeableness, but higher on Conscientiousness than Americans’ ratings of themselves. Consistent with the idea that people in wealthier countries are perceived more favorably (particularly as more efficient and competent) by people in economically disadvantaged countries (Linssen & Hagendoorn, 1994; Marin & Salazar, 1985), Americans were rated higher on Conscientiousness in nations with lower gross domestic products (r = −.60, p < .001; economic data from World Factbook, 2003). All but three cultures rated Americans as lower than the world average on Agreeableness. The ethnocentric bias hypothesis suggests that cultures similar to the U.S. (that is, having a European origin or sharing cultural features such as language, religion, or political and economic system) should have more favorable views of Americans, but this does not appear to be supported by the data in Table 1. Americans are perceived as more agreeable (that is, trusting, honest, generous, cooperative, modest, and tender-minded) by Nigerians, Moroccans, and Chinese than they are by Canadians, Australians, or Brazilians.
Contrary to much empirical and theoretical work (e.g., Allport, 1954) that sees in-group favoritism and out-group prejudice as having a major influence on the perception of group differences, these data suggest that such biases do not appear to provide a satisfactory explanation of national character stereotypes. As Fiske, Cuddy, Glick, and Xu (2002) argued, “stereotypes often include a mix of more and less socially desirable traits, not just the uniform antipathy so often assumed about stereotypes” (p. 879). And as Boster and Maltseva (2006) concluded, “stereotypes are more nuanced and more widely shared than one would expect if each of the groups were merely reveling in its own superiority” (p. 47).
Study 2: The Impact of the Iraq Invasion
A second set of analyses examines the effects of government foreign policies on the out-group perceptions of national character stereotype. As Schneider (2004) wrote, “shifts in alliances among countries, threatened and actual wars, and the like may well change the stereotypes of outgroups” (p. 528). The American-led invasion of Iraq provided an opportunity to test that hypothesis. Surveys of public opinion in many countries have shown a marked decline in favorable views of the U.S. following the invasion on March 20, 2003. As shown in Figure 2A, between the summer of 2002 and March 2003, the percentage of people with favorable views of the U.S. declined strongly (Pew Research Center, 2005). It is not clear, however, whether these views of the U.S. were generalized to the American people themselves. It is possible that unpopular U.S. foreign policy would lead to less favorable trait ratings of Americans, particularly lower Agreeableness (higher antagonism). However, it is also possible that people distinguish between U.S. foreign policy and the character of the American people. Indeed, the Pew Research Center (2005) survey suggests that the effect of the Iraq invasion on favorability ratings of Americans themselves was rather small over the same time period (Figure 2B). That survey, however, did not systematically assess the full range of personality traits.
Figure 2.
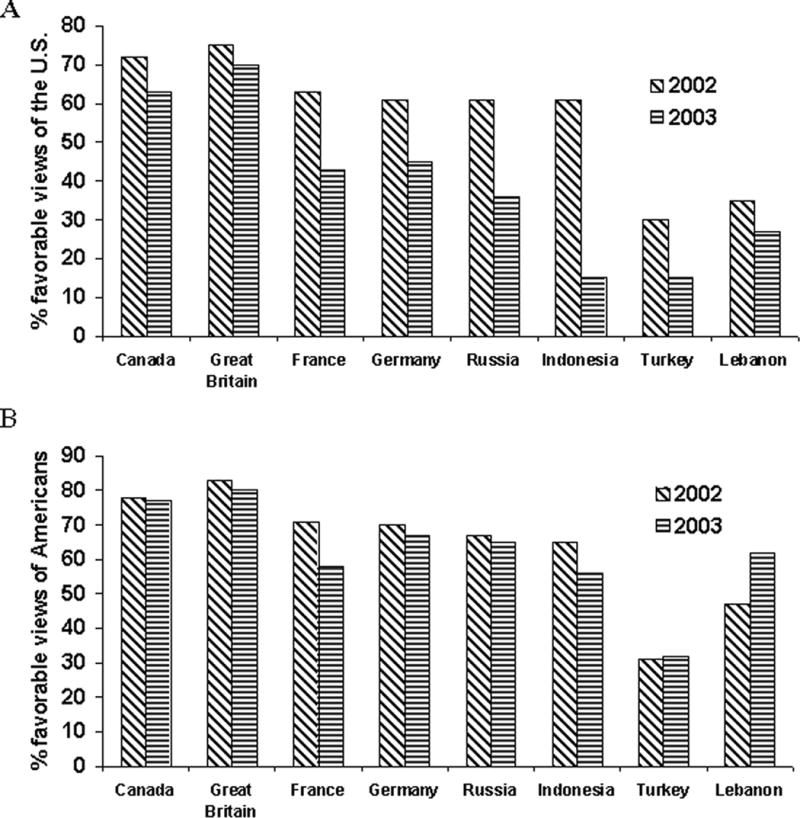
Percentage of favorable views of the U.S. (Panel A) and Americans (Panel B) before and after the Iraq invasion. Data (for nations in the present study) are from the Pew Research Center Surveys (2005; pp. 1, 20).
Method
The Personality Profiles of Cultures Project began shortly before the American-led Iraq invasion. Data collected between October 2002 and November 2004 (see Table 1) provide an opportunity to examine the acute effect of an historical event, the Iraq invasion, on perceptions of national character. Ratings were obtained from 11 cultures before, and from the U.S. and 35 other cultures after, the first day of the Iraq invasion. Although nations were not randomly assigned to before and after conditions, there were no differences between groups on economic, social, cultural, and psychological variables, including gross domestic product (GDP; World Factbook, 2003), human development index (HDI; UNDP), income inequality (Gini index; UNDP), temperature and latitude (World Climate, 2005), cultural dimensions (e.g., individualism/collectivism; Hofstede, 2001), aggregate personality scores (McCrae et al., 2005b), and subjective well-being (Diener, Diener, & Diener, 1995). These comparisons exclude a role for these variables in possible differences between pre and post-invasion ratings of the Americans national character. In addition, more robust, within-culture tests were performed in two countries. Data from adults in Italy and from students in Lebanon were collected twice from independent samples, both before and during the first two weeks after the Iraq invasion.
Results and Discussion
A first analysis was conducted at the culture level, where each culture was represented by its mean rating of Americans on the five factors and 30 facets. Mean differences between the 11 pre-invasion ratings and the 35 post-invasion ratings (see Table 1) were compared with ANOVAs. After the invasion, Americans were rated as higher in Neuroticism (p = .005; partial η2 = .165) and two of its facets, Angry Hostility (p = .026; partial η2 = .108) and Self-Consciousness (p = .042; partial η2 = .091); lower in Openness to Experience (p = .038; partial η2 = .094) and two of its facets, Actions (p = .049; partial η2 = .085) and Ideas (p = .043; partial η2 = .090); and lower in the Dutifulness (p = .027; partial η2 = .106) facet of Conscientiousness—all changes in the unfavorable direction.8 Although none of these differences remained statistically significant after Bonferroni correction for multiple comparisons (.05/35 = .001), the relatively large effect sizes indicate that the war had a noticeable effect on the ratings of Americans. Profiles of Americans as rated by other cultures before and after the invasion are shown in Figure 3A. Perceptions of the Americans were somewhat more negative after the Iraq invasion, but the event did not alter the overall profile of Americans. Indeed, the ratings were very similar (ICC = .91), and both resembled the way Americans see themselves (see Figure 1; ICCs = .58, .74). The similarity of profiles is impressive given the range of cultures from which the assessments were taken. Nevertheless, results from this quasi-experimental design must be taken with some caution.
Figure 3.
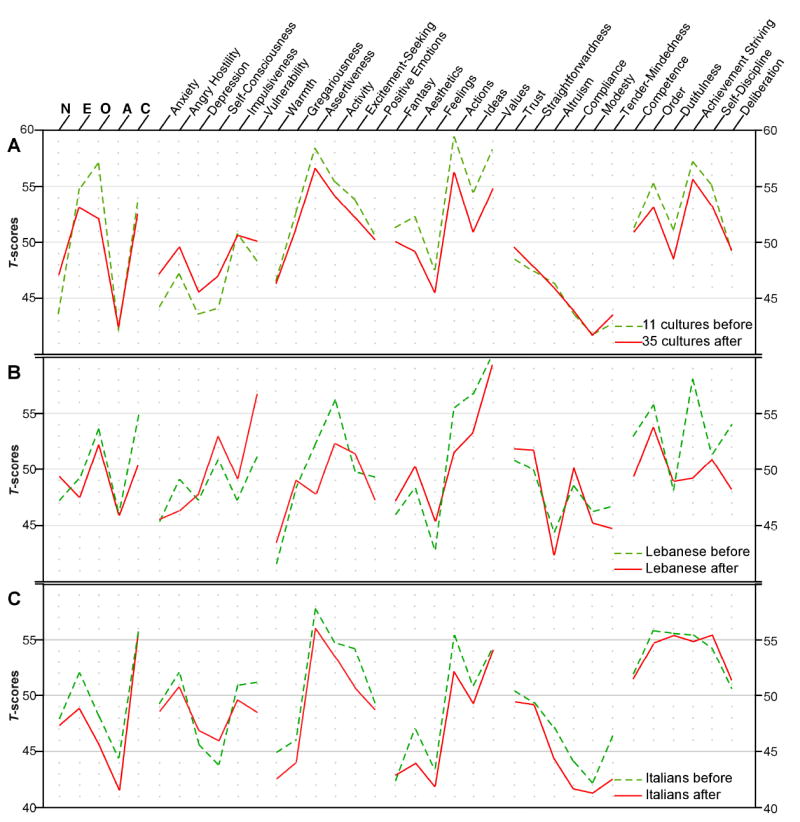
National Character Survey ratings of Americans before and after the Iraq invasion
Note. Scores were standardized using international norms. On the left, the scores for the five factors are plotted; toward the right are the 30 facets, grouped by the factor they define. N = Neuroticism. E = Extraversion. O = Openness to Experience. A = Agreeableness. C = Conscientiousness.
Within-culture analyses were conducted at the individual level using data from Lebanese students and Italian adults. Post invasion, the Lebanese—who were presumably deeply affected by these events in the Middle East—saw Americans as lower in Conscientiousness (p = .032; partial η2 = .050) and two of its facets, Achievement Striving (p = .001; partial η2 = .126) and Deliberation (p = .032; partial η2 = .050), and higher in the Vulnerability (p = .024; partial η2 = .055) facet of Neuroticism, all changes in the unfavorable direction. However, after Bonferroni correction, only the effect for Achievement Striving was significant. There were no significant pre/post differences in the Italian data. We also examined pre/post similarity within these two cultures. The two profiles showed high agreement in both Lebanon (Figure 3B; ICC = .74, p < .001) and Italy (Figure 3C; ICC = .92, p < .001). In both countries, stereotypes about Americans were essentially unchanged by the Iraq invasion.
One reason ratings changed so little may have been that Americans were already perceived as aggressive and arrogant before the invasion, effectively setting a floor on negative perceptions. Those perceptions in turn might have been due to the actions and statements of the American government in the period of months leading up to the invasion, and NCS ratings predating the “war on terrorism” might have shown a more favorable view of Americans. Yet the Pew Research Center surveys suggest sharp declines in favorable views of the U.S. immediately after the Iraq invasion, even in countries where the view of the U.S. was already very low. Furthermore, Americans have had an international reputation for arrogance that far predates recent events: The Ugly American (Lederer & Burdick, 1965) was published forty years ago.
However, it is also worth noting that the world’s description of American national character is not uniformly unfavorable. Compared to other peoples, Americans post-invasion were still seen as being higher than average in Assertiveness and Activity, Openness to Actions and Values, and Order and Achievement Striving; they are seen as lower than most others in Anxiety, Depression, and Self-Consciousness. Accurate or not, the world’s impression of the typical American is a highly differentiated portrait, not a blanket rejection.
It is possible that the Iraq invasion was too specific and too recent an event to affect the world’s view of Americans substantially. The literature suggests that events on a larger scale can alter perceptions of national character, at least transiently. Americans’ attitudes toward the Japanese declined rapidly after Pearl Harbor (Remmers, 1946), although they became positive again later (Maykovich, 1972). Buchanan and Cantril (1953) found Americans’ perceptions of Russians deteriorated from 1942, when the Soviet Union was a U.S. ally in World War II, to 1948, when it had become an enemy in the Cold War. The percentage of Americans who described Russians as hardworking went from 61% to 49%, as brave from 48% to 28%, as progressive from 24% to 15%, as conceited from 3% to 28%, and as cruel from 9% to 50%. Yet even at the height of the Cold War, Americans more often described Russians as hardworking than as conceited.
Historical events may have a limited short-term effect on perceptions of national character because people appear to have the ability to distinguish acts of the government from attributes of the people. Perhaps the most dramatic instance of this principle is found in studies of American students’ view of Germans. Remmers (1946) found a sharp decline in favorable attitudes towards the Nazis from 1935 to 1945, but attitudes towards Germans remained positive and showed no significant changes. The Pew Research Center surveys demonstrate this by showing that favorable attitudes toward the U.S. decreased sharply at a time when perceptions of Americans changed little (see Figure 2). However, the long-term effects of the Iraq invasion may be reflected in polls that show a slow decline in favorable attitudes toward Americans: In 10 nations surveyed in 2002 and 2006, mean favorability rating declined from 59% to 52% (Pew Research Center, 2006, p. 10).
General Discussion: Understanding and Modifying National Character Stereotypes
The small effect of the Iraq invasion on perceptions of Americans and the relative consistency across place and time of stereotypes of Americans has both positive and negative implications for Americans. On the one hand, the world’s perception of Americans is not dependent on the foreign policy decisions of any particular administration. They as a people are not blamed for actions unpopular in other parts of the world. On the other hand, our findings suggest that (a) the world’s opinion of Americans is at best mixed; (b) these views are essentially unfounded stereotypes (Terracciano et al., 2005); and (c) even events as dramatic as the Iraq invasion are unable to shake them. What could Americans do to convince the world that they are not so ugly (in some respects) as nearly everyone seems to believe?
The answer to that question depends on an understanding of the determinants of national character stereotypes, and that remains somewhat elusive. Part of the problem is that the origins of stereotypes probably differ from country to country. Canadians see themselves as the mirror image of Americans (ICC = −.53; Terracciano et al., 2005), perhaps in an effort to differentiate themselves and establish an independent national identity. But it is unlikely that Americans define themselves by reference to Canadians, so their views must have a different basis, perhaps stemming from the American experience in westward expansion.9 Stronger evidence exists that wealth and status can be the basis for attributing competence to members of a group (Cuddy et al., 2005; Poppe & Linssen, 1999). Again, there is a widespread belief that character is related to climate (Pennebaker, Rime, & Blankenship, 1996), and that, too, may contribute to the development of some national stereotypes.
National character stereotypes appear to be extremely durable phenomena. The cognitive mechanisms that help account for the persistence of stereotypes in individuals have been intensively studied (Macrae, Stangor, & Hewstone, 1996; Wegener, Clark, & Petty, 2006), along with sociological mechanisms that propel beliefs across cultures and generations. The media and interpersonal communication have a powerful role in shaping and maintaining these stereotypical beliefs (McGhee & Frueh, 1980; Schaller, Conway, & Tanchuk, 2002). Views of national character are enshrined in literature and history, disseminated through jokes, perpetuated by travelers’ tales.
Given a strong enough commitment, however, societies can modify such beliefs. Ethnic stereotypes and attitudes about African Americans have changed markedly in the U.S. (Schuman, Steeh, Bobo, & Krysan, 1997; see also Gilbert, 1951; Karlins et al., 1969; Katz & Braly, 1933; Madon et al., 2001; but see Devine & Elliot, 1995), but only as the result of sustained work by generations committed to social change. Stereotypes about reserved Englishmen or compliant Canadians might appear to be relatively harmless. However, the literature on stereotype threat suggests that stereotypes can have a negative effects on academic performance and health (Blascovich, Spencer, Quinn, & Steele, 2001), even when stereotypical beliefs are favorable in some respects, as for women (Spencer, Steele, & Quinn, 1999) and older adults (Levy, Slade, & Gill, 2006). At a collective level, national stereotypes can contribute to international tension and conflict. Psychologists cannot easily alter these entrenched ideas, but they can remind themselves, their students, and the public that national character stereotypes are a poor guide to understanding the people in any country or culture. We cannot cure optical illusions, but we can learn not to be deceived by them.
Acknowledgments
We thank the collaborators of the Personality Profiles of Cultures Project for providing data. This research was supported in part by the Intramural Research Program of the NIH, National Institute on Aging. This article was written by the authors in their capacity as NIH employees, but the views expressed in the article do not necessarily represent those of the NIH.
Footnotes
Portions of these data were presented at the 113th Annual Convention of the American Psychological Association, Washington, DC.
National stereotypes include features (e.g., values; Schwartz & Sagie, 2000) beyond the perceived personality traits that are central to national character per se. Thus, some characteristics commonly attributed to Americans such as individualism, materialism, consumerism, or the Protestant ethic are peripheral to this article.
If all people had ascribed only favorable traits to their own culture, there would have been little variation in NCS scores, and NCS scales would not have shown the levels of interrater reliability and factor replicability that were observed.
The intraclass correlations (ICCs) were computed using the double entry method, which is a robust statistical approach to assess profile similarity (Griffin & Gonzalez, 1995; Terracciano & McCrae, 2006) in which cases are entered twice, once in the first and once in the second column. The ICC is similar to the Pearson correlation, but it is sensitive to both the shapes of the profiles and differences in elevation. The p-value was based on the non-doubled n of 30.
Given the consistent findings of agreement between in-group and out-group ratings, it is unlikely that national character stereotypes would have proven more accurate if Terracciano and colleagues (2005) had used out-group ratings instead of the in-group ratings they analyzed (McGrath & Goldberg, 2006; Robins, 2005). In fact, it is more reasonable to expect accuracy when describing the people one has lived among all one’s life than when describing members of other cultures one may never have encountered (Park & Rothbart, 1982; see also Terracciano & McCrae, 2006).
An approach sometime used to account for acquiescence biases is the ipsatization of individual scores by subtracting the mean across all scales from each (Fischer, 2004). However, such standardization may overcorrect, and the NCS scales are balanced in direction of keying to control for acquiescence, at least at the domain level.
J. Allik (personal communication, February 20, 2006) clearly illustrated this principle with a Multidimensional Scaling analysis (see Allik & McCrae, 2004) of the data in Table 1. Geographically close nations with similar views of Americans were frequently clustered together in a two dimensional plot. For example, raters from both Brazil and Argentina saw Americans as lower in Extraversion and Openness than did most other nations. Similar pairs were Germany and German-speaking Switzerland, China and Hong Kong, Turkey and Lebanon, and Slovakia and the Czech Republic (see Table 1).
The effects of contact on stereotypes have been extensively researched and discussed (see Dixon, Durrheim, & Tredoux, 2005; Pettigrew & Tropp, 2006; Kenworthy, Turner, Hewstone, & Voci, 2005; Wolsko, Park, Judd, & Bachelor, 2003).
Similar results were obtained with individual level analyses, with the largest differences in Neuroticism and Openness, and practically identical ratings for the Agreeableness factors and its facets. However, because of the larger sample size (n = 590 before the invasion, n = 2605 after the invasion) there were significant differences in 21 out of 35 traits, and most of these remained significant after Bonferroni corrections. However, given the greater variability in individual level analyses, the effect sizes were smaller compared with those obtained from the culture level analyses (partial η2 ranging from .002 to .028).
Differences in stereotypes of Americans and Canadians may also be attributable to real differences in values (Adams, 2003).
References
- Abate M, Berrien FK. Validation of stereotypes: Japanese versus American students. Journal of Personality and Social Psychology. 1967;7:435–438. doi: 10.1037/h0025228. [DOI] [PubMed] [Google Scholar]
- Adams M. Fire and ice: The United States, Canada, and the myth of converging values. Toronto: Penguin; 2003. [Google Scholar]
- Allik J, McCrae RR. Toward a geography of personality traits: Patterns of profiles across 36 cultures. Journal of Cross-Cultural Psychology. 2004;35:13–28. [Google Scholar]
- Allport GW. The nature of prejudice. Cambridge, MA: Addison-Wesley; 1954. [Google Scholar]
- Blascovich J, Spencer SJ, Quinn D, Steele C. African Americans and high blood pressure: The Role of stereotype threat. Psychological Science. 2001;12:225–229. doi: 10.1111/1467-9280.00340. [DOI] [PubMed] [Google Scholar]
- Boster JS, Maltseva K. A crystal seen from each of its vertices: European views of European national characters. Cross-Cultural Research. 2006;40:47–64. [Google Scholar]
- Brewer MB. The psychology of prejudice: ingroup love or outgroup hate? Journal of Social Issues. 1999;55:429–444. [Google Scholar]
- Brewer MB. Intergroup relations. 2. Buckingham: Open University Press; 2003. [Google Scholar]
- Brewer MB, Campbell DT. Ethnocentism and intergroup attitudes. New York: Sage; 1976. [Google Scholar]
- Buchanan W, Cantril H. How nations see each other. Urbana: University of Illinois Press; 1953. [Google Scholar]
- Campbell DT. Stereotypes and the perception of group differences. American Psychologist. 1967;22:817–829. [Google Scholar]
- Central Intelligence Agency. The World Factbook. 2006 January 10; Retrieved February 22, 2006, from http://www.cia.gov/cia/publications/factbook/geos/it.html#Econ.
- Church AT, Katigbak MS. The Five-Factor Model in the Philippines: Investigating trait structure and levels across cultures. In: McCrae RR, Allik J, editors. The Five-Factor Model of personality across cultures. New York: Kluwer Academic/Plenum Publishers; 2002. pp. 129–154. [Google Scholar]
- Costa PT, Jr, McCrae RR. Revised NEO Personality Inventory (NEO-PI-R) and NEO Five-Factor Inventory (NEO-FFI) professional manual. Odessa, FL: Psychological Assessment Resources; 1992. [Google Scholar]
- Costa PT, Jr, Terracciano A, McCrae RR. Gender differences in personality traits across cultures: Robust and surprising findings. Journal of Personality and Social Psychology. 2001;81:322–331. doi: 10.1037/0022-3514.81.2.322. [DOI] [PubMed] [Google Scholar]
- Cuddy AJC, Norton MI, Fiske ST. This old stereotype: The pervasiveness and persistence of the elderly stereotype. Journal of Social Issues. 2005;61:267–285. [Google Scholar]
- Devine PG, Elliot AJ. Are racial stereotypes really fading? The Princeton Trilogy revisited. Personality and Social Psychology Bulletin. 1995;21:1139–1150. [Google Scholar]
- Diener E, Diener M, Diener C. Factors predicting the subjective well-being of nations. Journal of Personality and Social Psychology. 1995;69:851–864. doi: 10.1037//0022-3514.69.5.851. [DOI] [PubMed] [Google Scholar]
- Dixon J, Durrheim K, Tredoux C. Beyond the optimal contact strategy: A reality check for the contact hypothesis. American Psychologist. 2005;60:697–711. doi: 10.1037/0003-066X.60.7.697. [DOI] [PubMed] [Google Scholar]
- Fischer R. Standardization to account for cross-cultural bias: A classification of score adjustment procedures and review of research in JCCP. Journal of Cross-Cultural Psychology. 2004;35:263–282. [Google Scholar]
- Fiske ST, Cuddy AJ, Glick P, Xu J. A model of (often mixed) stereotype content: competence and warmth respectively follow from perceived status and competition. Journal of Personality and Social Psychology. 2002;82:878–902. [PubMed] [Google Scholar]
- Gilbert GM. Stereotype persistence and change among college students. Journal of Abnormal & Social Psychology. 1951;46:245–254. doi: 10.1037/h0053696. [DOI] [PubMed] [Google Scholar]
- Griffin D, Gonzalez R. Correlational analysis of dyad-level data in the exchangeable case. Psychological Bulletin. 1995;118:430–439. [Google Scholar]
- Hofstede G. Culture’s consequences: Comparing values, behaviors, institutions, and organizations across nations. 2. Thousand Oaks, CA: Sage; 2001. [Google Scholar]
- Karlins M, Coffman TL, Walters G. On the fading of social stereotypes: Studies in three generations of college students. Journal of Personality and Social Psychology. 1969;13:1–16. doi: 10.1037/h0027994. [DOI] [PubMed] [Google Scholar]
- Katz D, Braly K. Racial stereotypes of one hundred college students. Journal of Abnormal & Social Psychology. 1933;28:280–290. [Google Scholar]
- Kenworthy JB, Turner RN, Hewstone M, Voci A. Intergroup contact: When does it work, and why? In: Dovidio JF, Glick P, Rudman LA, editors. On the nature of prejudice: Fifty years after Allport. Malden, MA: Blackwell Publishing; 2005. pp. 278–292. [Google Scholar]
- Koomen W, Bahler M. National stereotypes: Common representations and ingroup favouritism. European Journal of Social Psychology. 1996;26:325–331. [Google Scholar]
- Krueger J. Probabilistic national stereotypes. European Journal of Social Psychology. 1996;26:961–980. [Google Scholar]
- Lederer WJ, Burdick E. The ugly American. New York: Norton; 1965. [Google Scholar]
- Lee YT, Jussim L, McCauley C. Stereotype accuracy: Toward appreciating group differences. Washington, DC: American Psychological Association; 1995. [Google Scholar]
- Levy BR, Slade MD, Gill TM. Hearing decline predicted by elders’ stereotypes. Journal of Gerontology: Psychological Sciences. 2006;61:P82–87. doi: 10.1093/geronb/61.2.p82. [DOI] [PubMed] [Google Scholar]
- Linssen H, Hagendoorn L. Social and geographical factors in the explanation of the content of European nationality stereotypes. British Journal of Social Psychology. 1994;33:165–182. [Google Scholar]
- Macrae CN, Stangor C, Hewstone M. Stereotypes and stereotyping. New York: The Guilford Press; 1996. [Google Scholar]
- Madon S, Guyll M, Aboufadel K, Montiel E, Smith A, Palumbo P, et al. Ethnic and national stereotypes: The Princeton trilogy revisited and revised. Personality and Social Psychology Bulletin. 2001;27:996–1010. [Google Scholar]
- Maykovich MK. Changes in racial stereotypes among college students. British Journal of Social Psychiatry & Community Health. 1972;6:126–132. [Google Scholar]
- Marin G, Salazar JM. Determinants of heterostereotypes and autostereotypes: Distance, level of contact, and socioeconomic-development in 7 nations. Journal of Cross-Cultural Psychology. 1985;16:403–422. [Google Scholar]
- McCrae RR, John OP. An introduction to the Five-Factor Model and its applications. Journal of Personality. 1992;60:175–215. doi: 10.1111/j.1467-6494.1992.tb00970.x. [DOI] [PubMed] [Google Scholar]
- McCrae RR, Terracciano A 78 Members of the Personality Profiles of Cultures Project. Universal features of personality traits from the observer’s perspective: Data from 50 cultures. Journal of Personality and Social Psychology. 2005a;88:547–561. doi: 10.1037/0022-3514.88.3.547. [DOI] [PubMed] [Google Scholar]
- McCrae RR, Terracciano A 79 Member of the Personality Profiles of Cultures Project. Personality profiles of cultures: Aggregate personality traits. Journal of Personality and Social Psychology. 2005b;89:407–425. doi: 10.1037/0022-3514.89.3.407. [DOI] [PubMed] [Google Scholar]
- McGhee PE, Frueh T. Television viewing and the learning of sex-role stereotypes. Sex Roles. 1980;6:179–188. [Google Scholar]
- McGrath RE, Goldberg LR. How to measure national stereotypes? Science. 2006;311:776–777. doi: 10.1126/science.311.5762.776. [DOI] [PubMed] [Google Scholar]
- Park B, Rothbart M. Perception of out-group homogeneity and levels of social categorization: Memory for the subordinate attributes of in-group and out-group members. Journal of Personality and Social Psychology. 1982;42:1051–1068. [Google Scholar]
- Peabody D. National characteristics. New York: Cambridge University Press; 1985. [Google Scholar]
- Pennebaker JW, Rime B, Blankenship VE. Stereotypes of emotional expressiveness of Northerners and Southerners: A cross-cultural test of Montesquieu’s hypotheses. Journal of Personality and Social Psychology. 1996;70:372–380. doi: 10.1037//0022-3514.70.2.372. [DOI] [PubMed] [Google Scholar]
- Pettigrew TF, Tropp LR. A meta-analytic test of intergroup contact theory. Journal of Personality and Social Psychology. 2006;90:751–783. doi: 10.1037/0022-3514.90.5.751. [DOI] [PubMed] [Google Scholar]
- Pew Research Center. U.S. image up slightly, but still negative. Washington, DC: Author; 2005. [Google Scholar]
- Pew Research Center. America’s image slips, but allies share U.S. concerns over Iran, Hamas. Washington, DC: Author; 2006. [Google Scholar]
- Poppe E, Linssen H. In-group favouritism and the reflection of realistic dimensions of difference between national states in Central and Eastern European nationality stereotypes. British Journal of Social Psychology. 1999;38:85–102. [Google Scholar]
- Remmers HH. Changes in attitudes toward Germans, Japanese, and Nazis as affected by the war. School and Society. 1946;63:118–119. [Google Scholar]
- Robins RW. The nature of personality: genes, culture, and national character. Science. 2005;310:62–63. doi: 10.1126/science.1119736. [DOI] [PubMed] [Google Scholar]
- Schaller M, Conway LG, 3rd, Tanchuk TL. Selective pressures on the once and future contents of ethnic stereotypes: effects of the communicability of traits. J Pers Soc Psychol. 2002;82:861–877. doi: 10.1037//0022-3514.82.6.861. [DOI] [PubMed] [Google Scholar]
- Schneider DJ. The psychology of stereotyping. New York: Guilford Press; 2004. [Google Scholar]
- Schuman H, Steeh C, Bobo L, Krysan M. Racial attitudes in America: Trends and interpretations. Cambridge, MA: Harvard University Press; 1997. [Google Scholar]
- Schwartz SH, Sagie G. Value consensus and importance a cross-national study. Journal of Cross-Cultural Psychology. 2000;31:465–497. [Google Scholar]
- Sherif M. Group conflict and cooperation. London: Routledge and Kegan Paul; 1966. [Google Scholar]
- Spencer SJ, Steele CM, Quinn DM. Stereotype threat and women’s math performance. Journal of Experimental Social Psychology. 1999;35:4–28. [Google Scholar]
- Steiner J. Historical conflict and incitement also provoke the journey to terrorism. American Psychologist. 2005;60:1038. doi: 10.1037/0003-066X.60.9.1038a. [DOI] [PubMed] [Google Scholar]
- Swim JK. Perceived versus meta-analytic effect sizes: An assessment of the accuracy of gender stereotypes. Journal of Personality and Social Psychology. 1994;66:21–36. [Google Scholar]
- Tajfel H. Human groups and social categories. Cambridge: Cambridge University Press; 1981. [Google Scholar]
- Terracciano A, Abdel-Khalek AM, Adam N, Adamovova L, Ahn CK, Ahn HN, et al. National character does not reflect mean personality trait levels in 49 cultures. Science. 2005;310:96–100. doi: 10.1126/science.1117199. [DOI] [PMC free article] [PubMed] [Google Scholar]
- Terracciano A, McCrae RR. How to measure national stereotypes? Response. Science. 2006;311:777–769. [Google Scholar]
- van de Vijver FJR, Leung K. Methods and data analysis of comparative research. In: Berry JW, Poortinga YH, Pandey J, editors. Handbook of cross-cultural psychology: Vol 1: Theory and method. Boston: Allyn and Bacon; 1997. pp. 257–300. [Google Scholar]
- Wegener DT, Clark JK, Petty RE. Not all stereotyping is created equal: Differential consequences of throughtful versus nonthoughtful stereotyping. Journal of Personality and Social Psychology. 2006;90:42–59. doi: 10.1037/0022-3514.90.1.42. [DOI] [PubMed] [Google Scholar]
- Williams JE, Best DE. Measuring sex stereotypes: A thirty nation study. Newbury Park, CA: Sage; 1982. [Google Scholar]
- Williams JE, Satterwhite RC, Saiz JL. The importance of psychological traits: A cross cultural study. New York: Plenum Press; 1998. [Google Scholar]
- Wolsko C, Park B, Judd CM, Bachelor J. Intergroup contact: Effects on group evaluations and perceived variability. Group Processes & Intergroup Relations. 2003;6:93–110. [Google Scholar]
- World Climate. World climate. 2005 January 5; Retrieved February 22, 2006 from http://www.worldclimate.com.