Abstract
Prolonged activation of p70 S6 kinase (S6K) by insulin and nutrients leads to inhibition of insulin signaling via negative feedback input to the signaling factor IRS-1. Systemic deletion of S6K protects against diet-induced obesity and enhances insulin sensitivity in mice. Herein, we present evidence suggesting that hypothalamic S6K activation is involved in the pathogenesis of diet-induced hepatic insulin resistance. Extending previous findings that insulin suppresses hepatic glucose production (HGP) partly via its effect in the hypothalamus, we report that this effect was blunted by short-term high-fat diet (HFD) feeding, with concomitant suppression of insulin signaling and activation of S6K in the mediobasal hypothalamus (MBH). Constitutive activation of S6K in the MBH mimicked the effect of the HFD in normal chow–fed animals, while suppression of S6K by overexpression of dominant-negative S6K or dominant-negative raptor in the MBH restored the ability of MBH insulin to suppress HGP after HFD feeding. These results suggest that activation of hypothalamic S6K contributes to hepatic insulin resistance in response to short-term nutrient excess.
Introduction
Insulin resistance plays an important role in the pathogenesis of type 2 diabetes. It is well established that excess nutrient intake and chronic hyperinsulinemia cause insulin resistance. The mammalian target of rapamycin/S6 kinase (mTOR/S6K) pathway has emerged as a promising molecular mediator of insulin resistance because it is activated by both insulin and nutrients (1–3). Insulin signaling is characterized by activation of the insulin receptor, followed by tyrosine phosphorylation of IRS proteins, PI3K activation, and Akt phosphorylation. Akt then inhibits tuberous sclerosis complex 1/2 by phosphorylation, resulting in Rheb activation, and activated Rheb then binds to and activates mTOR (4). How nutrients drive the mTOR/S6K pathway is less well understood, although AMPK (5), VPS34 (6, 7), and MAP4K3 (8) have been suggested as candidate mediators. Thus, mTOR sits at a critical juncture between insulin and nutrient signaling, making it important both for insulin signaling downstream from Akt and for nutrient sensing. It is also possible that activation of mTOR by nutrient signaling may, at least in part, offset its effects as a distal mediator of insulin action. The mTOR/S6K pathway is not only downstream from insulin signaling, but also upstream from it as a negative regulator, because S6K and/or mTOR phosphorylates several serine residues of IRS-1 to inhibit insulin signaling at the level of IRS-1 (9–12). Through this negative feedback mechanism, bidirectional changes in nutrient availability may lead to adaptive modifications in insulin signaling. In strong support of the physiological relevance of this mechanism, mice carrying a systemic deletion of S6K are lean and display enhanced insulin sensitivity (13). However, the critical sites involved in S6K mediation of insulin sensitivity have yet to be identified.
Hypothalamic insulin signaling reportedly contributes to the regulation of hepatic glucose production (HGP) in rodents (14–18). This indirect effect of insulin on the liver may play a major role in determining insulin-mediated suppression of HGP by suppressing hepatic gluconeogenesis in these species. Furthermore, short-term increases in nutrient intake selectively blunt insulin’s action on HGP. In hyperinsulinemic-euglycemic clamp studies in rats, we and others have shown that 3 d of high-fat diet (HFD) feeding is sufficient to induce hepatic insulin resistance, while the induction of peripheral insulin resistance requires more chronic nutrient excess (19, 20). Taken together, these data suggest that hepatic insulin resistance induced by both nutrient excess and hyperinsulinemia could stem from blunted hypothalamic insulin signaling. In this study, we investigated whether the ability of intrahypothalamic insulin — administered via the mediobasal hypothalamus (MBH) — to suppress HGP is affected by short-term HFD feeding, and we demonstrated the involvement of the hypothalamic mTOR/S6K pathway in diet-induced hepatic insulin resistance. We found that S6K activity increased during short-term HFD feeding and that adenoviral overactivation and suppression of hypothalamic S6K respectively mimicked and blocked the inhibitory effects of HFD feeding on central insulin-induced suppression of HGP.
Results
Short-term HFD feeding induces hypothalamic insulin resistance.
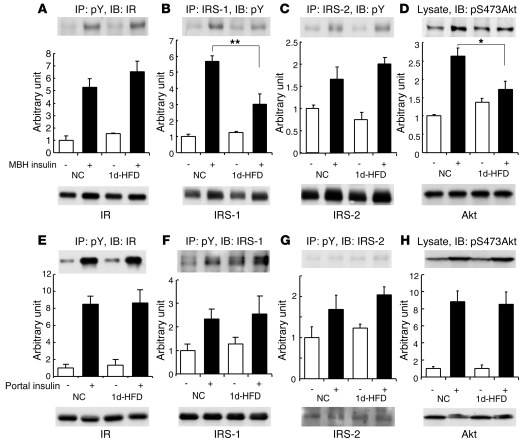
Previous hyperinsulinemic-euglycemic clamp studies demonstrated that HFD feeding of rats induces hepatic insulin resistance in just 3 d (19, 20), while HFD feeding for 1–3 wk is required for insulin resistance to emerge in muscle and adipose tissue. Taken together with the fact that hypothalamic insulin is involved in the regulation of HGP, these findings suggest the possibility that hypothalamic insulin resistance is relatively rapidly induced by HFD feeding and that this hypothalamic effect could promote hepatic insulin resistance. To investigate the putative early molecular and physiological mechanisms mediating HFD-induced insulin resistance, we examined hypothalamic insulin signaling 1 d after a marked increase in nutrient intake. We infused 4 μU insulin into the MBH of rats over a 5-min period and assessed insulin signaling in the MBH 15 min after this infusion. The ability of insulin to stimulate IRS-1 tyrosine phosphorylation (Figure 1B) and Akt serine phosphorylation at Ser473 (Figure 1D) was severely impaired after 1 d of HFD feeding, while tyrosine phosphorylation of the IR (Figure 1A) and IRS-2 (Figure 1C) was not affected.
Figure 1. HFD feeding for 1 d blunts insulin signaling in the MBH at the level of IRS-1 without altering hepatic insulin signaling.
Rats were fed NC or HFD for 1 d. Insulin was infused into the MBH (4 μU) or the portal vein (1 U/kg), and 15 min or 3 min later, respectively, MBH (A–D) or the liver (E–H) was harvested and analyzed. Tyrosine phosphorylations of IR (A and E), IRS-1 (B and F), and IRS-2 (C and G) were studied by immunoprecipitation with anti-phosphotyrosine (pY) antibody and blotted with anti-IR (A and E), anti–IRS-1 (F), anti–IRS-2 (G), or immunoprecipitation with anti–IRS-1 (B) or anti–IRS-2 (C) antibodies and blotting with anti-phosphotyrosine antibody. (D and H) Tissue lysates were blotted with anti-pSer473 Akt antibody. Graphs show the ratio of phosphoproteins to total proteins. *P < 0.05; **P < 0.01.
We also investigated whether insulin signaling in the liver is affected in this model. At 3 min after portal vein injection of 1 U/kg insulin, tyrosine phosphorylation of IR (Figure 1E), IRS-1 (Figure 1F), and IRS-2 (Figure 1G) as well as serine phosphorylation of Akt (Figure 1H) in rats fed HFD for 1 d did not differ significantly from those seen with normal chow (NC) feeding.
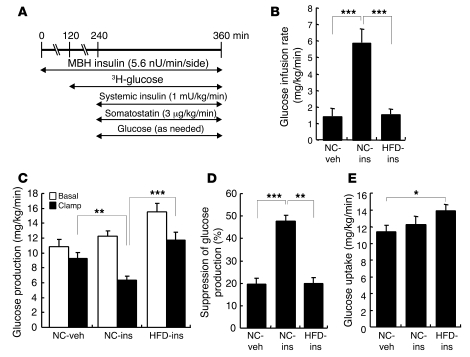
Using a protocol with which we previously showed the ability of central insulin (17), glucose (21), and fatty acids (22) to suppress HGP (Figure 2A), we then performed a pancreatic insulin clamp study to investigate whether the ability of central insulin to suppress glucose production is affected in short-term HFD-fed rats. Glucose production was determined both in absolute values (Figure 2C) and as the percent ratio of basal to clamped levels (Figure 2D). In rats fed NC, MBH insulin significantly increased the glucose infusion required to maintain euglycemia during the clamp (Figure 2B) and decreased HGP by 28% (Figure 2, C and D) compared with vehicle, as previously reported (18). While MBH insulin significantly suppressed glucose production in animals maintained on NC, 1-d HFD feeding completely blocked this effect, consistent with the blunted hypothalamic insulin signaling shown in Figure 1. The hypothalamic effects of insulin on glucose requirements (Figure 2B) and on HGP (Figure 2, C and D) were blunted in HFD-fed rats. Peripheral glucose uptake was slightly increased in 1-d HFD-fed rats with MBH insulin infusion compared with NC-fed rats with vehicle infusion (Figure 2E).
Figure 2. HFD feeding for 1 d induces insulin resistance in the brain-liver circuit.
Rats were fed NC or HFD (171% of the energy of NC) for 1 d. After 5 h of fasting, vehicle (veh) or 4 μU insulin (ins) was infused into the MBH for the entire 6-h duration of the clamp study. (A) Clamp protocol. Equilibration period, 0–120 min; basal period, 120–240 min; insulin clamp period, 240–360 min, during which systemic insulin and glucose were continuously infused and the rate of the latter was adjusted to maintain euglycemia. (B) Glucose infusion rate required to maintain euglycemia during the clamp period. (C) HGP during the basal and clamp periods. (D) Clamp/basal HGP suppression ratio. (E) Peripheral glucose uptake during the clamp period. *P < 0.05; **P < 0.01; ***P < 0.001.
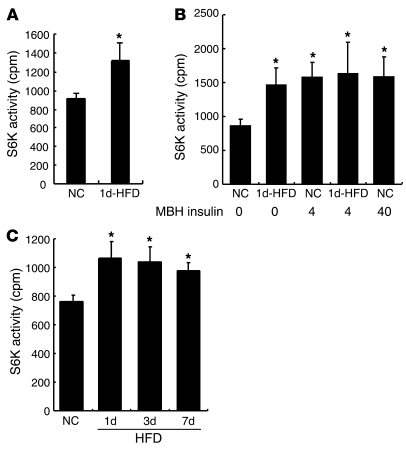
To investigate the potential mechanisms responsible for the rapid impairment of hypothalamic insulin signaling, we measured S6K activity, protein tyrosine phosphatase–1B (PTP-1B) protein amount, and the level and phosphorylation of JNK protein in the MBH. S6K activity increased approximately 45% in MBH of HFD-fed rats (Figure 3A), while the level and phosphorylation of JNK protein and expression of PTP-1B were unaffected (data not shown). As shown in Figure 3B, the increase in MBH S6K activity with HFD feeding was comparable to that induced by MBH insulin. In addition, raising insulin concentrations 10-fold did not result in greater S6K activation, which suggests that this level of S6K activity is maximal in the MBH. We also investigated the time course of activation. S6K activity reached maximal levels following the first day of HFD feeding (Figure 3C), indicating that this phenomenon occurs early during HFD feeding. This maximal level was maintained for at least 7 d of HFD feeding, demonstrating HFD-induced persistence of MBH S6K activation.
Figure 3. MBH S6K activity increased in the HFD-fed model.
(A) S6K activity was assayed in the MBH of rats fed NC or HFD for 1 d. (B) At 12 d after MBH cannulation, rats fed NC or HFD for 1 d were fasted for 5 h and injected with 0, 4, or 40 μU insulin for 5 min. After 40 min, the MBH was harvested and processed for S6K assay. (C) Rats were fed HFD for 0, 1, 3, or 7 d. On the last day, all rats were fed 20 g NC or HFD. After 5 h of fasting, the MBH was harvested and processed for S6K assay. *P < 0.05 versus NC.
Overactivation of S6K in the hypothalamus blunts the ability of insulin to suppress glucose production.
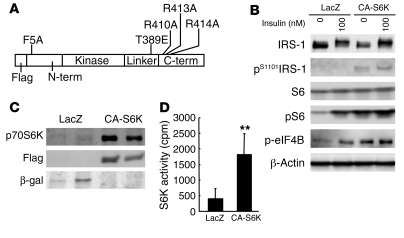
Based on these results, we hypothesized that HFD-induced hepatic insulin resistance may be mediated by hypothalamic activation of S6K. Consequently, we injected an adenoviral vector encoding rat constitutively active S6K (CA-S6K; Figure 4A) or a LacZ control into the rat MBH. S6K is known to have 2 inhibitory regulatory domains in the N and the C terminus. The CA-S6K carries mutations in both N- and C-terminal regulatory domains that render the kinase rapamycin insensitive, and hence constitutively active. The constitutive activity of this construct has already been demonstrated by transfection in cultured cells (23, 24). We performed a functional validation of our virus in the hypothalamic GT1-7 cell line. As shown in Figure 4B, adenoviral overexpression of this construct markedly induced serine phosphorylation of all 3 known substrates of S6K1 (IRS-1, S6 ribosomal protein, and eIF4B), consistent with results previously obtained using other cell lines (23, 24). Figure 4C shows transgene overexpression levels in the MBH, as detected by immunoblotting with anti-Flag and anti-S6K antibodies. Overexpression of CA-S6K in the MBH was associated with a 4.5-fold increase in S6K activity in the MBH samples (Figure 4D), thereby exceeding the level we observed with HFD feeding or insulin stimulation (Figure 3B). We compared transgene expression levels in micropunch samples from the arcuate nucleus, paraventricular nucleus, and lateral hypothalamus using both S6K antibody and Flag-tagged antibody and confirmed that transgene overexpression was limited to the arcuate nucleus (Supplemental Figure 1).
Figure 4. Hypothalamic overexpression of CA-S6K and functional validation in GT1-7 hypothalamic cells.
(A) Construction of CA-S6K. (B) Adenovirus-infected GT1-7 cells were stimulated with insulin for 30 min. Serine phosphorylations in the basal state (0 nM insulin) of S6, IRS-1, and eIF4B were increased to maximal levels (comparable to LacZ expression with 100 nM insulin) by CA-S6K overexpression (P < 0.01; n = 2). The ratios of phosphoproteins to total proteins, and of phosphoproteins to actin, were statistically analyzed. Representative bands are shown. (C) Expression of CA-S6K in the MBH. MBH tissue lysates obtained 12 d after viral injection were immunoblotted with anti-S6K, anti–M5-Flag, or anti–β-gal antibodies. (D) S6K activity in MBH samples. **P < 0.01 versus LacZ.
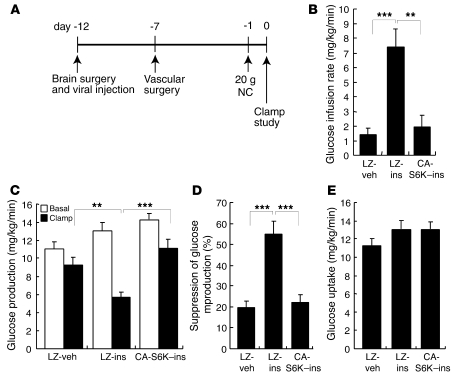
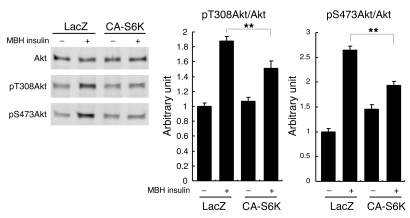
We then examined the effects of the same dose of CA-S6K or control LacZ adenovirus in pancreatic clamp studies performed 12 d after the viral MBH injections (Figure 5A). Adenoviral expression of LacZ did not affect the ability of insulin to suppress HGP compared with animals without viral treatment (Figure 5, B–E). In contrast, CA-S6K expression completely abolished the ability of MBH insulin to suppress HGP (Figure 5, B–D). Peripheral glucose uptake was unaffected by CA-S6K (Figure 5E). Thus, activation of S6K in the MBH was sufficient to induce insulin resistance in the liver. CA-S6K expression also resulted in impaired MBH insulin–stimulated Akt Thr308 and Ser473 phosphorylation (Figure 6), suggesting that the mechanism underlying hypothalamic CA-S6K–induced insulin resistance involves negative feedback on more proximal components of the insulin signaling pathway.
Figure 5. Hypothalamic overexpression of CA-S6K leads to insulin resistance in the basal pancreatic clamp.
(A) Protocol for surgery, viral injection, and the insulin clamp study. (B) Glucose infusion rate required to maintain euglycemia during the clamp period. (C) Glucose production during basal and clamp periods. (D) Clamp/basal HGP suppression ratio. (E) Peripheral glucose uptake during the clamp period. LZ, LacZ. **P < 0.01; ***P < 0.001.
Figure 6. Hypothalamic overexpression of CA-S6K blunts Akt phosphorylation.
After 5 h of fasting, 4 μU insulin was infused into the MBH, and 15 min later, the MBH was harvested and analyzed. MBH lysates were blotted with anti–phospho-Thr308 and anti–phospho-Ser473 Akt antibodies. Results are shown as representative bands with quantitation. **P < 0.01.
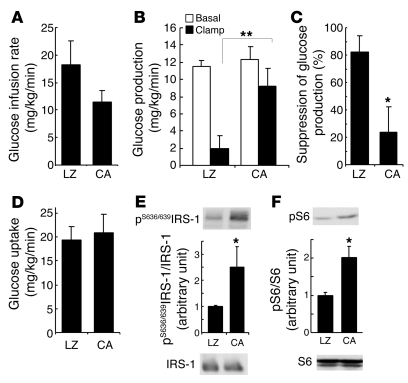
We next investigated whether MBH overexpression of CA-S6K is able to induce hepatic insulin resistance under hyperinsulinemic clamp conditions. The glucose infusion rate tended to be lower in CA-S6K rats (Figure 7A), but did not differ significantly from the controls. HGP in CA-S6K animals was significantly greater than that in LacZ controls (Figure 7, B and C). Analysis of MBH samples following the clamp period demonstrated that CA-S6K animals also had significantly increased serine phosphorylation of IRS-1 (Figure 7E) and S6 ribosomal protein (Figure 7F) relative to LacZ controls, providing further functional validation of the CA-S6K adenovirus.
Figure 7. Hypothalamic overexpression of CA-S6K leads to insulin resistance under hyperinsulinemic-euglycemic clamp conditions.
(A) Glucose infusion rate required to maintain euglycemia during the clamp period. (B) Glucose production during basal and clamp periods. (C) Clamp/basal HGP suppression ratio. (D) Peripheral glucose uptake during the clamp period. (E) Phosphoserine IRS-1 and (F) phosphoserine S6 at the end of the clamp study. Graphs show the ratio of phosphoproteins to total proteins. *P < 0.05 versus LacZ. **P < 0.01.
MBH inhibition of the mTOR/S6K pathway reverses HFD-induced insulin resistance.
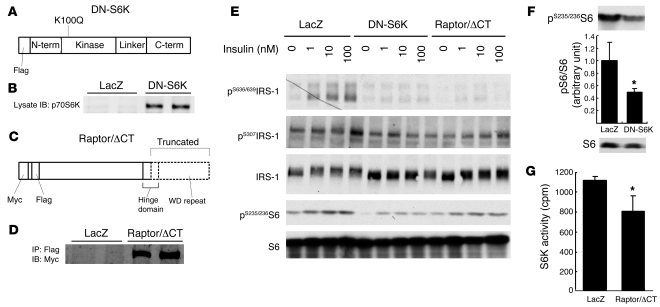
To examine whether activation of hypothalamic S6K is required for the onset of nutrient-dependent hypothalamic and hepatic insulin resistance during HFD feeding, we used 2 different loss-of-function adenoviruses to selectively decrease the activity of the mTOR/S6K pathway in the MBH of rats fed HFD for 1 d. In cultured cells, glucose and leucine have previously been shown to enhance Ser307 and Ser636/639 phosphorylation of IRS-1, while kinase-dead, dominant-negative S6K (DN-S6K) and dominant-negative Raptor inhibit phosphorylation at these sites (25, 26). We constructed adenoviruses encoding either a kinase-dead S6K (Figure 8A) that functions in a dominant interfering manner (25, 27–29) or a C terminal–truncated Raptor (Raptor/ΔCT; Figure 8C) that inhibits S6K activity (30) and IRS-1 serine phosphorylation by a mechanism involving uncoupling of the target of rapamycin complex 1 (TORC1; refs. 26, 31). Immunoblotting confirmed MBH expression of DN-S6K and Raptor/ΔCT after virus injection (Figure 8, B and D). These constructs have been functionally validated in prior in vivo studies: transgenic overexpression of the K100Q mutant of S6K in Drosophila larvae modifies food preferences (29), and hepatic overexpression of Raptor/ΔCT adenovirus inhibits hepatic S6K activity (32). We also performed functional validations of these viral vectors in GT1-7 hypothalamic cell lines and found that both viruses suppressed insulin-induced serine phosphorylation of IRS-1 at inhibitory sites as well as S6 ribosomal protein (Figure 8E). Our observations extend previous results (26, 31) and indicate that S6K mediates negative feedback regulation of insulin signaling in hypothalamic cell lines. Moreover, in the MBH of 1 d-HFD rats, DN-S6K overexpression suppressed phosphorylation of S6 ribosomal protein (Figure 8F) and Raptor/ΔCT overexpression suppressed S6K activity (Figure 8G), validating the inhibition of TORC1 by these 2 adenoviruses in vivo.
Figure 8. Hypothalamic overexpression of DN-S6K or Raptor/ΔCT and functional validation of these viruses in hypothalamic GT1-7 cells and rat MBH.
(A) Construction of kinase-dead DN-S6K. (B) Confirmation of DN-S6K expression in the MBH. (C) Construction of Raptor/ΔCT. A part of the hinge domain and all WD repeat domains were removed. The N terminus had Myc and Flag tags. (D) Confirmation of Raptor/ΔCT expression in the MBH. MBH lysate was immunoprecipitated with anti-Flag antibody and immunoblotted with anti-Myc antibody. (E) Adenovirus-infected GT1-7 cells were stimulated with 0, 1, 10, or 100 nM insulin for 30 min. Serine phosphorylations in the insulin-stimulated state of S6 and IRS-1 at Ser636/639 and Ser307 were significantly reduced by DN-S6K and Raptor/ΔCT overexpression (phosphoproteins/total protein ratio, P < 0.01, 2-way repeated-measures ANOVA; n = 2). Representative bands are shown. (F) Overexpression of DN-S6K suppressed phosphorylation of S6 in the MBH of rats fed HFD for 1 d. (G) Overexpression of Raptor/ΔCT suppressed S6K activity in the MBH of 1 d HFD-fed rats. *P < 0.05 versus LacZ.
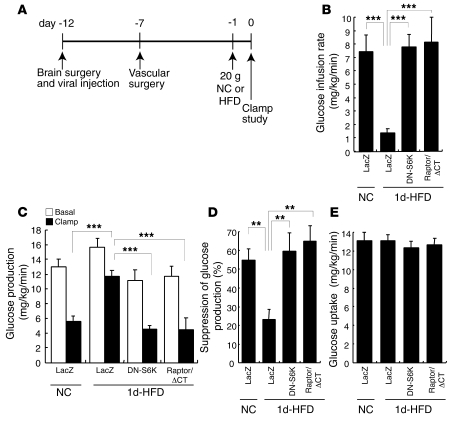
We injected these 2 viruses, as well as LacZ, and 12 d later performed insulin clamp studies after 1 d of feeding with either NC or HFD (Figure 9A). During the clamp study, MBH insulin failed to suppress glucose production in HFD-fed rats expressing LacZ, an observation similar to that in HFD-fed rats without viral treatment (Figure 9, B–D). Overexpression of either DN-S6K or Raptor/ΔCT in the MBH of HFD-fed rats completely reversed the impairment in MBH insulin action. In the presence of basal insulin, the rate of glucose infusion required to maintain euglycemia was marginal in LacZ-injected HFD-fed rats (Figure 9B). However, in HFD-fed rats with MBH DN-S6K or Raptor/ΔCT injection, glucose had to be infused systemically to prevent hypoglycemia (Figure 9B). The increased glucose infusion was caused by suppression of glucose production (Figure 9, C and D), similar to that observed in rats on NC. Glucose uptake was unaffected under all conditions examined (Figure 9E).
Figure 9. Hypothalamic overexpression of DN-S6K or Raptor/ΔCT reverses insulin resistance in HFD-fed rats.
(A) DN-S6K or Raptor/ΔCT adenoviruses were injected into the MBH, and 12 d later, insulin clamp studies were performed on rats fed NC or HFD for 1 d. (B) Glucose infusion rate required to maintain euglycemia during the clamp period. (C) Glucose production during basal and clamp periods. (D) Clamp/basal HGP suppression ratio. (E) Peripheral glucose uptake during the clamp period. **P < 0.01; ***P < 0.001.
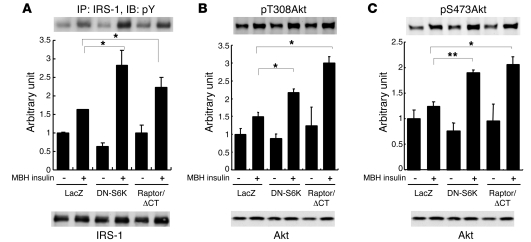
Overexpression of either DN-S6K or Raptor/ΔCT in the MBH normalized hypothalamic insulin signaling in 1-d HFD fed rats. DN-S6K or Raptor/ΔCT also enhanced insulin-induced tyrosine phosphorylation of IRS-1 (Figure 10A), Akt Thr308 (Figure 10B), and Akt Ser473 (Figure 10C) phosphorylation. These data suggest that inhibition of endogenous S6K in the MBH of HFD-fed rats reverses diet-induced insulin resistance by blocking negative feedback at the level of IRS-1. Our findings do not, however, rule out the possibility that mTOR itself inhibits insulin signaling via serine phosphorylation of IRS-1, independently of S6K. In this context, some part of the rescue effect achieved using Raptor/ΔCT may be the result of uncoupling of mTOR/Raptor from its substrate IRS-1, rather than inhibition of S6K. However, the effect of DN-S6K was quite similar to that of Raptor/ΔCT, again suggesting that MBH S6K is necessary for the establishment of hepatic insulin resistance with 1-d HFD feeding.
Figure 10. Insulin signaling in the MBH is improved by adenoviral inhibition of the mTOR/S6K pathway.
Rats were fed NC or HFD for 1 d, and insulin signaling was analyzed 15 min after infusion of insulin (4 μU total) into the MBH. The tyrosine phosphorylation of IRS-1 (A) and phosphorylation of Akt at Thr308 (B) and at Ser473 (C) by insulin were enhanced in response to the overexpression of DN-S6K or Raptor/ΔCT. All graphs show the ratio of phosphoproteins to total proteins. *P < 0.05; **P < 0.01.
Discussion
Here we demonstrate, for the first time to our knowledge, that a single day of exposure to a HFD blunts both insulin signaling in the hypothalamus and the ability of hypothalamic insulin to suppress HGP. This blunting is accompanied by activation of S6K, suggesting a role for this molecule in the mediation of central insulin sensitivity and peripheral glucose homeostasis. To investigate the role of hypothalamic S6K in short-term HFD–induced hepatic insulin resistance, we expressed gain- and loss-of-function mutants of the mTOR/S6K pathway selectively in the MBH using targeted adenovirus injections. MBH overexpression of CA-S6K mimicked the hypothalamic metabolic and signaling consequences of 1-d HFD feeding, characterized by blunted insulin sensitivity during a pancreatic basal clamp with MBH insulin and reduced hypothalamic insulin signaling. Overactivation of MBH S6K also induced hepatic insulin resistance under hyperinsulinemic clamp conditions. On the other hand, MBH overexpression of DN-S6K or Raptor/ΔCT in animals fed HFD for 1 d completely reversed diet-induced hypothalamic insulin insensitivity and signaling. These findings, together with the previous observations that short-term HFD induces hepatic insulin resistance and that the brain partly mediates the effect of insulin to suppress HGP (14–18), strongly suggest that the activation of hypothalamic mTOR/S6K induces the early onset of hepatic insulin resistance during HFD feeding in rodents.
Insulin sensitivity is tightly linked to nutrient availability in multiple systems. The development of insulin resistance in different tissues may be both temporally and mechanistically distinct. Although hypothalamic insulin resistance appears to be an early event in the development of HFD-induced hepatic insulin resistance, it is noteworthy that with more prolonged exposure to nutrient excess, alterations in insulin signaling have been documented in several peripheral tissues, including the liver, and that insulin resistance extends well beyond this brain-liver circuit. We and others have previously shown that more prolonged overfeeding (>7 d) is necessary to induce insulin resistance in peripheral tissues other than the liver (19, 20, 33). Changes in hepatic insulin signaling accompanying the development of insulin resistance also depend on the duration of nutrient excess. HFD or Western diet feeding for 10–14 d (34, 35) induces paradoxical enhancement of IRS signaling in the liver, while longer overfeeding induces inhibition (35). Based on our present data, we suggest that altered hypothalamic insulin signaling determines insulin resistance early during HFD feeding, while blunted hepatic insulin signaling substantially contributes to insulin resistance during more prolonged overnutrition.
Even in the hypothalamus, the duration of HFD feeding appears to induce different modification patterns of insulin signaling. The 1-d HFD-fed rat model displayed decreased activation of hypothalamic IRS-1 and Akt, in parallel with increased S6K activation, in the absence of any change in IR and IRS-2 tyrosine phosphorylation, JNK phosphorylation, or PTP-1B expression. S6K phosphorylation has also previously been shown to be elevated in the liver and muscle after 5 d of hyperinsulinemia (36) as well as in muscle and fat after 4 mo of HFD feeding (13); these studies did not assess S6K phosphorylation in the hypothalamus. Previously, 10–30 d of exposure to a Western diet has been shown to blunt tyrosine phosphorylation of IR, IRS-1, and IRS-2 as well as Akt phosphorylation in the hypothalamus, while JNK phosphorylation is increased (35). Moreover, PTP-1B was recently reported to be increased in the arcuate nucleus by 20 wk of HFD feeding (37). The discrepancy between these reports and our present observations may be explained, at least in part, by differences in the duration of exposure to HFD. We propose that hypothalamic S6K plays a predominant role in the onset of hypothalamic insulin resistance during HFD feeding, while prolonged nutrient excess results in the activation of inflammatory pathways, including JNK phosphorylation (35) and/or PTP-1B (37), which may support the maintenance of long-term hypothalamic insulin resistance.
Results from genetic deletion studies suggest that hypothalamic IRS-2 is more critical than IRS-1 in mediating the hypothalamic regulation of metabolism (38–40). In contrast, IRS-1 appears to be more clearly involved in negative feedback arising from the mTOR/S6K pathway (10, 12, 13, 25, 41, 42). Based on our present findings, we speculate that an mTOR/S6K/IRS-1 negative feedback pathway plays a dominant role in the early phase of HFD-induced hypothalamic insulin resistance.
Our observations support the idea that the mTOR/S6K pathway is critical for nutrient sensing in the arcuate nucleus. Activation of this pathway may have distinct and dissociable effects on 2 aspects of nutrient availability: glucose homeostasis and energy balance. Although Cota et al. have previously suggested that central administration of leucine reduces subsequent food intake by activating TORC1 pathway in the hypothalamus (43), we detected no significant differences in body weight after MBH injections, catheterization surgery, or clamping (Supplemental Table 1). This could be explained by divergence of TORC1 targets: while MBH IRS-1 is implicated in the ability of S6K to affect HGP, the downstream effectors of TORC1 on food intake remain unknown. Alternatively, there could be heterogeneity of responses within the MBH cell populations. While adenoviral injection allows rapid changes to be produced, and thereby circumvents developmental effects, it fails to distinguish among different cell populations (neurons versus glial cells, and neuronal subpopulations). Thus, further studies with conditional knockouts will be required.
In summary, our present findings indicate that diet-induced insulin resistance develops very rapidly in the hypothalamus in concert with decreased stimulation of IRS-1 and Akt by insulin and increased S6K activity. Our findings suggest that inhibition of S6K within the MBH may prevent the earliest stage of diet-induced insulin resistance. The phenotype of systemic S6K knockout mice (13) might result from enhanced hypothalamic insulin sensitivity, at least in part. Taken together with recent reports on the role of hypothalamic mTOR in the regulation of feeding behavior (43), these findings may lead to new therapeutic avenues for targeting metabolic syndrome and diabetes.
Methods
Animal preparation.
All study protocols were reviewed and approved by the Institutional Animal Care and Use Committee of the Albert Einstein College of Medicine. We used 208 male Sprague-Dawley rats weighing 280–310 g (Charles River Breeding Laboratories). The rats were housed in individual cages and subjected to a standard light/dark cycle and NC diet (3.00 kcal/g, catalog no. 5001; Purina Mills Inc.). At 12 d before the clamp or insulin bolus studies, bilateral cannulae targeting the MBH were stereotactically implanted (3.0 mm caudal to the bregma, 9.4 mm below the skull surface, ±0.4 mm lateral to the midline). The adenoviral vector (2 × 10⁶ pfu in 2 μl/side over a 20-min period) was infused bilaterally using paired 30-gauge stainless steel injectors extending 1.0 mm from the distal tips of the guide cannulae, and injectors were removed 20 min after completion of the 20-min injection. After 7 d, rats for clamp studies were implanted with additional catheters in the right internal jugular vein and left carotid artery as previously described (44). In the HFD-fed group, the NC diet was discontinued the day before the clamp study and substituted with a HFD (NC plus 10% lard, 5.14 kcal/g; ref. 44).
Clamp studies.
Rats received 20 g NC or HFD the evening before the clamp studies in order to achieve comparable postabsorptive status in all animals. Body weight at the first surgery, second surgery, and the day of clamping as well as plasma insulin and blood glucose levels before the start of MBH insulin, during the basal period (60–120 min), and during the clamp period (210–240 min) are shown in Supplemental Table 1. The protocol of basal pancreatic clamp studies (Figure 2A) was as follows. At 0 min, a bilateral MBH infusion of insulin (5.6 nU/min/side in saline with 0.1% BSA) or vehicle was started. Following an equilibration period (0–120 min), a primed continuous infusion of [3-3H]-glucose (40 μCi bolus, 0.4 μCi/min; New England Nuclear) was begun. Samples for determination of [3-3H]-glucose–specific activity were obtained at 10-min intervals. Finally, a pancreatic insulin clamp with infusion of 1 mU/kg/min (~20 μU/ml) insulin and 3 μg/kg/min somatostatin was initiated at 240 min and continued for 2 h. During the clamp period, 25% glucose solution was infused at a variable rate to maintain the plasma glucose concentration at approximately 8 mM. We injected 14C-lactate during the last 10 min of the clamp period for the gluconeogenesis analysis, but a technical problem prevented us from analyzing these samples for this study. The hyperinsulinemic clamp study consisted of a 2-h basal and a 2-h insulin clamp period with continuous infusion of insulin at 3 mU/kg/min. At the completion of these clamp studies, rats were anesthetized, and tissue samples were freeze-clamped in situ with aluminum tongs precooled in liquid nitrogen. The MBH was dissected and processed for immunoprecipitation, immunoblot, or S6K assay.
Subcloning and adenovirus preparation.
Rat p70 S6K 1 (shorter form of Rps6kb1) cDNA was subcloned using RT-PCR from the rat liver, and human Raptor cDNA was subcloned from a human cDNA library. N-terminal Flag and myc tag; mutations in S6K at F5A, K100Q, T389E, and RSPRR to ASPAA (aa 410–414); and truncation of Raptor at aa 905 were introduced using PCR-based mutagenesis, with confirmation of whole sequences. Adenoviruses for S6K mutants were generated using the Adeno-X expression system version 1 (BD Biosciences — Clontech), with a substitution of the promoter in the shuttle vector from CMV to CAG (45). Raptor/ΔCT and LacZ adenoviruses were prepared as previously described (32, 45). Adenoviruses were amplified in 293 cells and purified with an Adenopure kit (Puresyn Inc.). Adenoviral titers were measured by end point dilution assay with 1:3 serial dilutions on a 96-well plate of HEK293 cells.
MBH insulin bolus studies.
Food was removed the morning of the studies. After a 5-h fast, anesthetized rats received 2 μU/side insulin infusion for 5 min and were sacrificed 15 min after the start of the infusion. This total dose is the same as that used for the insulin clamp study. In the S6K assay of NC compared with 1-d HFD feeding with or without insulin infusion (Figure 3B), the MBH was harvested 40 min after the start of insulin or vehicle infusion. The brains were isolated, and the MBH was sampled by dissecting a wedge of tissue including the entire mediolateral and dorsoventral extent of the arcuate nuclei while minimizing ventromedial nucleus tissue. The MBH was sonicated in 400 μl ice-chilled lysis buffer (50 mM HEPES, pH 7.7; 100 mM sodium chloride; 50 mM sodium fluoride; 40 mM β-glycerophosphate; 10 mM sodium pyrophosphate; 1 mM EDTA; 1 mM EGTA; 10 mM sodium orthovanadate; 2 mM PMSF; 1% NP-40; and complete inhibitor cocktail from Roche Diagnostics) for 10 s. The supernatant obtained by a centrifugation at 12,000 g for 15 min was taken as the tissue lysate and assayed as for protein concentration with a BCA kit (Pierce). The total MBH protein amount from 1 animal was approximately 500–800 μg. Tissue lysates were adjusted to the same protein concentration and used for immunoprecipitation or immunoblotting.
Portal insulin bolus study.
Food was removed the morning of the studies. After a 5-h fast, rats were anesthetized, the abdomen was opened, and a catheter was inserted into the portal vein. Insulin (1 U/kg) was infused within 30 s, and the liver was harvested 3 min after the start of this infusion, then homogenized in a 10× volume of the same lysis buffer as that used in the MBH insulin study. Processing of the homogenate was same as that of the MBH signaling study.
TORC1 signaling studies in GT1-7 hypothalamic cells.
The GT1-7 cell line was kindly provided by P. Mellon (UCSD, San Diego, California, USA). Cells at approximately 80% confluence were infected with adenovirus, each at MOI 300. After 48 h, cells that had been serum starved for 16 h were stimulated with 0, 1, 10, or 100 nM insulin for 30 min, harvested in 1× Laemmli buffer, boiled, and processed for Western blotting. All site-specific phosphoserine antibodies, anti-Raptor, and anti-S6 antibodies were from Cell Signaling. Anti–β-actin antibody was from Novus Biologicals.
Immunoprecipitation and Western blotting.
MBH lysates (60 μg for phosphotyrosine; 150 μg for IRS-1 or IRS-2; or 100 μg for Flag) were incubated with 5 μg anti-phosphotyrosine (4G10; Upstate), anti–IRS-1 or anti-IRS-2 antibodies (Upstate), or anti-M2 Flag (Sigma-Aldrich) for 3 h (phosphotyrosine or IRS) or overnight (Flag) at 4°C. Protein G or protein A Sepharose beads were added, followed by agitation for 1 h. Immunoprecipitants were washed with the lysis buffer and boiled in Laemmli buffer. Total tissue lysates were also boiled in Laemmli buffer, and samples were electrophoresed in 4%–15% Tris-HCl precast gradient gel (BioRad) and transferred to a nitrocellulose membrane. To detect tyrosine phosphorylation of IR or IRS, the membrane was blocked with Tris-buffered saline with Tween 20 plus 3% BSA and incubated with anti-IRβ (1:1,000; Santa Cruz Biotechnology Inc.) or anti-phosphotyrosine (1:10,000, 4G10; Upstate) at 4°C overnight, followed by incubation with HRP-conjugated secondary antibody for 1 h. The signal was then detected with ECL (GE Healthcare). For other samples, the membrane was blocked with Odyssey blocking buffer (Licor Biosciences), followed by incubation with primary antibodies (anti-S6K, 1:1,000; Upstate; anti–total Akt, anti–phospho-Akt, anti–phospho-JNK, or anti-myc, 1:1,000; Cell Signaling; anti–PTP-1B, 1:200; Santa Cruz Biotechnology Inc.; anti–M5-Flag or anti–β-gal, 1:1,000; Sigma-Aldrich) overnight at 4°C, then by incubation with IRDye-conjugated secondary antibodies, and the signal was finally detected using the Licor Odyssey system.
S6K activity assay.
The S6K assay kit (Upstate) was used with minor modifications. Briefly, 200 μg tissue lysate was incubated with 3 μg anti-S6K antibody and 30 μl protein A Sepharose beads in modified buffer A (50 mM Tris, pH 7.5; 1 mM EDTA; 1 mM EGTA; 2 mM sodium orthovanadate; 0.1% 2-mercaptoethanol; 1% Triton X-100; 50 mM sodium fluoride; 10 mM sodium pyrophosphate; 10 mM β-glycerophosphate; 0.2 mM PMSF; and complete inhibitor cocktail from Roche Diagnostics) and agitated for 2 h at 4°C, then washed 3 times with the same buffer and twice with Assay Dilution Buffer I (Upstate), then incubated with synthetic substrate peptide (KKRNRTLTK) and [γ-32P]ATP at 30°C for 10 min with continuous agitation. After a brief spin down, supernatants were spotted onto W81 filter paper, washed with diluted phosphoric acid, and counted with a scintillation counter.
Brain micropunch.
Brain micropunches of individual hypothalamic nuclei were performed as described previously (46).
Statistics.
All values are mean ± SEM. Western blots were quantified — or scanned from film, then quantified — using a Licor Odyssey system. Comparisons among groups were made using ANOVA or unpaired Student’s t test as appropriate. A P value less than 0.05 was considered significant.
Supplementary Material
Acknowledgments
We wish to thank Bing Liu, Hong Zhang, Zhiping Wu, Clive Baveghems, and Stanislaw Gaweda for expert technical assistance. H. Ono is a recipient of a 2005 research fellowship from the Sankyo Foundation of Life Science and a 2007 research fellowship from Uehara Memorial Foundation. This work was supported by NIH grant DK045024 and by the American Diabetes Association to L. Rossetti; by NIH grant DK066618 and by the Skirball Institute for Nutrient Sensing to G.J. Schwartz; and by NIH grant DK020541 to the Albert Einstein College of Medicine Diabetes Research and Training Center.
Footnotes
Nonstandard abbreviations used: CA-S6K, constitutively active S6K; DN-S6K, dominant-negative S6K; HFD, high-fat diet; HGP, hepatic glucose production; MBH, mediobasal hypothalamus; mTOR, mammalian target of rapamycin; NC, normal chow; PTP-1B, protein tyrosine phosphatase–1B; Raptor/ΔCT, C terminal–truncated Raptor; S6K, S6 kinase; TORC1, target of rapamycin complex 1.
Conflict of interest: The authors have declared that no conflict of interest exists.
Citation for this article: J. Clin. Invest. 118:2959–2968 (2008). doi:10.1172/JCI34277
Alessandro Pocai’s and Luciano Rossetti’s present address is: Merck Research Laboratories, Rahway, New Jersey, USA.
References
- 1.Hay N., Sonenberg N. Upstream and downstream of mTOR. Genes Dev. 2004;18:1926–1945. doi: 10.1101/gad.1212704. [DOI] [PubMed] [Google Scholar]
- 2.Fingar D.C., Blenis J. Target of rapamycin (TOR): an integrator of nutrient and growth factor signals and coordinator of cell growth and cell cycle progression. Oncogene. 2004;23:3151–3171. doi: 10.1038/sj.onc.1207542. [DOI] [PubMed] [Google Scholar]
- 3.Corradetti M.N., Guan K.L. Upstream of the mammalian target of rapamycin: do all roads pass through mTOR? Oncogene. 2006;25:6347–6360. doi: 10.1038/sj.onc.1209885. [DOI] [PubMed] [Google Scholar]
- 4.Avruch J., et al. Insulin and amino-acid regulation of mTOR signaling and kinase activity through the Rheb GTPase. Oncogene. 2006;25:6361–6372. doi: 10.1038/sj.onc.1209882. [DOI] [PubMed] [Google Scholar]
- 5.Inoki K., Zhu T., Guan K.L. TSC2 mediates cellular energy response to control cell growth and survival. Cell. 2003;115:577–590. doi: 10.1016/S0092-8674(03)00929-2. [DOI] [PubMed] [Google Scholar]
- 6.Byfield M.P., Murray J.T., Backer J.M. hVps34 is a nutrient-regulated lipid kinase required for activation of p70 S6 kinase. J. Biol. Chem. 2005;280:33076–33082. doi: 10.1074/jbc.M507201200. [DOI] [PubMed] [Google Scholar]
- 7.Nobukuni T., et al. Amino acids mediate mTOR/raptor signaling through activation of class 3 phosphatidylinositol 3OH-kinase. Proc. Natl. Acad. Sci. U. S. A. 2005;102:14238–14243. doi: 10.1073/pnas.0506925102. [DOI] [PMC free article] [PubMed] [Google Scholar]
- 8.Findlay G.M., Yan L., Procter J., Mieulet V., Lamb R.F. A MAP4 kinase related to Ste20 is a nutrient-sensitive regulator of mTOR signalling. Biochem. J. 2007;403:13–20. doi: 10.1042/BJ20061881. [DOI] [PMC free article] [PubMed] [Google Scholar]
- 9.Harrington L.S., Findlay G.M., Lamb R.F. Restraining PI3K: mTOR signalling goes back to the membrane. Trends Biochem. Sci. 2005;30:35–42. doi: 10.1016/j.tibs.2004.11.003. [DOI] [PubMed] [Google Scholar]
- 10.Manning B.D. Balancing Akt with S6K: implications for both metabolic diseases and tumorigenesis. J. Cell Biol. 2004;167:399–403. doi: 10.1083/jcb.200408161. [DOI] [PMC free article] [PubMed] [Google Scholar]
- 11.Fisher T.L., White M.F. Signaling pathways: the benefits of good communication. Curr. Biol. 2004;14:R1005–R1007. doi: 10.1016/j.cub.2004.11.024. [DOI] [PubMed] [Google Scholar]
- 12.Um S.H., D’Alessio D., Thomas G. Nutrient overload, insulin resistance, and ribosomal protein S6 kinase 1, S6K1. Cell Metab. 2006;3:393–402. doi: 10.1016/j.cmet.2006.05.003. [DOI] [PubMed] [Google Scholar]
- 13.Um S.H., et al. Absence of S6K1 protects against age- and diet-induced obesity while enhancing insulin sensitivity. Nature. 2004;431:200–205. doi: 10.1038/nature02866. [DOI] [PubMed] [Google Scholar]
- 14.Gelling R.W., et al. Insulin action in the brain contributes to glucose lowering during insulin treatment of diabetes. Cell Metab. 2006;3:67–73. doi: 10.1016/j.cmet.2005.11.013. [DOI] [PubMed] [Google Scholar]
- 15.Inoue H., et al. Role of hepatic STAT3 in brain-insulin action on hepatic glucose production. Cell Metab. 2006;3:267–275. doi: 10.1016/j.cmet.2006.02.009. [DOI] [PubMed] [Google Scholar]
- 16.Konner A.C., et al. Insulin action in AgRP-expressing neurons is required for suppression of hepatic glucose production. Cell Metab. 2007;5:438–449. doi: 10.1016/j.cmet.2007.05.004. [DOI] [PubMed] [Google Scholar]
- 17.Obici S., Zhang B.B., Karkanias G., Rossetti L. Hypothalamic insulin signaling is required for inhibition of glucose production. Nat. Med. 2002;8:1376–1382. doi: 10.1038/nm798. [DOI] [PubMed] [Google Scholar]
- 18.Pocai A., et al. Hypothalamic K(ATP) channels control hepatic glucose production. Nature. 2005;434:1026–1031. doi: 10.1038/nature03439. [DOI] [PubMed] [Google Scholar]
- 19.Kraegen E.W., et al. Development of muscle insulin resistance after liver insulin resistance in high-fat-fed rats. Diabetes. 1991;40:1397–1403. doi: 10.2337/diabetes.40.11.1397. [DOI] [PubMed] [Google Scholar]
- 20.Wang J., et al. Overfeeding rapidly induces leptin and insulin resistance. Diabetes. 2001;50:2786–2791. doi: 10.2337/diabetes.50.12.2786. [DOI] [PubMed] [Google Scholar]
- 21.Lam T.K., Gutierrez-Juarez R., Pocai A., Rossetti L. Regulation of blood glucose by hypothalamic pyruvate metabolism. Science. 2005;309:943–947. doi: 10.1126/science.1112085. [DOI] [PubMed] [Google Scholar]
- 22.Obici S., et al. Central administration of oleic acid inhibits glucose production and food intake. Diabetes. 2002;51:271–275. doi: 10.2337/diabetes.51.2007.S271. [DOI] [PubMed] [Google Scholar]
- 23.Holz M.K., Blenis J. Identification of S6 kinase 1 as a novel mammalian target of rapamycin (mTOR)-phosphorylating kinase. J. Biol. Chem. 2005;280:26089–26093. doi: 10.1074/jbc.M504045200. [DOI] [PubMed] [Google Scholar]
- 24.Schalm S.S., Tee A.R., Blenis J. Characterization of a conserved C-terminal motif (RSPRR) in ribosomal protein S6 kinase 1 required for its mammalian target of rapamycin-dependent regulation. J. Biol. Chem. 2005;280:11101–11106. doi: 10.1074/jbc.M413995200. [DOI] [PubMed] [Google Scholar]
- 25.Shah O.J., Hunter T. Turnover of the active fraction of IRS1 involves raptor-mTOR- and S6K1-dependent serine phosphorylation in cell culture models of tuberous sclerosis. Mol. Cell. Biol. 2006;26:6425–6434. doi: 10.1128/MCB.01254-05. [DOI] [PMC free article] [PubMed] [Google Scholar]
- 26.Tzatsos A., Kandror K.V. Nutrients suppress phosphatidylinositol 3-kinase/Akt signaling via raptor-dependent mTOR-mediated insulin receptor substrate 1 phosphorylation. Mol. Cell. Biol. 2006;26:63–76. doi: 10.1128/MCB.26.1.63-76.2006. [DOI] [PMC free article] [PubMed] [Google Scholar]
- 27.Shah O.J., Wang Z., Hunter T. Inappropriate activation of the TSC/Rheb/mTOR/S6K cassette induces IRS1/2 depletion, insulin resistance, and cell survival deficiencies. Curr. Biol. 2004;14:1650–1656. doi: 10.1016/j.cub.2004.08.026. [DOI] [PubMed] [Google Scholar]
- 28.Tang H., et al. Amino acid-induced translation of TOP mRNAs is fully dependent on phosphatidylinositol 3-kinase-mediated signaling, is partially inhibited by rapamycin, and is independent of S6K1 and rpS6 phosphorylation. Mol. Cell. Biol. 2001;21:8671–8683. doi: 10.1128/MCB.21.24.8671-8683.2001. [DOI] [PMC free article] [PubMed] [Google Scholar]
- 29.Wu Q., Zhang Y., Xu J., Shen P. Regulation of hunger-driven behaviors by neural ribosomal S6 kinase in Drosophila. Proc. Natl. Acad. Sci. U. S. A. 2005;102:13289–13294. doi: 10.1073/pnas.0501914102. [DOI] [PMC free article] [PubMed] [Google Scholar]
- 30.Hara K., et al. Raptor, a binding partner of target of rapamycin (TOR), mediates TOR action. Cell. 2002;110:177–189. doi: 10.1016/S0092-8674(02)00833-4. [DOI] [PubMed] [Google Scholar]
- 31.Nojima H., et al. The mammalian target of rapamycin (mTOR) partner, raptor, binds the mTOR substrates p70 S6 kinase and 4E-BP1 through their TOR signaling (TOS) motif. J. Biol. Chem. 2003;278:15461–15464. doi: 10.1074/jbc.C200665200. [DOI] [PubMed] [Google Scholar]
- 32.Koketsu Y., et al. Hepatic overexpression of a dominant negative form of raptor enhances Akt phosphorylation and restores insulin sensitivity in K/KAy mice. Am. J. Physiol. Endocrinol. Metab. 2008;294:E719–E725. doi: 10.1152/ajpendo.00253.2007. [DOI] [PubMed] [Google Scholar]
- 33.Samuel V.T., et al. Mechanism of hepatic insulin resistance in non-alcoholic fatty liver disease. J. Biol. Chem. 2004;279:32345–32353. doi: 10.1074/jbc.M313478200. [DOI] [PubMed] [Google Scholar]
- 34.Anai M., et al. Enhanced insulin-stimulated activation of phosphatidylinositol 3-kinase in the liver of high-fat-fed rats. Diabetes. 1999;48:158–169. doi: 10.2337/diabetes.48.1.158. [DOI] [PubMed] [Google Scholar]
- 35.Prada P.O., et al. Western diet modulates insulin signaling, c-Jun N-terminal kinase activity, and insulin receptor substrate-1ser307 phosphorylation in a tissue-specific fashion. Endocrinology. 2005;146:1576–1587. doi: 10.1210/en.2004-0767. [DOI] [PubMed] [Google Scholar]
- 36.Ueno M., et al. Regulation of insulin signalling by hyperinsulinaemia: role of IRS-1/2 serine phosphorylation and the mTOR/p70 S6K pathway. Diabetologia. 2005;48:506–518. doi: 10.1007/s00125-004-1662-6. [DOI] [PubMed] [Google Scholar]
- 37.Zabolotny J.M., et al. Protein tyrosine phosphatase 1B (PTP1B) expression is induced by inflammation in vivo. J. Biol. Chem. . 2008;283:14230–14241. doi: 10.1074/jbc.M800061200. [DOI] [PMC free article] [PubMed] [Google Scholar]
- 38.Choudhury A.I., et al. The role of insulin receptor substrate 2 in hypothalamic and beta cell function. J. Clin. Invest. 2005;115:940–950. doi: 10.1172/JCI24445. [DOI] [PMC free article] [PubMed] [Google Scholar]
- 39.Kubota N., et al. Insulin receptor substrate 2 plays a crucial role in beta cells and the hypothalamus. J. Clin. Invest. 2004;114:917–927. doi: 10.1172/JCI21484. [DOI] [PMC free article] [PubMed] [Google Scholar]
- 40.Lin X., et al. Dysregulation of insulin receptor substrate 2 in beta cells and brain causes obesity and diabetes. J. Clin. Invest. 2004;114:908–916. doi: 10.1172/JCI22217. [DOI] [PMC free article] [PubMed] [Google Scholar]
- 41.Gual P., Le Marchand-Brustel Y., Tanti J.F. Positive and negative regulation of insulin signaling through IRS-1 phosphorylation. Biochimie. 2005;87:99–109. doi: 10.1016/j.biochi.2004.10.019. [DOI] [PubMed] [Google Scholar]
- 42.Tremblay F., et al. Overactivation of S6 kinase 1 as a cause of human insulin resistance during increased amino acid availability. Diabetes. 2005;54:2674–2684. doi: 10.2337/diabetes.54.9.2674. [DOI] [PubMed] [Google Scholar]
- 43.Cota D., et al. Hypothalamic mTOR signaling regulates food intake. Science. 2006;312:927–930. doi: 10.1126/science.1124147. [DOI] [PubMed] [Google Scholar]
- 44.Pocai A., et al. Restoration of hypothalamic lipid sensing normalizes energy and glucose homeostasis in overfed rats. J. Clin. Invest. 2006;116:1081–1091. doi: 10.1172/JCI26640. [DOI] [PMC free article] [PubMed] [Google Scholar]
- 45.Miyake S., et al. Efficient generation of recombinant adenoviruses using adenovirus DNA-terminal protein complex and a cosmid bearing the full-length virus genome. Proc. Natl. Acad. Sci. U. S. A. 1996;93:1320–1324. doi: 10.1073/pnas.93.3.1320. [DOI] [PMC free article] [PubMed] [Google Scholar]
- 46.Obici S., Feng Z., Arduini A., Conti R., Rossetti L. Inhibition of hypothalamic carnitine palmitoyltransferase-1 decreases food intake and glucose production. Nat. Med. 2003;9:756–761. doi: 10.1038/nm873. [DOI] [PubMed] [Google Scholar]
Associated Data
This section collects any data citations, data availability statements, or supplementary materials included in this article.


