Abstract
GTF2I and GTF2IRD1 encode members of the TFII-I transcription factor family and are prime candidates in the Williams syndrome, a complex neurodevelopmental disorder. Our previous expression microarray studies implicated TFII-I proteins in the regulation of a number of genes critical in various aspects of cell physiology. Here, we combined bioinformatics and microarray results to identify TFII-I downstream targets in the vertebrate genome. These results were validated by chromatin immunoprecipitation and siRNA analysis. The collected evidence revealed the complexity of TFII-I-mediated processes that involve distinct regulatory networks. Altogether, these results lead to a better understanding of specific molecular events, some of which may be responsible for the Williams syndrome phenotype.
Keywords: GTF2I, Williams–Beuren syndrome
TFII-I proteins represent a ubiquitously expressed versatile protein family with broad functional activities (1–7). GTF2I and GTF2IRD1 are localized in the 7q11.23 chromosomal region, deletion of which causes the Williams syndrome, a complex developmental disorder characterized by cardiac, craniofacial, behavioral, and cognitive anomalies (8–11). Haploinsufficiency in GTF2I and GTF2IRD1 may be responsible for some of these manifestations (9). The knowledge of downstream events is important for the molecular dissection of this disorder; therefore, we have applied conventional biochemical and bioinformatics approaches to find TFII-I target genes.
In our quest for downstream TFII-I targets, we performed a genome-wide search for a TFII-I binding consensus sequence in the mouse and human genome. We have conducted an extensive analysis of the promoter regions of the genes modulated by TFII-I factors in mouse embryonic fibroblasts (MEFs) (12, 13). Both bioinformatic tools and experimental approaches (ChIP and RNAi) were used to identify a number of new TFII-I target genes. The pathway classification of putative targets showed significant enrichment in genes involved in axon guidance, neurodevelopmental disorders, calcium signaling, cell cycle, and immune response. Our results support the view that TFII-I factors are complex scaffolding proteins and act as critical regulators coordinating the activity of multiple transcription factors, histone deacetylases, and signaling molecules.
Results
General Overview and Functional Annotation of BEN- and TFII-I-Modulated Genes.
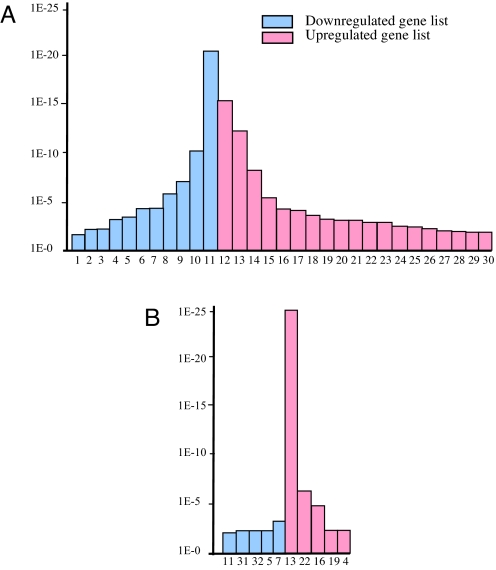
Our previous microarray studies identified 4,678 BEN- and 1,235 TFII-I-modulated genes (12, 13). Further classification of BEN- and TFII-I-modulated genes by using bioinformatics software DAVID showed a significant (P < 0.01) enrichment of genes involved in numerous pathways consistent with diverse biological functions of TFII-I proteins (Fig. 1). BEN-modulated genes were shown to be significantly associated with 30 different KEGG pathway terms, and TFII-I-modulated genes were enriched in 10 pathways than would be expected by random chance. All genes present in microarray were taken as the background in calculation of the significance of enrichment (P value) by using Fisher's exact test (14). The genes identified as being repressed by BEN were enriched with highest probability in the following pathways: neuroactive ligand–receptor interaction, complement and coagulation cascades, cytokine–cytokine receptor interaction, and hematopoietic cell lineage (P < 3.7E-06), whereas those activated by BEN were predominantly enriched in cell cycle, proteasome, ribosomal pathway, and focal adhesion (P < 1.6E-05). In the case of TFII-I regulated genes, the highest enrichment (P < 1.2E-29) has been observed for the ribosomal pathway genes. The eight pathway terms were enriched in both BEN- and TFII-I-regulated genes, among which genes involved in neuroactive ligand–receptor interaction, calcium signaling pathway, and cytokine–cytokine receptor interaction were repressed. The pathway terms for ribosome, gap junction, apoptosis, and adherens junction were shown to be activated in both the BEN- and TFII-I-modulated gene list. Genes involved in type I diabetes mellitus were repressed by BEN but activated by TFII-I, suggesting that these transcription factors may act in a counterregulatory fashion in this pathway.
Fig. 1.
Pathway involvement of BEN- (A) and TFII-I- (B) modulated genes. y axis, P values for significance of enrichment; x axis, KEGG pathway terms, listed as follows: 1, arachidonic acid metabolism; 2, nitrogen metabolism; 3, hedgehog signaling pathway; 4, type I diabetes mellitus; 5, calcium signaling pathway; 6, maturity-onset diabetes of the young; 7, cell adhesion molecules (CAMS); 8, hematopoietic cell lineage; 9, cytokine–cytokine receptor interaction; 10, complement and coagulation cascades; 11, neuroactive ligand–receptor interaction; 12, cell cycle; 13, ribosome; 14, proteasome; 15, focal adhesion; 16, apoptosis; 17, insulin signaling pathway; 18, antigen processing and presentation; 19, adherens junction; 20, MAPK signaling pathway; 21, ATP synthesis; 22, gap junction; 23, citrate cycle (tricarboxylic acid); 24, oxidative phosphorylation; 25, TGFβ signaling pathway; 26, reductive carboxylate cycle (CO2 fixation); 27, neurodegenerative disorders; 28, FcεRI signaling pathway; 29, Toll-like receptor signaling pathway; 30, dorso–ventral axis formation; 31, leukocyte transendothelial migration; 32, cysteine metabolism.
Bioinformatics and Microarray Searches for TFII-I Target Genes.
To identify the potential direct targets of TFII-I family proteins, we searched the database of transcriptional start sites DataBase of Transcriptional Start Sites (DBTSS), based on collection of experimentally determined 5′-end sequences of full-length cDNAs. Using pattern consensus BRGATTRBR, deduced from both SELEX experiments and comparison of natural binding sites (3–5), we have identified 1,722 mouse/human orthologous pairs containing this consensus within their proximal promoter regions (consensus list). However, our bioinformatics analysis is not exhaustive for several reasons, among them: (i) the current version of DBTTS (most complete for today) covers only 15,262 human and 14,162 mouse loci; (ii) consensus used in this search is based mainly on the binding activity of forth I-repeat of BEN and TFII-I and may represent only a subset of binding sites for entire TFII-I proteins; and (iii) we did not include potential binding sites located far than 1 kb upstream from mapped transcriptional starts. Therefore, we complemented our bioinformatics search with analysis of modulated genes found by expression microarray analysis in MEFs that overexpressed BEN or TFII-I (12, 13).
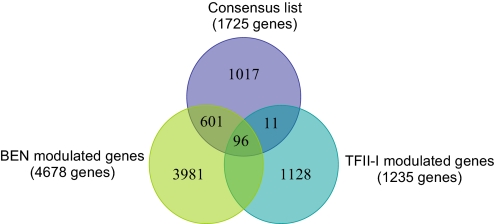
It is remarkable that comparison of 4,678 modulated genes from BEN microarray and 1,235 genes from TFII-I microarray data with our consensus-containing genes demonstrated significant overlapping between in silico predicted and experimentally found targets: 96 genes are common in all three gene lists, 601 genes are common for the BEN-regulated gene list and the consensus list, and 11 genes are common for TFII-I-regulated genes and the consensus list. Overall, 708 BEN- and TFII-I-modulated genes are shown to bear a binding motif in their proximal promoter (Fig. 2). The DAVID analysis of the latter set of genes showed significant enrichment for genes involved in purine and pyrimidine metabolisms and axon guidance (Table 1).
Fig. 2.
Alignment and classification of target genes. Venn diagram shows the alignment of microarray-modulated genes and bioinformatics promoter search results.
Table 1.
Pathway involvement of BEN- and TFII-I-modulated genes with the TFII-I consensus binding motif within their promoter region
| Genes | KEGG pathway terms | Count | P value |
|---|---|---|---|
| BEN- and TFII-I-modulated genes with binding sites (n = 686) | Pyrimidine metabolism | 12 | 9.7E-03 |
| Purine metabolism | 16 | 1.4E-02 | |
| Axon guidance | 13 | 5.5E-02 |
To analyze further the distribution of the identified putative TFII-I-binding sites, we tested their association with known sequence elements of mammalian core promoters. An overwhelming majority of TFII-I-binding sites were identified in TATA-less promoters containing the Initiator sequence; however, there was no overrepresentation of Initiator compared with the whole set of promoters in DBTSS. Moreover, we have not detected statistically significant association of the TFII-I-binding consensus with GC-box, CCAAT-box, and E-box sites, as well as with recently discovered core promoter elements of human TATA-less promoters M3-motif, M22-motif, and X Core Promoter Element 1 (15, 16).
Recruitment of BEN and TFII-I to the Proximal Promoters of Target Genes.
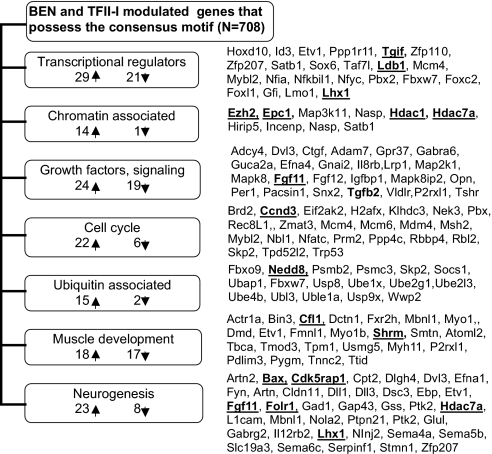
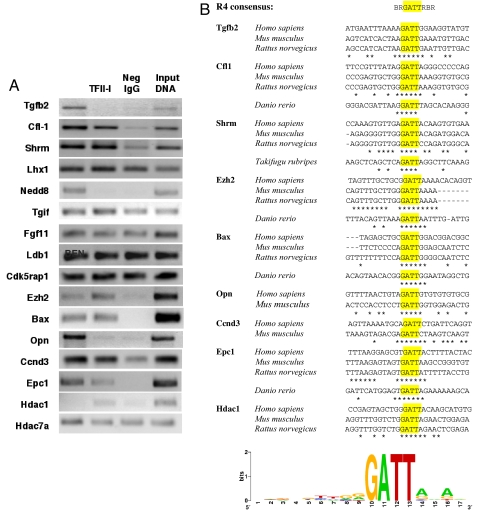
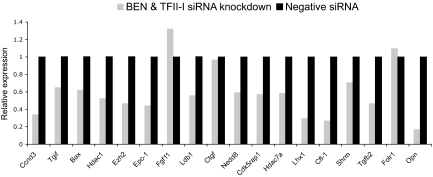
Eighteen candidate target genes representing various functional groups/pathways (Fig. 3) were selected for further analysis. Their down-regulation was confirmed by quantitative real-time (QRT)-PCR. To assess whether TFII-I and BEN can be recruited to promoters of selected candidate target genes, we performed ChIP analysis with MEFs. This cell line has endogenously expressed TFII-I proteins. Our ChIP results showed enrichment of both BEN and TFII-I in promoters of Bax, Shrm, Cfl-1, Ezh2, Epc1, and Ccnd3, whereas Tgfb2, Nedd8, and Opn were enriched in BEN only and Hdac1 in TFII-I only (Fig. 4). The BEN-specific recruitment to the Tgfb2 promoter is consistent with our previous microarray and QRT-PCR analyses where ectopic expression of BEN in MEFs resulted in activation of Tgfb2 expression, but no change was observed in TFII-I expressed MEFs (12, 13). No binding was detected for Lhx1, Tgif, Fgf11, Ldb1, Cdk5rap1, and Hdac7a in MEFs (Fig. 4), although they can be differentially regulated by siRNA knockdown. It is more likely that they are not primary TFII-I targets and their modulation occurs via secondary mechanisms.
Fig. 3.
Classification of target genes with the TFII-I-binding motif. Candidate genes selected for further validation are shown in bold.
Fig. 4.
In vivo recruitment of BEN and TFII-I to proximal promoters of target genes. (A) ChIP analysis of target genes in MEFs endogenously expressing BEN and TFII-I. (B) Conservation of upstream elements containing the putative TFII-I-binding site. Fish species are shown for those genes where reliable alignments of 5′-untranslated regions are available. Identical nucleotides are starred. Thirty vertebrate sequences shown were used for calculation of logo with WebLogo software (30). The height of letters correlates with degree of conservation.
Phylogenetic footprints generated by aligning the putative motif in the context of flanking sequences upstream of the ChIP-positive genes suggest the evolutionary conservation of a core tetranucleotide GATT with further conservation in flanking sequences between orthologs (Fig. 4).
Double siRNA Knockdown of TFII-I Proteins Results in a Concomitant Decrease in Target Gene Expressions.
QRT-PCR analysis revealed that double siRNA knockdown of Gtf2i and Gtf2ird1 in MEFs resulted in >80% reduction of expression for both genes (data not shown). Further analysis of expression levels of selected candidate genes involved in transcriptional regulation (Ldb1, Lhx1, Tgif), chromatin remodeling (Ezh2, Epc1, Hdac1, Hdac7a), ubiquitination (Nedd8), cell cycle (Ccnd3, Cdk5rap1), apoptosis (Bax), cytoskeleton (Shrm, Cfl-1), and signaling (Tgfb2, Opn) showed down-regulation (Fig. 5). Among studied genes, Opn was repressed the most (4.2-fold) followed by Cfl-1, Lhx1, Ccnd3, and Epc-1. A slight expression increase (1.3-fold) was observed for Fgf11 (Fig. 5).
Fig. 5.
Validation of target genes by double siRNA knockdown of BEN and TFII-I in MEFs. Expression fold changes were calculated relative to control negative siRNA treatment for each gene. Data were analyzed by comparative Ct method using β-actin as a control.
Discussion
TFII-I family proteins play an important role in cellular and embryonic processes. Our studies revealed that a large number of TFII-I- and BEN-modulated genes involved in transcriptional regulation, signal transduction, immune response, and chromatin remodeling possess the BEN/TFII-I-binding consensus sequence. For some of these binding sites, we provided experimental validation. Our data showed that TFII-I proteins recruit to promoters of genes involved in chromatin remodeling Ezh2 and Epc1. TFII-I but not BEN recruits to the promoter of Hdac1. It is well known that the TGFβ signaling pathway plays an important role in the activity of TFII-I proteins (17, 18). We identified Tgfb2 as a potential downstream target of BEN in MEFs. However, we failed to detect TFII-I binding at the Tgfb2 promoter. Opn, important cytokine regulator, and Nedd8, involved in ubiquitination, were also identified as BEN-specific targets. TFII-I proteins are known to be involved in cell cycle regulation through their interaction with Rb protein (19) or regulation of cyclin D1 (20). Here, we have demonstrated that both BEN and TFII-I recruited to the promoter of Ccnd3, which supports the role of TFII-I transcription factors in the cell cycle. Another two newly identified targets, Cfl-1 and Shrm, members of cofilin and shroom families, have been implicated in the control of actin cytoskeleton (21, 22). Shrm localizes to the apical tip of adherens junctions of neural ectoderm cells and works through myosin II to regulate apical construction (23, 24), the process essential for neural tube closure. The deficiency in Shrm results in exencephaly and spina bifida shown in both mouse and Xenopus embryos (23, 25). Cofilins localize to the regions of rapid actin dynamics, and their most important physiological function is to depolymerize filaments from their pointed ends, thereby increasing actin dynamics (21). Complete lack of neural tube closure was observed in the case of Cfl-1 mutant embryos (26). Our recent work indicated that TFII-I is critical in the neural tube closure event (D.B., unpublished results). It is possible that TFII-I participates in this activity through regulation of Shrm and Cfl1.
In summary, we have extended our previous expression profiling work with TFII-I-modulated genes in MEFs, and we presented here an integrated strategy for exploring TFII-I targets. Our work represents a genome-wide analysis of TFII-I targets and suggests pathways that are under control of BEN and TFII-I.
Materials and Methods
Array and Bioinformatics Analysis.
Expression profiling data used in this work were those published in our previous studies (12, 13). Putative TFII-I-binding sites were searched as a pattern consensus on both strands within −1,000 to +200 genomic regions around human/mouse conserved 5′-ends of cDNAs by using DBTSS [http://dbtss.hgc.jp/ (27)]. Genomic sequences of orthologous genes containing putative TFII-I binding sites were then isolated from GenBank (where available) and aligned with ClustalW by using MacVector 7.2 (Oxford Molecular Group). Web-accessible bioinformatics program DAVID (Database for Annotation, Visualization, and Integrated Discovery, http://david.abcc.ncifcrf.gov) was used for functional classification and pathway analysis of modulated genes (14, 28). Examination of the association of the TFII-I-binding consensus with core promoter elements was performed by using the same set of mouse/human conservative promoters of DBTSS. Patterns used for these database searches were GGGCGC (GC-box), YCAAT (CCAAT-box), CANNGT (E-box), DSGYGGRASM (XCPE1), SCGGAAGY (M3-motif), and TGCGCANK (M22-motif).
Double siRNA Knockdown Assay.
MEFs (5 × 10⁵) were seeded into 6-well plates 24 h before transfection. The oligonucleotides for Gtf2i and Gtf2ird1 were combined at 10 nM concentrations each, and cells were transfected by using Lipofectamine 2000 (Invitrogen) according to the manufacturer's instructions. Twenty-four hours after transfection, cells were harvested for RNA isolation. The siRNA oligonucleotides targeting exon 33 of Gtf2i and exon 9 of Gtf2ird1 as well as silencer negative control siRNA were obtained from Ambion. Three independent transfections were performed with similar results.
QRT-PCR.
QRT-PCR was performed on the ABI Prism 7900 sequence detection system (Applied Biosystems) by using both TaqMan expression assays from Applied Biosystems and SYBR Green chemistry. cDNA was synthesized from 2 μg of RNA with an Omniscript reverse transcription kit (Qiagen, CA) with oligo(dT) primers. Triplicate experiments were performed from each cDNA. All transcript levels were normalized to that of actin, and the relative expression ratios were calculated by using the 2−ΔΔCt method of data analysis (29).
ChIP Assay.
The ChIP experiments were performed by using a ChIP-IT kit (Activ Motiff) according to the manufacturer's instructions. Briefly, MEFs were cross-linked with 1% formaldehyde for 10 min, lysed, and sonicated to an average DNA length of 500–1,000 bp. Immunoprecipitations (IPs) were performed at 4C°C overnight with goat polyclonal anti-TFII-I (Sc-9943; Santa Cruz Biotechnology) and for BEN with goat anti-WBSCR11 (Sc-14714; Santa Cruz Biotechnology), respectively. Positive and negative control antibodies were those supplied with the kit. Ten microliters of the chromatin supernatant was saved as Input DNA before IP. The experimental results were confirmed with independent IPs performed by using alternative antibodies from different sources; rabbit-anti mouse TFII-I (no. 4562; Cell Signaling Technology) and goat anti-mouse WBSCR11 (Sc-14711) and goat anti-mouse IgG (Sc-2028), used as negative control, obtained from Santa Cruz Biotechnology. The sequences of primers used for PCR analysis are available upon request. The amplification products for PCR analysis either covered BEN/TFII-I-binding consensus sequence at the 5′-untranslated region or were located in its close vicinity.
Acknowledgments.
This work was supported by the National Institutes of Health Grants R01 DE017205 and K02 DE18412 (to D.B.).
Footnotes
The authors declare no conflict of interest.
References
- 1.Roy AL. Signal-induced functions of the transcription factor TFII-I. Biochim Biophys Acta. 2007;1769:613–621. doi: 10.1016/j.bbaexp.2007.10.002. [DOI] [PMC free article] [PubMed] [Google Scholar]
- 2.Bayarsaihan D, et al. Genomic organization of the genes Gtf2ird1, Gtf2i, and Ncf1 at the mouse chromosome 5 region syntenic to the human chromosome 7q11.23 Williams syndrome critical region. Genomics. 2002;79:137–143. doi: 10.1006/geno.2001.6674. [DOI] [PubMed] [Google Scholar]
- 3.Polly P, et al. hMusTRD1α1 represses MEF2 activation of the troponin I slow enhancer. J Biol Chem. 2003;278:36603–36610. doi: 10.1074/jbc.M212814200. [DOI] [PubMed] [Google Scholar]
- 4.Vullhorst D, Buonanno A. Characterization of general transcription factor 3, a transcription factor involved in slow muscle-specific gene expression. J Biol Chem. 2003;278:8370–8379. doi: 10.1074/jbc.M209361200. [DOI] [PubMed] [Google Scholar]
- 5.Vullhorst D, Buonanno A. Multiple GTF2I-like repeats of general transcription factor 3 exhibit DNA-binding properties: Evidence for a common origin as a sequence-specific DNA interaction module. J Biol Chem. 2005;280:31722–31731. doi: 10.1074/jbc.M500593200. [DOI] [PubMed] [Google Scholar]
- 6.Hinsley TA, et al. Comparison of TFII-I gene family members deleted in Williams–Beuren syndrome. Protein Sci. 2004;13:2588–2599. doi: 10.1110/ps.04747604. [DOI] [PMC free article] [PubMed] [Google Scholar]
- 7.Makeyev AV, et al. GTF2IRD2 is located in the Williams–Beuren syndrome critical region 7q11.23 and encodes a protein with two TFII-I-like helix–loop–helix repeats. Proc Natl Acad Sci USA. 2004;101:11052–11057. doi: 10.1073/pnas.0404150101. [DOI] [PMC free article] [PubMed] [Google Scholar]
- 8.Hirota H, et al. Williams syndrome deficits in visual spatial processing linked to GTF2IRD1 and GTF2I on chromosome 7q11.23. Genet Med. 2003;5:311–321. doi: 10.1097/01.GIM.0000076975.10224.67. [DOI] [PubMed] [Google Scholar]
- 9.Tassabehji M, et al. GTF2IRD1 in craniofacial development of humans and mice. Science. 2005;310:1184–1187. doi: 10.1126/science.1116142. [DOI] [PubMed] [Google Scholar]
- 10.Palmer SJ, et al. Expression of Gtf2ird1, the Williams syndrome-associated gene, during mouse development. Gene Expression Patterns. 2007;7:396–404. doi: 10.1016/j.modgep.2006.11.008. [DOI] [PubMed] [Google Scholar]
- 11.van Hagen JM, et al. Contribution of CYLN2 and GTF2IRD1 to neurological and cognitive symptoms in Williams syndrome. Neurobiol Dis. 2007;26:112–124. doi: 10.1016/j.nbd.2006.12.009. [DOI] [PubMed] [Google Scholar]
- 12.Chimge NO, Mungunsukh O, Ruddle FH, Bayarsaihan D. Expression profiling of BEN-regulated genes in mouse embryonic fibroblasts. J Exp Zoolog. 2007;308:209–224. doi: 10.1002/jez.b.21129. [DOI] [PubMed] [Google Scholar]
- 13.Chimge NO, Mungunsukh O, Ruddle FH, Bayarsaihan D. Gene expression analysis of TFII-I-modulated genes in mouse embryonic fibroblasts. J Exp Zool. 2007;308:225–235. doi: 10.1002/jez.b.21134. [DOI] [PubMed] [Google Scholar]
- 14.Dennis G, Jr, et al. DAVID: Database for Annotation, Visualization, and Integrated Discovery. Genome Biol. 2003;4:P3. [PubMed] [Google Scholar]
- 15.Yang C, Bolotin E, Jiang T, Sladek FM, Martinez E. Prevalence of the initiator over the TATA box in human and yeast genes and identification of DNA motifs enriched in human TATA-less core promoters. Gene. 2007;389:52–65. doi: 10.1016/j.gene.2006.09.029. [DOI] [PMC free article] [PubMed] [Google Scholar]
- 16.Tokusumi Y, Ma Y, Song X, Jacobson RH, Takada S. The new core promoter element XCPE1 (X Core Promoter Element 1) directs activator-, mediator-, and TATA-binding protein-dependent but TFIID-independent RNA polymerase II transcription from TATA-less promoters. Mol Cell Biol. 2007;27:1844–1858. doi: 10.1128/MCB.01363-06. [DOI] [PMC free article] [PubMed] [Google Scholar]
- 17.Ku M, et al. Positive and negative regulation of the transforming growth factor β/activin target gene goosecoid by the TFII-I family of transcription factors. Mol Cell Biol. 2005;25:7144–7157. doi: 10.1128/MCB.25.16.7144-7157.2005. [DOI] [PMC free article] [PubMed] [Google Scholar]
- 18.Stasyk T, et al. Phosphoproteome profiling of transforming growth factor-β signaling: Abrogation of TGFβ1-dependent phosphorylation of TFII-I enhances cooperation of TFII-I and Smad3 in transcription. Mol Biol Cell. 2005;16:4765–4780. doi: 10.1091/mbc.E05-03-0257. [DOI] [PMC free article] [PubMed] [Google Scholar]
- 19.Yan X, et al. Characterization and gene structure of a novel retinoblastoma protein-associated protein similar to the transcription regulator TFII-I. Biochem J. 2000;345:749–757. [PMC free article] [PubMed] [Google Scholar]
- 20.Desgranges ZP, Roy AL. TFII-I: Connecting mitogenic signals to cell cycle regulation. Cell Cycle. 2006;5:356–359. doi: 10.4161/cc.5.4.2442. [DOI] [PubMed] [Google Scholar]
- 21.Carlier MF, et al. Actin-depolymerizing factor (ADF/cofilin) enhances the rate of filament turnover: Implication in actin-based motility. J Cell Biol. 1997;136:1307–1322. doi: 10.1083/jcb.136.6.1307. [DOI] [PMC free article] [PubMed] [Google Scholar]
- 22.Fairbank PD, et al. Shroom2 (APXL) regulates melanosome biogenesis and localization in the retinal pigment epithelium. Development. 2006;133:4109–4118. doi: 10.1242/dev.02563. [DOI] [PubMed] [Google Scholar]
- 23.Haigo SL, et al. Shroom induces apical constriction and is required for hingepoint formation during neural tube closure. Curr Biol. 2003;13:2125–2137. doi: 10.1016/j.cub.2003.11.054. [DOI] [PubMed] [Google Scholar]
- 24.Hildebrand JD. Shroom regulates epithelial cell shape via the apical positioning of an actomyosin network. J Cell Sci. 2005;118:5191–5203. doi: 10.1242/jcs.02626. [DOI] [PubMed] [Google Scholar]
- 25.Hildebrand JD, Soriano P. Shroom, a PDZ domain-containing actin-binding protein, is required for neural tube morphogenesis in mice. Cell. 1999;99:485–497. doi: 10.1016/s0092-8674(00)81537-8. [DOI] [PubMed] [Google Scholar]
- 26.Gurniak CB, Perlas E, Witke W. The actin-depolymerizing factor n-cofilin is essential for neural tube morphogenesis and neural crest cell migration. Dev Biol. 2005;278:231–241. doi: 10.1016/j.ydbio.2004.11.010. [DOI] [PubMed] [Google Scholar]
- 27.Suzuki Y, Yamashita R, Sugano S, Nakai K. DBTSS, DataBase of Transcriptional Start Sites: Progress report 2004. Nucleic Acids Res. 2004;32:D78–D81. doi: 10.1093/nar/gkh076. [DOI] [PMC free article] [PubMed] [Google Scholar]
- 28.Hosack DA, et al. Identifying biological themes within lists of genes with EASE. Genome Biol. 2003;4:R70. doi: 10.1186/gb-2003-4-10-r70. [DOI] [PMC free article] [PubMed] [Google Scholar]
- 29.Livak KJ, Schmittgen TD. Analysis of relative gene expression data using real-time quantitative PCR and the 2[-ΔΔC(T)] method. Methods. 2001;25:402–408. doi: 10.1006/meth.2001.1262. [DOI] [PubMed] [Google Scholar]
- 30.Crooks GE, Hon G, Chandonia J-M, Brenner SE. WebLogo: A sequence logo generator. Genome Res. 2004;14:1188–1190. doi: 10.1101/gr.849004. [DOI] [PMC free article] [PubMed] [Google Scholar]


